Prometheus monitoring example

Prometheus Metric Types

Prometheus Metric Types

Prometheus is a widely used open-source monitoring and alerting system built around a time-series data model. Instead of treating monitoring data as a collection of static values, Prometheus stores measurements as time series identified by metric names and labels. Choosing the correct metric type is therefore important because it determines how application and infrastructure behaviour can be represented, queried, and alerted on.

The four core Prometheus metric types are Counter, Gauge, Histogram, and Summary. Each serves a different monitoring purpose, from tracking cumulative events and current resource levels to analysing distributions such as request latency and response size. Understanding these differences is essential when instrumenting applications and designing reliable PromQL queries and alerts.

Counter metrics represent a cumulative value that normally increases over time, such as HTTP requests processed, errors generated, jobs completed, or bytes transmitted. A counter may reset when the instrumented process restarts, but it does not reset simply because Prometheus performs another scrape. PromQL functions such as rate() and increase() are commonly used to calculate the rate of change or the increase over a selected time window.

Gauge metrics represent a value that can move up or down. They are appropriate for measurements such as CPU utilisation, memory consumption, queue depth, active connections, or the current number of running processes. Unlike counters, gauges describe a current state rather than a cumulative total and can change in either direction between scrapes.

Histogram metrics measure the distribution of observed values by placing them into configured buckets. They are particularly useful for analysing request latency, response sizes, task durations, and other measurements where understanding the distribution is more valuable than knowing only an average. Histograms expose bucket counts, along with cumulative observations and a sum, allowing Prometheus to calculate useful latency and performance statistics with PromQL.

Summary metrics also measure distributions and can calculate configured quantiles over observations. They can be useful when an application needs percentile information such as the 50th, 90th, or 99th percentile of request latency. However, summaries and histograms have different operational characteristics: summary quantiles are generally calculated on the instrumented target, while histograms expose bucket data that can be aggregated centrally by Prometheus.

Selecting the appropriate metric type is therefore more than an instrumentation detail. It directly affects what questions can be answered from monitoring data, how metrics can be aggregated across instances, and how effectively PromQL can be used for dashboards and alerting. By understanding the strengths and limitations of counters, gauges, histograms, and summaries, you can build a monitoring model that provides much more meaningful insight into application and infrastructure behaviour.

Prometheus Observability • Block 1

Prometheus Metric Type Explorer

Choose a metric type and see what it measures, how its value behaves, and the PromQL pattern typically used with it.

Metric Definition
http_requests_total
A counter represents a cumulative value that normally increases over time. It is ideal for counting requests, errors, retries and other events.
Best for Requests, errors, events, retries
Behaviour Increases; may reset when the instrumented process restarts
Typical PromQL rate(...[5m])
Key question How many events occurred?
rate(http_requests_total[5m])
Behaviour
Cumulative event count
Increasing over time
<100ms
420
<250ms
660
<500ms
830
<1s
940
+Inf
1000
p50 82ms
p90 210ms
p99 480ms
1 2 3 4 5 6
Engineering takeaway: Use a Counter when you are counting something that accumulates. PromQL functions such as rate() and increase() turn that cumulative value into useful operational measurements.

Highlights: Prometheus Metric Types

Open-Source Monitoring 

Prometheus is an open-source monitoring and alerting toolkit that was developed initially at SoundCloud. It provides a flexible and powerful platform for monitoring various components of your infrastructure, including servers, containers, and applications. Its robust data model, extensive metrics collection capabilities, and adaptable query language make it a preferred choice for many organizations.

It operates based on a time series database model, collecting and storing metrics from various targets, including servers, applications, or any other component that generates data. Prometheus monitoring offers a versatile set of metric types that cater to different monitoring needs.

Prometheus has become indispensable in the world of cloud-native and containerized applications. It efficiently collects and stores metrics as time series data, offering powerful querying capabilities. But to harness Prometheus’s full potential, it’s crucial to understand its metric types, as they are the foundation of effective monitoring and alerting.

**Use Cases and Benefits**

Prometheus monitoring’s diverse metric types offer immense benefits across various use cases. Let’s explore some notable examples:

1. Infrastructure Monitoring: Prometheus can monitor server resource utilization, network traffic, and system health by utilizing counters and gauges. This allows for proactive system maintenance and efficient capacity planning.

2. Application Performance Monitoring (APM): Histograms and summaries enable detailed analysis of application performance metrics, including response times, latency distributions, and error rates. This helps identify bottlenecks and optimize application performance.

3. Alerting and Incident Management: Prometheus monitoring’s flexible alerting system can trigger notifications based on specific metric thresholds or patterns. This enables rapid incident response and proactive issue resolution. Let’s take a closer look at some of the prominent metric types:

**Four Prometheus Metric Types**

1. Counter: Counters are monotonically increasing metrics used to track the number of occurrences of an event. They are handy for measuring things like request counts or error rates.

2. Gauge: Gauges represent a specific value at a particular point in time. They are ideal for tracking metrics that can fluctuate, such as CPU or memory usage.

3. Histogram: Histograms provide insights into the statistical distribution of a set of values. They divide observations into configurable buckets, allowing for analysis of data distribution and quantiles.

4. Summary: Similar to histograms, summaries provide statistical insights. However, they calculate quantiles on the client side instead of the server side, making them more suitable for monitoring long-running tasks or services.

**Choosing the Right Metric Type**

Selecting the appropriate metric type is vital for accurate data representation and analysis. Understanding the use case of each type helps in leveraging their strengths:

– Use **counters** for monotonically increasing values.

– Opt for **gauges** when tracking fluctuating values.

– Choose **histograms** for bucketed distribution analysis.

– Select **summaries** when quantile information is needed.

By aligning your metrics with the right type, you ensure that your monitoring system is both efficient and insightful.

Prometheus Metric Types — The Four Pillars of Cloud‑Native Monitoring

Prometheus exposes four fundamental metric types, each designed for a specific kind of measurement. Understanding these types is essential for building reliable dashboards, alerts, and SLOs in Kubernetes, microservices, and distributed systems. These metric types define how Prometheus stores data, how queries behave, and how engineers interpret system health.

1. Counter — A Value That Only Goes Up

A counter is a cumulative metric that increases over time and resets only when the process restarts.

Use counters for anything that represents events or accumulated totals.

Examples

  • number of HTTP requests
  • number of errors
  • number of packets sent
  • number of jobs completed
  • number of retries

Key Behavior

  • monotonic (always increasing)
  • resets to zero on restart
  • used with rate() or increase() in PromQL

PromQL Example rate(http_requests_total[5m])

Counters are ideal for alerting on error rates, traffic spikes, and SLO burn rates.

2. Gauge — A Value That Goes Up and Down

A gauge represents a value that can increase or decrease.

Use gauges for current state measurements.

Examples

  • CPU usage
  • memory consumption
  • number of active sessions
  • queue length
  • temperature
  • pod replicas

Key Behavior

  • non‑monotonic
  • reflects real‑time state
  • ideal for capacity and resource monitoring

PromQL Example node_memory_MemAvailable_bytes

Gauges are perfect for resource dashboards, capacity planning, and autoscaling signals.

3. Histogram — Buckets for Distribution Analysis

A histogram samples observations and counts them into buckets.

It also tracks:

  • total count
  • sum of all observations
  • bucket counts

Histograms are essential for latency, request duration, and payload size analysis.

Examples

  • request latency distribution
  • response size distribution
  • job execution time
  • API call duration

Key Behavior

  • bucket boundaries define precision
  • used with histogram_quantile()
  • produces multiple time series per metric

PromQL Examplehistogram_quantile(0.95, rate(http_request_duration_seconds_bucket[5m]))

Histograms power p95/p99 latency dashboards, SLOs, and performance tuning.

4. Summary — Client‑Side Aggregated Quantiles

A summary calculates quantiles on the client side, not in Prometheus.

It tracks:

  • quantiles (p50, p90, p99)
  • total count
  • sum of observations

Examples

  • request latency quantiles
  • event processing time
  • custom application‑level timing

Key Behavior

  • quantiles computed locally (not aggregatable across instances)
  • useful for single‑instance metrics
  • less ideal for large distributed systems

PromQL Examplehttp_request_duration_seconds{quantile=”0.99″}

Summaries are best for single‑node performance metrics, local timing, and client‑side instrumentation.

Choosing the Right Metric Type — Practical Guidance

Use Counters for:

  • errors
  • requests
  • retries
  • events
  • throughput

Use Gauges for:

  • CPU/memory
  • queue depth
  • active connections
  • temperature
  • replica counts

Use Histograms for:

  • latency
  • payload size
  • execution time
  • distribution analysis
  • SLO quantiles

Use Summaries for:

  • per‑instance quantiles
  • local timing
  • non‑aggregated metrics

Histograms are preferred for cluster‑wide quantiles, while summaries are useful for local precision.

Outcome — Accurate, Reliable, Cloud‑Native Metrics

Understanding Prometheus metric types ensures:

  • correct alerting
  • accurate dashboards
  • reliable SLO calculations
  • scalable observability
  • predictable PromQL behavior

These four metric types form the foundation of Prometheus‑powered monitoring in Kubernetes, microservices, and distributed systems.

Prometheus Scraping Metrics

Scraping HTTP Endpoints

Prometheus collects these metrics by scraping HTTP endpoints that expose metrics, known as a pull model. Prometheus exporters built by the community can natively expose those endpoints or via the monitored component. In addition to supporting a wide range of programming languages, Prometheus also provides client libraries that can be used to instrument your code.

Prometheus can also scrape metrics from OpenMetrics. HTTP metrics are exposed via text-based formats (which are more widely used) or more robust and efficient protocol buffer formats. This format is human-readable, so you can open it in a browser or retrieve exposed metrics using a tool like curl.

Prometheus Data Types

Prometheus’ metric model supports only four metric types and is only available in client libraries. The exposition format represents all metric types using one or more underlying Prometheus data types.

This Prometheus data type includes a metric name, labels, and a floating value. In addition, an agent or a monitoring backend adds the timestamp when scraping metrics (Prometheus, for example). PromQL, short for Prometheus Querying Language, is the primary way to query metrics within Prometheus. You can display an expression’s return as a graph or export it using the HTTP API.

PromQL uses three Prometheus data types: scalars, range vectors, and instant vectors. It also uses strings, but only as literals. 


Prometheus Metric Types

Prometheus Observability • Block 2

Metric → Scrape → PromQL

Prometheus turns application and infrastructure measurements into queryable time series. Step through the pipeline to see how a metric moves from instrumentation to scraping, storage, PromQL and alerting.

Selected stage
Application
The application produces measurements such as request counts, latency, errors, active sessions or resource usage.
Input Application behaviour
Output Metric measurement
End-to-end path
Application measure
→
/metrics expose
→
Prometheus scrape
→
PromQL query
→
Output act
Example metric
# HELP http_requests_total Total HTTP requests
# TYPE http_requests_total counter
http_requests_total{method="GET",code="200"} 1248
Prometheus-compatible exposition format
Direct instrumentation: an application uses a Prometheus client library to create and expose metrics directly.
Engineering takeaway: Prometheus normally uses a pull model: the Prometheus server discovers targets and periodically scrapes their metrics endpoint. Once samples are stored as time series, PromQL can calculate rates, averages, aggregations and other operational views.

For Prometheus metric types, we want as many metrics as possible. These need to be stored to follow trends, understand what has been happening from a historical view, and better predict any issues. So, there are several parts to a Prometheus monitoring solution; we must collect the metrics, known as scraping, store them, and then analyze them. In addition, we need to consider storage security, compliance, and regulatory concerns for distributed systems observability.

Monitoring the correct metric is key; having metrics lets you view how the system performs. The Prometheus metrics types represent raw measurement of resource usage, which can help you plan for upgrading and tell you how many resources are being used.  

To be clear, there are two kinds of “types” in Prometheus. There are the metric types of metrics and the data types of PromQL expressions.

Prometheus has four metric types: 

  1. Counters
  2. Gauges
  3. Histograms 
  4. Summaries 

PromQL subsequently has four data types:

  1. Floats (mostly scalars) 
  2. Range vectors
  3. Instant vectors
  4. Time (though it’s often not counted in this category)

Let me briefly explain them:

Prometheus Metric Types Best Practices:

Now that we have explored the different metric types offered by Prometheus let’s discuss some best practices for using them effectively:

1. Choose the appropriate metric type for your use case. Consider each type’s characteristics and relevance to your monitoring needs.

2. Avoid combining unrelated metrics into a single metric type. This can lead to confusion and make it harder to analyze the data.

3. Use labels to add additional dimensions to your metrics. Labels allow you to differentiate between instances or environments, providing more context to your monitoring data.

Prometheus Pull Approach

It’s easy to monitor a Kubernetes cluster with the pull model because of service discovery and shared network access within the cluster. However, watching a dynamic fleet of virtual machines, AWS Fargate containers, or Lambda functions with Prometheus is hard. How come?

Identifying metrics endpoints for scraping is difficult; network security policies may restrict access to those endpoints. Prometheus Agent Mode was released at the end of 2021 to solve some of these problems. This mode collects metrics and sends them to a monitoring backend via the remote write protocol.
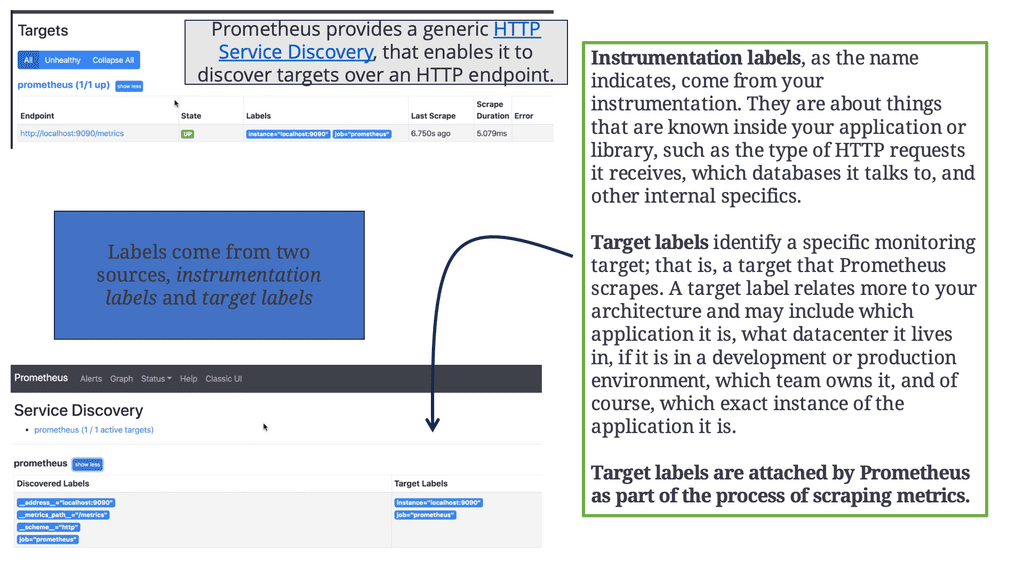
Prometheus target labels
Diagram: Prometheus Service Discovery and Labels

A) Prometheus Service Discovery

Prometheus discovers targets to scrape from service discovery. These can be instrumented or third-party applications you can scrape via an exporter. The scraped data is stored, and you can use it in dashboards using PromQL or send alerts to the Alertmanager, which will convert them into pages, emails, and other notifications. Metrics do not typically magically spring forth from applications; someone has to add the instrumentation that produces them.

B) Default Prometheus configuration.

In the following lab guide, you will see Prometheus’s default configuration. I have done a cat prometheus.yml, and you can see Prometheus is scaping itself for metrics. Prometheus is configured through a single YAML file.

The Prometheus YAML file serves as the configuration file for Prometheus and defines the various aspects of the monitoring setup. It consists of a set of key-value pairs organized in a hierarchical structure, instructing Prometheus on what to scrape, how to scrape it, and how to handle the collected data.
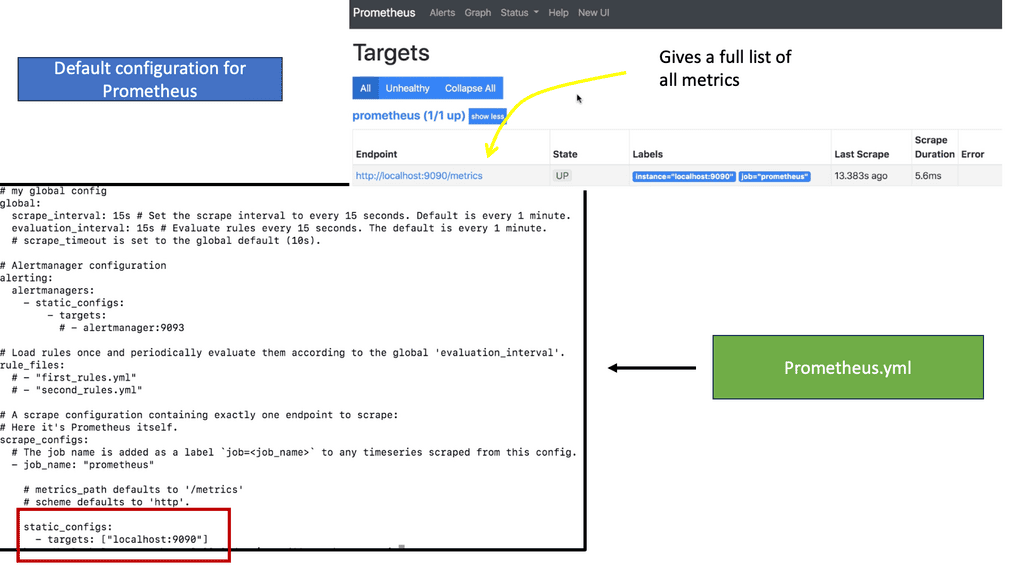
Prometheus YAML file
Diagram: Prometheus YAML file

C) Global Configuration:

This section defines global configurations applicable to the entire Prometheus setup. Key elements in this section include the scrape_interval (specifying the time interval between scrapes) and the evaluation_interval (determining how frequently Prometheus evaluates the collected data).

D) Scrape Configuration:

Prometheus collects metrics from various targets using scrape configurations. In this section, users can define scrape jobs, specifying the target endpoints, scrape intervals, and other related parameters. Each scrape configuration corresponds to a specific target, such as an application, database, or server.

E) Alerting Rules:

Prometheus allows users to define alerting rules to trigger notifications based on specific conditions. The alerting_rules section in the YAML file is dedicated to configuring these rules. Users can define rules for metrics thresholds, anomalies, or other necessary conditions for their monitoring needs.

Core Metric Types
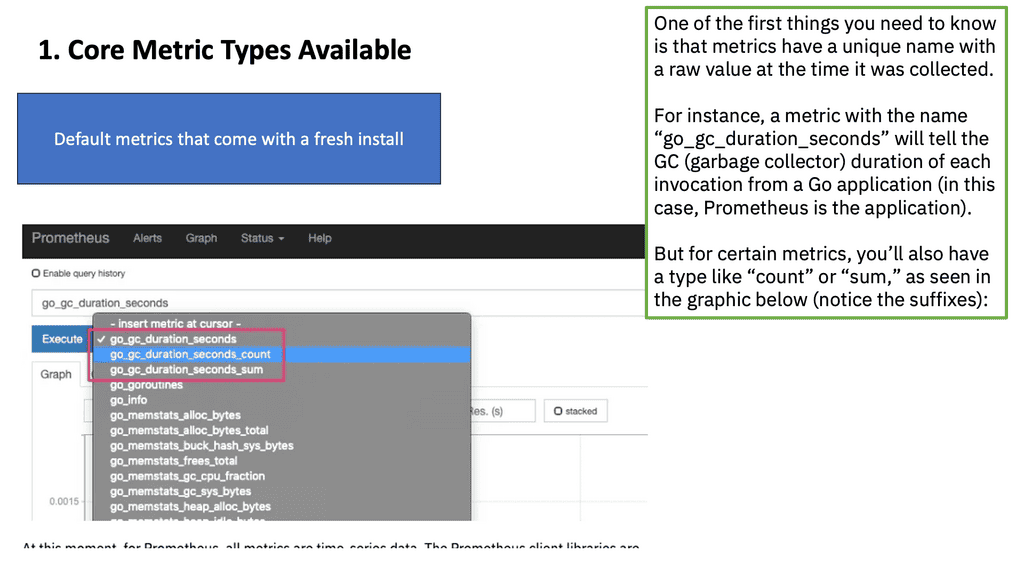
Core Metric Type
Diagram: Core Metric Type. Source is Sentinelone.

Direct Instrumentation with Client Libraries
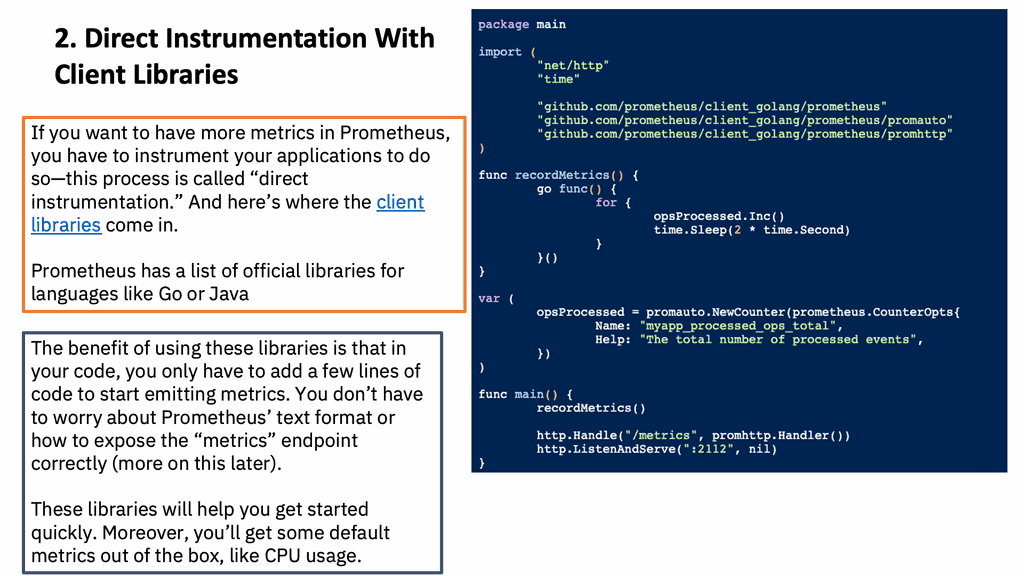
Client Libraries
Diagram: Direct Instrumentation. Source is Sentinelone.

Indirect Instrumentation with Exporters
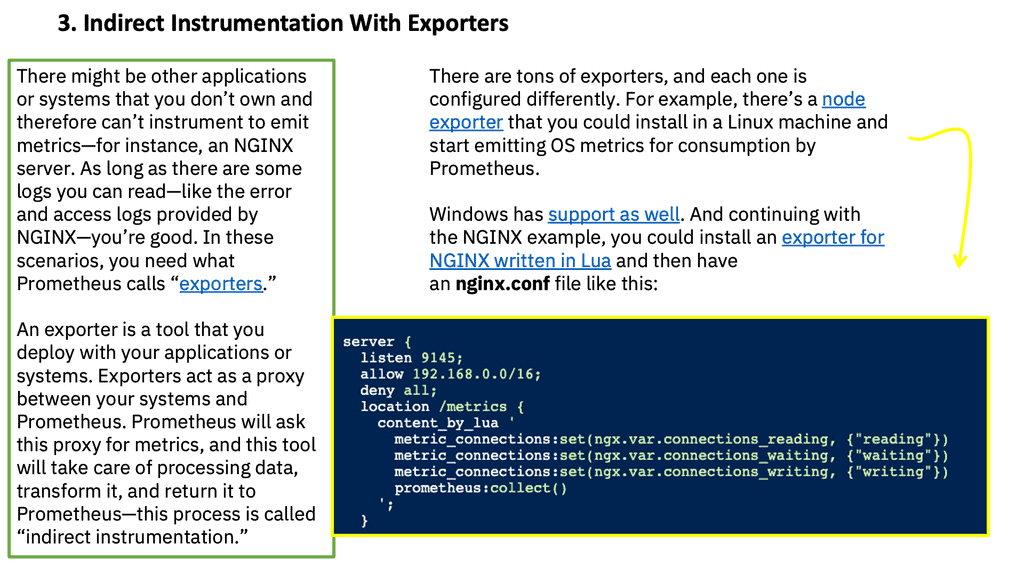
Indirect Instrumentation
Diagram: Indirect Instrumentation with Exporters. Source is Sentinelone.

You must remember that Prometheus is only used to collect and explore metrics. Because it uses a time series data model, data is identified by metric names and has key-value pairs.
Prometheus cannot be used for logging or event-driven architectures that require tracking of individual events. Notice that none of the examples or use cases I’ve used in previous sections relate to logs.

Prometheus is suitable for storing CPU usage, latency requests, error rates, or networking bandwidth.

Moreover, Prometheus makes trade-offs with the data it collects. This means that it will prefer to provide 99.99% accurate data (per their documentation) rather than degrade performance or break monitoring systems. You should avoid using this method to access essential information like a bank account balance because you may lose some data.

Starting with Prometheus Metric Types

Metrics can be applied to various components, are a unit of measurement for evaluating an item, and are consistently measured. Examples of common measurements include CPU utilization, memory utilization, and interface utilization. These are numbers about how your resources are performing.

For the metrics side of things, we have runtime, infrastructure, and application metrics, including Prometheus Exporters, response codes, and time-to-serve data. We also have CI/CD pipeline metrics such as build time and failures. Let’s discuss these in more detail.

**The process of exposition**

Exposition is the process of making metrics available to Prometheus. Exposition to Prometheus is done over HTTP. Usually, metrics are exposed under the /metrics path, and a client library handles the request. Prometheus supports both the Prometheus text format and OpenMetrics.

You can produce the exposition format by hand, which is easier with the Prometheus text format. If no suitable library exists for your language, a library is recommended. Most libraries will support both OpenMetrics and Prometheus text formats.

When metrics are defined, they are usually registered with the default registry. If one of the libraries you depend on has Prometheus instrumentation, you will benefit from it automatically. Some users prefer explicitly passing a registry down from the primary function, so you’d have to rely on each library between your application’s primary function and the Prometheus instrumentation to be aware of it. It assumes that all libraries in the dependency chain care about instrumentation and agree on which libraries to use.

**Detailing: Prometheus Metric Types**

The Prometheus client libraries offer four core metric types. These are currently only differentiated in the client libraries (to enable APIs tailored to the usage of the specific types) and in the wire protocol. The Prometheus server does not yet use the type information and flattens all data into untyped time series. This may change in the future.

a) Counters

The first metric type we’ll explore is the Counter. Counters are monotonically increasing values, meaning they only increase over time. These metrics often measure the number of requests served or the total number of events processed. Counters are reset to zero when the Prometheus server restarts, ensuring accurate measurements.

Countermetrics are used to increase measurements. Since they are cumulative, their value can only increase. Exceptionally, the counter’s value is reset to zero when it is restarted. A counter’s value could be more helpful on its own. However, a counter value is often used to compute the delta or rate of change between two timestamps.

Do not use a counter to expose a value that can decrease. For example, do not use a counter for the number of currently running processes; instead, use a gauge.

Client library usage documentation for counters:

b) Gauges

Next up, we have Gauges. Gauges represent a single numerical value that can arbitrarily go up or down. They are commonly used to track metrics like CPU usage or memory consumption. Unlike counters, gauges hold their value until explicitly changed by the exporter.

Gauge metrics measure increases or decreases. This metric type is more familiar since the actual value without additional processing is meaningful. A gauge is, for instance, a metric that measures the temperature, CPU, memory usage, or queue size.

Client library usage documentation for gauges:

c) Histograms

Histograms measure the distribution of values in a given dataset. Prometheus histograms are divided into configurable buckets, allowing you to track metrics such as response times or request sizes. Each bucket captures the number of observations falling into a specific range, making it easier to analyze data distribution.

A histogram represents a distribution of measurements. For example, request durations or response sizes are often measured with them. A histogram counts how many measurements fall into each bucket based on the entire range of measurements.

Client library usage documentation for histograms:
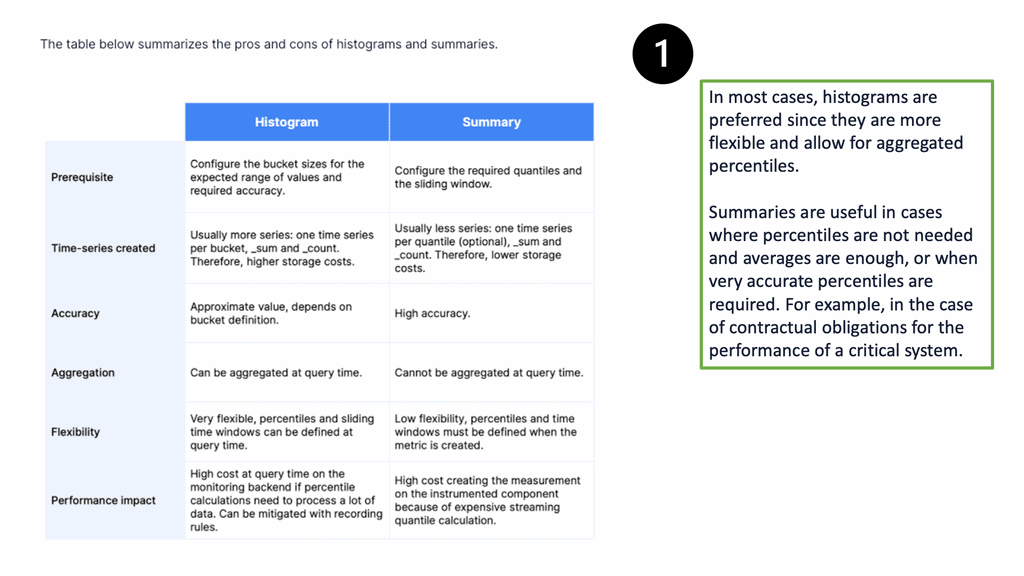
Prometheus Metric Types
Diagram: Prometheus Metric Types. Source timescale.

NOTE: Beginning with Prometheus v2.40, there is experimental support for native histograms. A native histogram requires only a one-time series, including a dynamic number of buckets and the sum and count of observations. Native histograms allow much higher resolution at a fraction of the cost. Detailed documentation will follow once native histograms are closer to becoming stable.

d) Summary

The Summary metric type is similar to histograms but focuses on calculating quantiles over a sliding time window. This makes it helpful in measuring request durations or API response times. Summaries provide information about the distribution of values, including the minimum, maximum, and quantiles.

Client library usage documentation for summaries:

**Summary vs. Histogram**

A critical distinction between summaries and histograms is their storage requirements. Summaries must retain a sample for each observed value, while histograms only store aggregated data points. Therefore, summaries are more memory-intensive but provide more precise quantile calculations.

  • Untyped

The untyped metric type is a catch-all category that can be used when none other metric types fit the collected data. It represents a value that can change over time but does not fall into any specific category. Untyped metrics are helpful when you require flexibility and simplicity, but they lack the advanced analysis capabilities of other metric types.

Highlighting Prometheus Monitoring

Auto Scaling Observability

Previously, Heapsters was used as a monitoring solution that came out of the box with Kubernetes. We now have Prometheus as the de facto standard monitoring system for Kubernetes clusters, bringing many benefits. Firstly, Prometheus monitoring scales with a pull approach and the Prometheus federated options. The challenge is that if we run microservices at scale and the monitoring system pushes metrics out to a metric server, the monitoring system can flood the network.

Also, with a push-based approach, you may need to scale up instead of out, which could be costly. We can have a bunch of different systems we want to monitor. Therefore, the metrics content will differ for the systems and components, but Prometheus collects and exports the same. This provides a welcomed layer of unification for the different systems in the network.
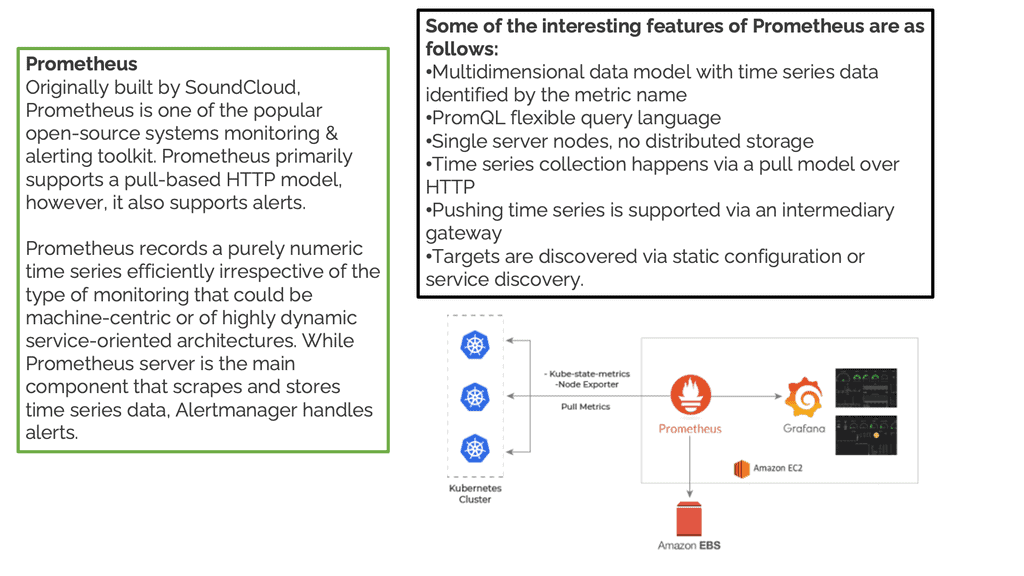
Prometheus Monitoring
Diagram: Prometheus Monitoring. Source is Opcito

Exporters and Client Libraries

With Prometheus monitoring, you can get metrics from the systems you want to monitor using pre-built exporters and custom client libraries. Prometheus works very well with Docker and Kubernetes but can also work outside the container networking world with non-cloud native applications using exporters.

You can monitor your entire stack with a wide range of exporters and client libraries. We install the code library and gather custom applications and runtime metrics for cloud-native applications. Installing code in the application lets us see the custom metrics that matter most to us.

What are Prometheus Exporters?

Prometheus exporters are software components that expose metrics in a format that Prometheus can scrape. They act as intermediaries between Prometheus and the systems or applications being monitored.

These exporters collect metrics from various sources, including databases, web servers, cloud platforms, and custom applications. By providing a standardized interface, exporters allow Prometheus to collect and store metrics from diverse sources uniformly.

Prometheus exporters work by exposing a web server that serves metrics in a format known as the Prometheus exposition format. This format consists of simple text-based data, usually in the form of key-value pairs. The exporters periodically expose an HTTP endpoint that Prometheus scrapes to collect the metrics. The scraped metrics are then stored in the Prometheus time-series database, where they can be queried and visualized.

Types of Prometheus Exporters:

Prometheus exporters come in various forms, each designed to collect metrics from specific systems or applications. Some famous exporters include:

1. Node Exporter collects system-level metrics such as CPU, memory, disk, and network statistics from Linux or Unix-based systems.

2. Blackbox Exporter: Allows monitoring of network endpoints by performing HTTP, TCP, ICMP, and DNS probes.

3. MySQL Exporter: Collects metrics from MySQL databases, providing insights into query execution time, connection statistics, and more.

4. Redis Exporter: This tool gathers metrics from Redis, a popular in-memory data structure store. It enables monitoring key performance indicators such as memory usage, latency, and throughput.

What are Prometheus Client Libraries?

Prometheus provides client libraries in various programming languages, including, but not limited to, Go, Java, Python, Ruby, and JavaScript. These libraries bridge your application and Prometheus, allowing you to collect and expose relevant metrics effortlessly.

1. Go Library:

Prometheus’ Go client library, known as “client_golang,” is widely used due to its simplicity and robustness. It provides a straightforward API to instrument your Go applications, making it easy to expose custom metrics, collect and record them, and serve them via an HTTP endpoint. You can seamlessly integrate Prometheus monitoring into your Go-based projects with the Go client library.

2. Java Library:

Prometheus offers a dedicated client library for Java-based applications called “client_java.” This library allows you to instrument your Java code using simple annotations, making it effortless to expose metrics. The Java library simplifies monitoring Java applications with features like automatic metric exposition via HTTP endpoints and support for popular Java frameworks like Spring Boot and Micronaut.

3. Python Library:

Prometheus’ Python client library, known as “client_python,” provides a Pythonic way to instrument your Python applications. With its intuitive API, you can easily expose custom metrics, collect and record them, and serve them via an HTTP endpoint. The Python library also supports popular web frameworks like Flask and Django, making it a convenient choice for developers.

4. Ruby Library:

For Ruby developers, Prometheus provides a client library called “client_ruby.” This library allows you to instrument your Ruby applications effortlessly. It offers features like metric collection, recording, and exposing metrics via an HTTP endpoint. The Ruby library integrates well with popular Ruby frameworks like Ruby on Rails, enabling seamless monitoring of Ruby applications.

5. JavaScript Library:

Prometheus’ JavaScript client library, known as “client_js,” enables web developers to instrument their JavaScript-based applications. This library lets you easily expose custom metrics, collect and record them, and serve them via an HTTP endpoint. The JavaScript library is compatible with both browser-based JavaScript and Node.js, making it versatile for monitoring frontend and backend applications.

Additional Metric Types:

  • Prometheus Metric type: Runtime metrics

Runtime Metrics are statistics collected by the operating system and application host. These include CPU usage, memory load, and web server requests. For example, this could be CPU and memory usage from a Tomcat and JVM from a Java app.

  • Prometheus Metric type: Infrastructure metrics

We examine CPU utilization, latency, bandwidth, memory, and temperature metrics for Infrastructure metrics. These metrics should be collected over a long period and applied to infrastructure such as networking equipment, hypervisors, and host-based systems.

  • Prometheus Metric type: Application metrics

Then, we have Application metrics and custom statistics relevant only to the application and not the infrastructure. Application metrics pertain specifically to an application. This may include the number of API calls made during a particular time. 

This can be quickly done with web-based applications; here, we can get many status codes that provide information. These metrics are easy to measure, and the response codes are available immediately. For example, an HTTP status code 200 is good, and 400 or more is an issue. 

  • Prometheus Metric type: Time to first byte

Another important metric is the time a web server takes to respond to the data. The important metric here is time to the first byte (TTFB). This measures how long it takes for your application to send data. Time to the first byte refers to the time between the browser requesting a page and when it receives the first byte of information from the server. If this metric exceeds the usual, you may need caching, faster storage, or a better CPU.

Let us take the example of the content delivery network (CDN); what is an excellent time to the first byte? On average, anything with a TTFB under 100 ms is fantastic. Anything between 200 and 500 ms is standard, and anything between 500 ms and 1 second is less than ideal. Anything more significant than 1 second should likely be investigated further.

  • Prometheus Metric type: CI/CD pipeline metrics

For the CI/CD Pipeline metrics, we want to measure the time to do the static code analysis. Next, we want to count the number of errors while running the pipeline. Finally, we want to measure the build time and build failures. These metrics include the time it takes to build an application, the time it takes to complete tests, and how often builds fail.  

  • Prometheus Metric type: Docker metrics

Docker metrics come from the Docker platform. These may include container health checks, the number of online and offline nodes in a cluster, and the number of containers and actions. These container actions may be stopped, paused, or run. So, we have built-in metrics provided by Docker to give additional visibility to the running containers. When running containers in production, monitoring their runtime metrics, such as CPU and memory usage, is essential.

Docker Metrics

Metrics from the Docker Platform are essential for containers when Docker stops and starts applications for you. You can’t gather one metric type without the other. For example, if you look at the application metrics, you only look at half of the puzzle and may miss the problem.

For example, if one of your applications is performing poorly and the docker platform constantly spins up new containers, you would not see that just under the application metrics. Your application and runtime metrics may seem to be within the standard thresholds. However, combining this with the Docker Platform metrics shows the container stats, showing a spike in container creation.

Exposing application metrics to Prometheus

Application metrics give you additional information. Unlike runtime metrics you get for free, you need to record what you care about explicitly. Here, we have client libraries that Prometheus offers. All the major languages have a Prometheus client library, which provides the metrics endpoint. The client library makes application metrics available to Prometheus, giving you a very high level of visibility into your application.

With Prometheus client libraries, you can see what is happening inside the application. So, we have both Prometheus exporters and Prometheus client libraries that allow Prometheus to monitor everything.  

Exposing Docker Metrics to Prometheus

First, Docker Default Networking 101. The Docker Engine interacts with all clients and collects and exports metrics. When you build a Docker image, the Engine records a metric. We need insights into the Docker platform. Here, we can expose Docker metrics to Prometheus. The Docker Engine has a built-in mechanism to export metrics in Prometheus format. So we have, for example, the Docker metrics covering the Engine and container and metrics about images. 

Docker metric types: Three types

The types of metrics have three areas. First, we have the Docker Engine, Builds, and Containers. 

    1. The Engine will give you information on the host, such as the CPU count, O/S version, and build of the Docker Engine. 
    2. Then, for Build metrics, it is helpful for information such as the number of builds triggered, canceled, and failed. 
    3. Container metrics also show the number of containers stopped and paused and the number of health checks that are fired and failed.

Wrap up: Prometheus monitoring.

So, for Prometheus monitoring, we have Prometheus exporters that can get metrics for, let’s say, a Linux server and application metrics that can support Prometheus using a client library.

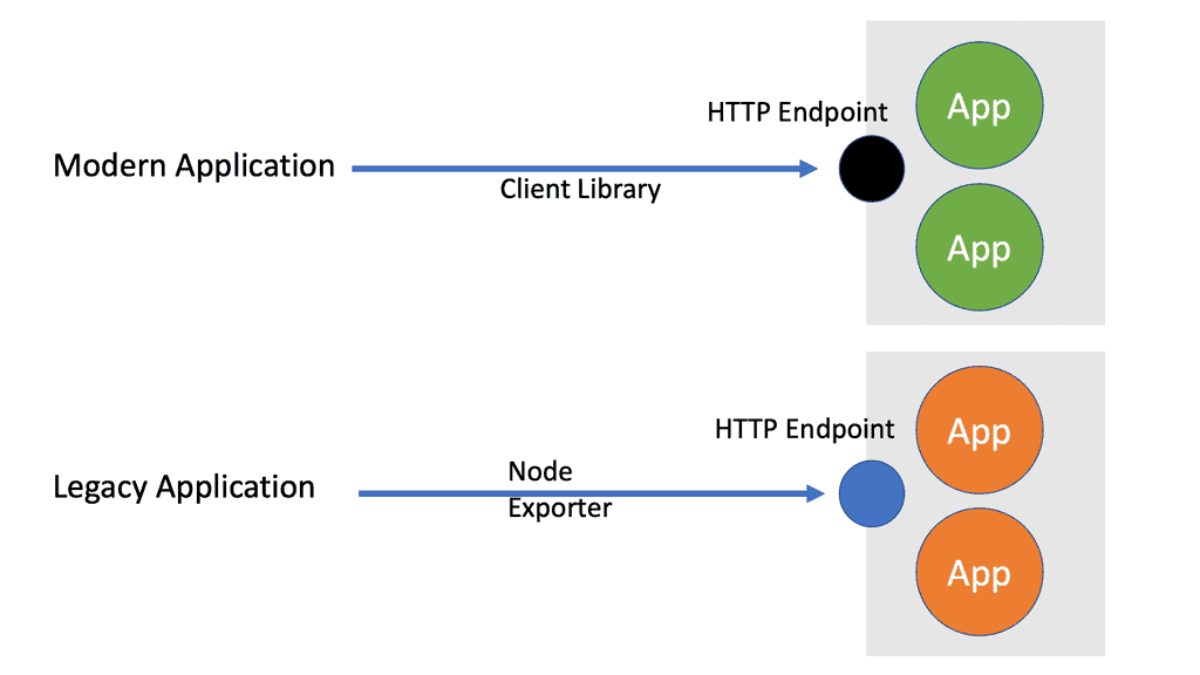
Both have an HTTP endpoint that returns metrics in the standard Prometheus format. Once the HTTP endpoint is up and running on the application ( legacy or cloud-native ), Prometheus will scrape ( collect ) the metric with dynamic or static approaches.

So we have Exporters that can add metrics to systems that don’t have Prometheus support. We also have Prometheus client libraries that can provide Prometheus support in the application. These client libraries can provide out-of-the-box runtime and custom metrics relevant to the applications.

Prometheus Observability • Block 3

Choose the Right Prometheus Metric

Test your metric design decisions. Read the operational question, choose the metric type that best represents the data, and then inspect the PromQL pattern behind the answer.

0 / 7
Scenario 1
How many HTTP requests has the application processed?
You need to track an accumulating event count and calculate the request rate over time.
✓
Correct
PromQL pattern


Score
0 / 7
Learning objective
Match the data model to the question
Engineering takeaway: Think about the question before choosing the metric. Events that accumulate usually need a Counter. Current state needs a Gauge. Distributions such as latency are commonly represented with a Histogram. A Summary is useful when client-side quantiles are specifically appropriate.
prometheus Monitoring

Prometheus Monitoring: The Pull Approach

Prometheus Monitoring: The Pull Approach

In modern monitoring and observability environments, Prometheus is widely used to collect, store, query, and alert on time-series metrics. One of its defining architectural characteristics is the pull-based collection model: rather than requiring every monitored application to continuously send metrics to a central monitoring service, the Prometheus server periodically connects to configured targets and scrapes their current metric values.

Prometheus was originally developed at SoundCloud and was designed around the operational requirements of dynamic, service-oriented environments. Its multi-dimensional data model identifies time series using metric names and labels, while PromQL provides a powerful language for filtering, aggregating, calculating rates, and analysing behaviour across infrastructure and applications. This combination makes Prometheus particularly effective for environments where services and workloads change frequently.

The pull model gives operators direct control over what is monitored, when it is scraped, and whether a target is currently reachable. A Prometheus server maintains a set of scrape targets through its configuration or service-discovery mechanisms and periodically requests metrics from each target’s HTTP endpoint. If a target becomes unavailable, that failure can itself become monitoring data, allowing operators to distinguish between an application reporting a problem and an endpoint that cannot be scraped at all.

The Prometheus Server forms the central component of this architecture. It discovers or receives its configured targets, performs metric scrapes, stores the resulting time-series data locally, evaluates recording and alerting rules, and provides PromQL query capabilities. The server therefore acts as both the collection engine and the primary query interface for the monitoring system.

Not every application exposes metrics in Prometheus’s native format. Exporters provide an integration layer for systems that need their existing statistics translated into Prometheus metrics. Node Exporter, for example, exposes operating-system and hardware-related metrics, while other exporters can provide visibility into databases, network services, storage platforms, or external systems. The exporter itself becomes a scrape target from the perspective of Prometheus.

Prometheus also separates metric evaluation from notification delivery through Alertmanager. Prometheus evaluates alerting rules and sends firing alerts to Alertmanager, which can then group related alerts, suppress duplicates, apply inhibition rules, and route notifications to appropriate receivers. This separation allows the monitoring engine to concentrate on detecting conditions while Alertmanager manages the operational notification workflow.

For visualisation, Prometheus integrates closely with Grafana. Grafana can query Prometheus using PromQL and transform the resulting time-series data into dashboards, graphs, tables, gauges, and other visual representations. This creates a practical observability workflow in which Prometheus provides collection, storage, querying, and alert evaluation while Grafana provides the visual interface used by engineers and operators.

The pull approach is therefore more than a mechanism for retrieving metrics. It forms part of Prometheus’s overall monitoring architecture, combining target discovery, periodic scraping, labelled time series, PromQL analysis, alert evaluation, and external visualisation. Understanding how these components interact provides the foundation for designing reliable Prometheus monitoring across dynamic infrastructure and distributed applications.

Prometheus Monitoring • Block 1

Pull vs Push Architecture

Prometheus asks targets for metrics on a controlled schedule. Compare that pull model with a traditional push architecture and see what happens when a monitored target becomes unavailable.

Collection direction
◉
Prometheus Server Controls when metrics are collected
→
HTTP scrape request
GET /metrics
▣
Application / Exporter Exposes metrics for Prometheus
Prometheus initiates the connection. It discovers a target, sends an HTTP request to its metrics endpoint, receives the samples, and records the result.

Prometheus scrape cycle

1
Discover target Configuration or service discovery identifies what should be scraped.
2
Open connection Prometheus connects to the target's reachable HTTP endpoint.
3
GET /metrics The scrape request asks the target for its current metric exposition.
4
Receive samples Prometheus parses the returned metrics and timestamps the samples.
5
Store and evaluate Samples enter the time-series database and become available to PromQL and alerting.

Failure visibility

Current target state
Target reachable
The last scrape completed successfully. Prometheus can record up = 1 for the target.
In Prometheus, up is a standard scrape-health metric: 1 means the last scrape succeeded; 0 means it failed.

Operational characteristics

Pull model

  • Monitoring system controls scrape timing.
  • Target discovery can be dynamic.
  • Failed scrapes provide explicit collection feedback.
  • Endpoint can be tested directly with tools such as curl.
  • Targets do not need to initiate unsolicited telemetry connections.

Push model

  • Targets or agents initiate telemetry delivery.
  • Collector address and delivery behaviour are target-side concerns.
  • Missing data may require heartbeat or timeout logic.
  • Useful for some event-driven or short-lived workloads.
  • Push systems can be appropriate when scraping is impractical.
Engineering takeaway Pull is more than a transport choice. It makes the monitoring system the active controller of collection, giving Prometheus predictable scrape timing, direct failure visibility, and a simple troubleshooting path from target → /metrics → stored time series.
Push is not inherently wrong. Prometheus also supports push-oriented patterns for specific use cases such as short-lived batch jobs through Pushgateway. It should not be treated as a general replacement for scraping long-running services.

Highlights: Prometheus Monitoring

Created by SoundCloud

In this post, I would like to discuss Prometheus monitoring and its pull-based approach ( Prometheus Pull ) to the metric collection and the Prometheus metric types. Prometheus is a powerful open-source monitoring system created by SoundCloud to monitor and alert the infrastructure and applications within their environment. It has since become one of the most popular monitoring systems due to its ability to monitor various services, from simple applications to complex distributed systems.

Pull-based System:

– Prometheus is designed to be simple to use. It uses a pull-based system, meaning it collects data from the services it monitors rather than having the services push the data to Prometheus. This makes it easy to set up and configure, allowing for great flexibility in the services it can monitor. It also has an intuitive user interface, making it easy to use and navigate.

– Understanding Prometheus’s architecture is crucial for effectively deploying and leveraging its capabilities. At its core, Prometheus consists of a server responsible for data collection, a time-series database for storing metrics, and a user interface for visualization and querying. The server scrapes metrics from various targets using exporters or service discovery, while the time-series database facilitates efficient storage and retrieval of collected data.

– Prometheus Monitoring integrates with many systems, making it highly versatile in diverse environments. It provides exporters with popular technologies like Kubernetes, Docker, and AWS, allowing an accessible collection of relevant metrics. Moreover, Prometheus can be integrated with other monitoring tools, such as Grafana, to create comprehensive dashboards and visualizations.

Key Features of Prometheus Monitoring:

1. Time-Series Database: Prometheus utilizes its own time-series database, tailored explicitly for efficiently storing and querying time-series data. This allows for real-time monitoring and analysis, enabling quick troubleshooting and performance optimization.

2. Flexible Query Language: PromQL, Prometheus’s query language, offers a powerful and expressive way to retrieve and manipulate metrics data. It supports various operations, including filtering, aggregation, and mathematical calculations, empowering users to extract meaningful insights from their monitoring data.

3. Alerting and Alert Manager: Prometheus has a built-in alerting mechanism that allows users to define alert rules based on specific conditions. Prometheus can trigger alerts when the Alert Manager component meets, manages, and routers such situations.

Prometheus Monitoring — The Pull‑Based Approach Explained

Prometheus is built around a pull‑based monitoring model, where the Prometheus server actively scrapes metrics from targets at regular intervals. This design is one of the core reasons Prometheus is reliable, scalable, and predictable in cloud‑native environments. Instead of agents pushing data into a central system, Prometheus controls the entire data‑collection lifecycle.

Why Prometheus Uses a Pull Model

Prometheus intentionally uses a pull approach because it provides:

  • full control over when and how metrics are collected
  • consistent sampling intervals for accurate time‑series analysis
  • simple failure detection (if a target doesn’t respond, it’s down)
  • secure, predictable data flow (no inbound connections required)
  • easy debugging (you can curl the metrics endpoint directly)
  • clean separation between metrics generation and metrics collection

The pull model is foundational to Prometheus’s reliability.

How the Pull Model Works

Prometheus performs the following steps:

  1. Reads the scrape configuration from prometheus.yml
  2. Discovers targets (static, Kubernetes, Consul, EC2, etc.)
  3. Sends HTTP GET requests to each target’s /metrics endpoint
  4. Receives plain‑text metrics in Prometheus exposition format
  5. Stores the metrics in its time‑series database (TSDB)
  6. Applies retention, compression, and indexing
  7. Exposes the data to PromQL queries, dashboards, and alerts

Every scrape is a controlled, predictable sampling event.

The `/metrics` Endpoint — The Heart of Prometheus Pull

Targets expose metrics via an HTTP endpoint, usually: 

This endpoint returns:

  • counters
  • gauges
  • histograms
  • summaries

All in Prometheus’s text‑based exposition format.

You can test it manually: curl http://localhost:9100/metrics

Service Discovery — Dynamic Pull in Cloud‑Native Environments

Prometheus integrates with multiple service‑discovery systems:

  • Kubernetes API
  • Consul
  • EC2
  • Azure
  • GCP
  • Docker Swarm
  • Static configs

In Kubernetes, Prometheus automatically discovers:

  • pods
  • services
  • endpoints
  • nodes

This makes the pull model ideal for dynamic, ephemeral workloads.

Security Benefits of Pull‑Based Monitoring

The pull model improves security because:

  • targets do not need to open inbound ports
  • Prometheus initiates all connections
  • firewall rules are simple (outbound only)
  • no agents push unverified data into the system
  • TLS and authentication can be applied per scrape

This reduces the attack surface significantly.

Advantages of Pull vs Push

Pull Advantages

  • predictable scrape intervals
  • easy debugging
  • simple failure detection
  • no agents required
  • consistent time‑series sampling
  • secure outbound‑only model

Push Advantages (rare cases)

  • high‑frequency events
  • short‑lived batch jobs
  • IoT devices with no HTTP stack

Prometheus supports push via the Pushgateway, but only for specific use cases.

Outcome — Reliable, Predictable, Cloud‑Native Monitoring

The pull approach ensures:

  • consistent time‑series data
  • simple debugging
  • secure data collection
  • scalable architecture
  • accurate alerting
  • deep integration with Kubernetes

Prometheus’s pull model is one of the reasons it became the de‑facto standard for cloud‑native monitoring.

**Challenge: The traditional approach** 

First, let us roll back in time before we had Prometheus network monitoring, say ten years, and look at the birth of monitoring and the tools used. The monitoring tools often operated in a silo, which led to more blind spots. 

The old approach to monitoring is considerably different from today’s approach to Observability.  Traditionally, you can use something like Ganglia to monitor. Ganglia was often used to monitor CDN networks involving several PoPs in different locations. However, within this CDN network, the PoPs look the same. The same servers, storage, etc., and only with the difference in the number of transit providers and servers.

Then, to alert people, we can use Icinga and have this on the back of the Ganglia. With this monitoring design, the infrastructure pushes metrics to the central collectors. The central collectors are in one location, maybe two for backup, but often two locations.

**Complexity and distributed systems**

However, you will see some issues as infrastructure grows ( infrastructure does grow at alarming rates ), and there is a need to push more metrics into Ganglia. For example, with some monitoring systems, the pushing style of the metric collection can cause scalability issues as the number of servers increases. Especially in more effective distributed systems observability use cases.

Within this CDN monitoring design, only one or two machines collect the telemetry for your infrastructures. So, as you scale your infrastructure and throw more data at the system, you have to scale up instead of out. This can be costly and will often hit bottlenecks.

**Scale with the Infrastructure**

However, you want a monitoring solution to scale your infrastructure growth. As you roll out new infrastructure to meet demands, you want to have monitoring systems that can scale. The monitoring system can scale as the infrastructure scales, such as in the use case with Prometheus network monitoring. However, with Ganglia and Icinga, we also have limited graphing functions.

Creating custom dashboards on unique metrics was difficult, and no alerting support existed. Also, there was no API to get and consume the metric data around that time. If you wanted to access the data and consume it in a different system or perform interesting analyses, all of it was locked into the Ganglia.


Prometheus Monitoring

Prometheus Monitoring • Block 2

Scrape & Service Discovery Lab

Prometheus does not need every target to be manually entered forever. Service discovery can dynamically identify targets, attach useful labels, and present Prometheus with scrape endpoints. Explore how a target moves from discovery to a queryable time series.

prometheus.yml

With static configuration, the scrape targets are explicitly defined in the Prometheus configuration.

Discovered target

node-exporter-01
UP

From discovery to time series

1
Configure Define scrape job
2
Discover Find targets
3
Label Build target labels
4
Endpoint Resolve /metrics
5
Scrape Collect samples
6
Store Write time series
7
Query PromQL / alerts
Step 1 — Configure: Prometheus reads the scrape job definition. This determines which discovery mechanism or static target list should be used and how the resulting targets will be scraped.

Target labels

Label Value Purpose
Example PromQL up{job="node"}
Engineering takeaway Service discovery separates where targets come from from how Prometheus scrapes them. Whether the target comes from a static file, Kubernetes, Consul, or a cloud API, the result is a set of scrape targets with labels that can become part of your monitoring model.
In real deployments, discovery metadata can also be transformed with relabeling before scraping. The exact discovery configuration depends on the Prometheus deployment and environment.

Understanding Prometheus’ Pull-Based System

Prometheus operates on a pull-based model, meaning it actively fetches metrics from the targets it monitors. Instead of waiting for the targets to push metrics to it, Prometheus takes the initiative and pulls the data at regular intervals. This approach offers several advantages over traditional push-based systems.

1. Flexibility and Reliability: One of the key benefits of the pull-based system is its flexibility. Prometheus can quickly adapt to dynamic environments and handle changes in the configuration of monitored targets. It can automatically discover new targets and adjust the scraping frequency based on the importance of metrics. This flexibility ensures that Prometheus can keep up with the ever-changing nature of modern infrastructure.

2. Efficiency and Scalability: The pull-based system also provides efficiency and scalability. By fetching metrics directly from the targets, Prometheus reduces the resource overhead on each target. This is particularly beneficial in scenarios where the number of targets is large, or the resources on the targets are limited. Additionally, Prometheus can distribute the scraping workload across multiple instances, enabling horizontal scalability and ensuring smooth operations even under heavy loads.

3. Data Integrity and Consistency: Another advantage of the pull-based system is its ability to ensure data integrity and consistency. Since Prometheus fetches metrics directly from the targets, potential data loss in a push-based system is eliminated. By actively pulling the data, Prometheus guarantees that the most up-to-date and accurate metrics are available for analysis and alerting.

4. Alerting and Monitoring: Prometheus’ pull-based system seamlessly integrates with its powerful alerting and monitoring capabilities. By regularly fetching metrics, Prometheus can evaluate them against predefined rules and trigger alerts when certain thresholds are exceeded. This proactive approach to monitoring ensures that any potential issues or anomalies are promptly detected, allowing for timely remedial actions.

Example: Prometheus is Google Cloud

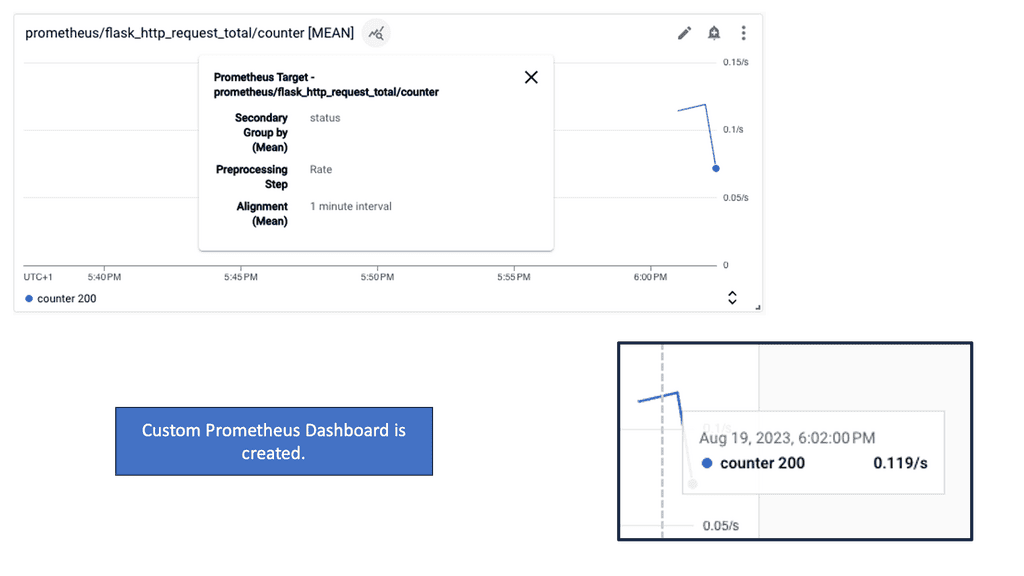
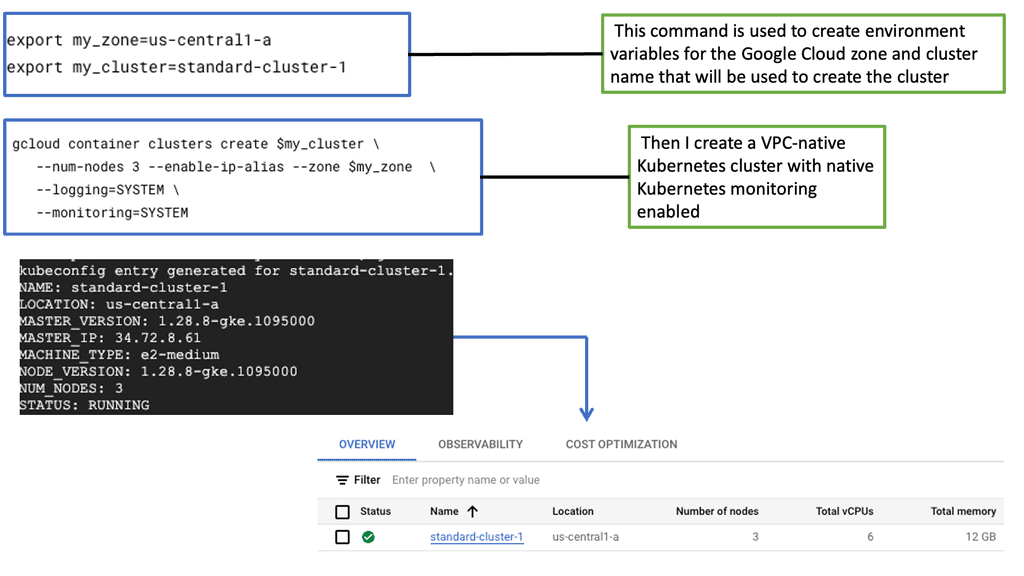
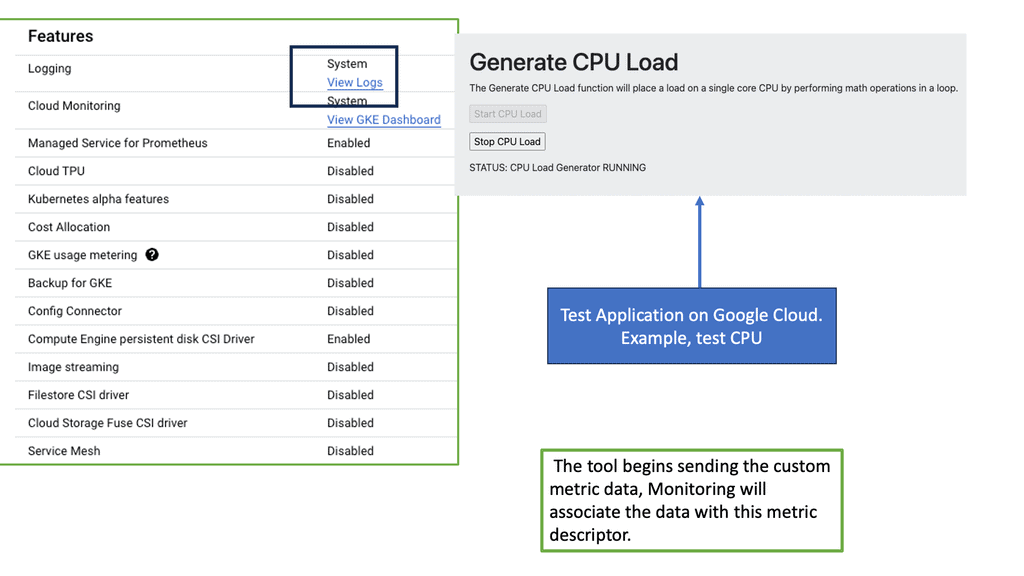
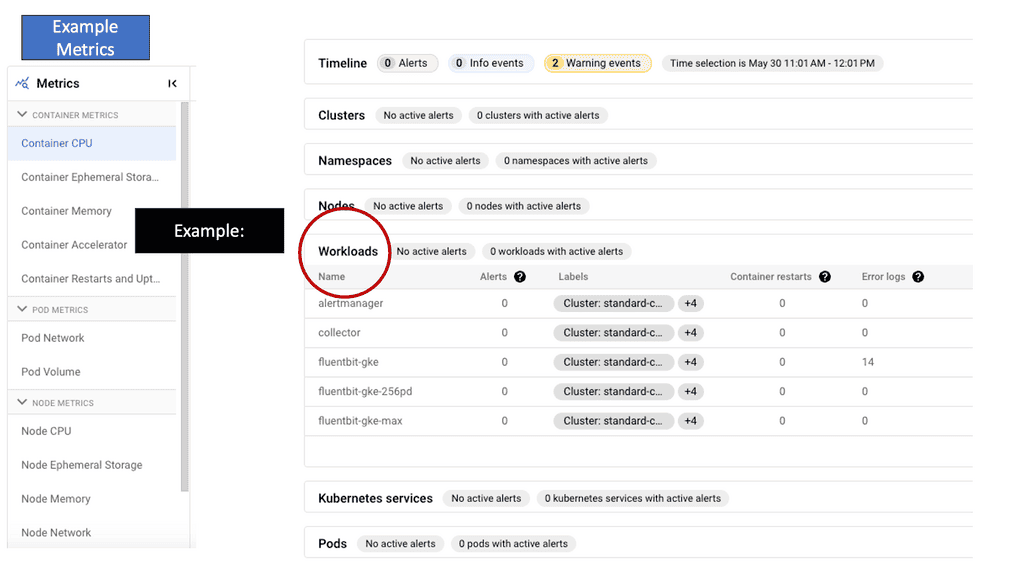
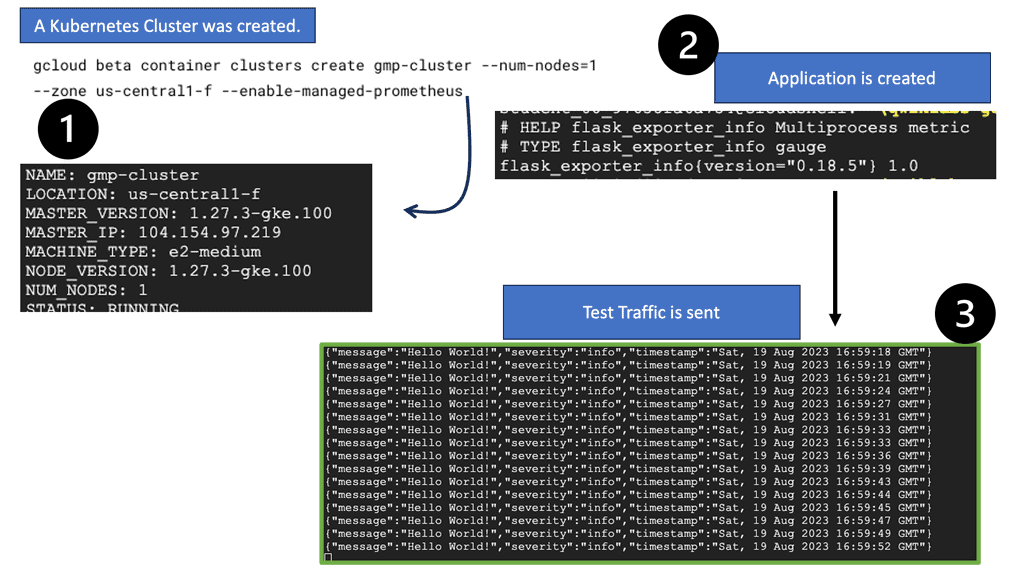
In the following example, I have set up a  Google Kubernetes Engine cluster ad and then deployed the Managed Service for Prometheus to ingest metrics from a simple application. Remember that the Managed Service for Prometheus is Google Cloud’s fully managed storage and query service for Prometheus metrics. This service is built on Monarch, the same globally scalable data store as Cloud Monitoring.

Note: A thin fork of Prometheus replaces existing Prometheus deployments and sends data to the managed service with no user intervention. This data can then be queried using PromQL through the Prometheus Query API supported by the managed service and the existing Cloud Monitoring query mechanisms.

In this last section, quickly use gcloud to deploy a custom monitoring dashboard that shows the metrics from this application in a line chart. Once created, navigate to Monitoring > Dashboards to see the newly created

Prometheus Network Monitoring

Prometheus network monitoring is an open-source, metrics-based system. It includes a robust data model and a query language that lets you analyze how your applications and infrastructure are performing. It does not try to solve problems outside the metrics space and works solely in metric-based monitoring.

However, it can be augmented with tools and a platform for additional observability. For Prometheus to work, you need to instrument your code.

Available Client libraries

Client libraries are available in all the popular languages and runtimes for instrumenting your code, including Go, Java/JVM, C#/.Net, Python, Ruby, Node.js, Haskell, Erlang, and Rust. In addition, software like Kubernetes and Docker are already instrumented with Prometheus client libraries. So you say these are out of the box, so are you ready for Prometheus to scrap their metrics?

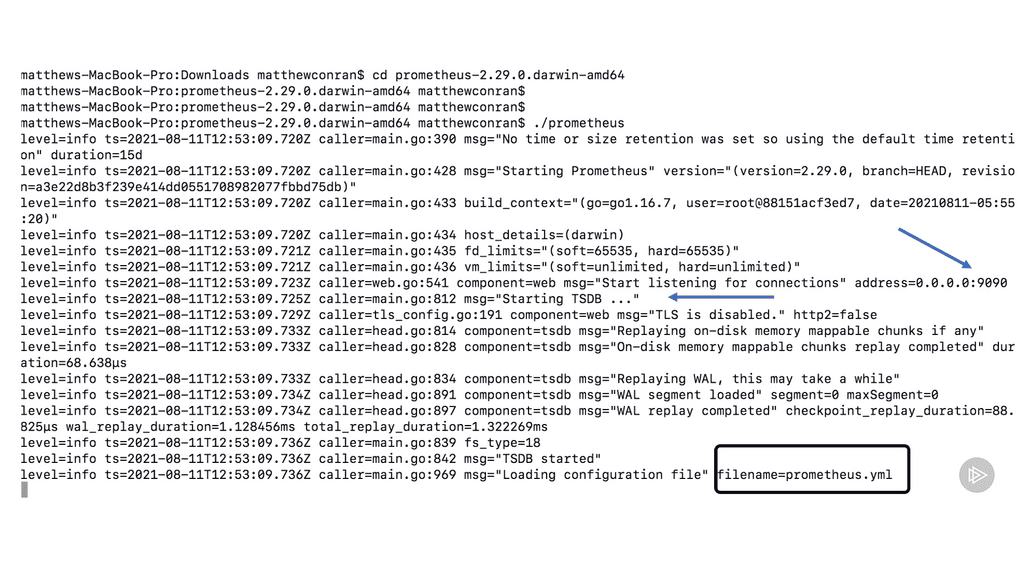
In the following diagram, you will see the Prometheus settings from a fresh install. I have downloaded Prometheus from the Prometheus website on my local machine. Prometheus, by default, listens on port 9090 and contains a highly optimized Time Series Database (TSDB), which you can see is started. Also displayed at the very end of the screenshot is the default name of the Prometheus configuration file.

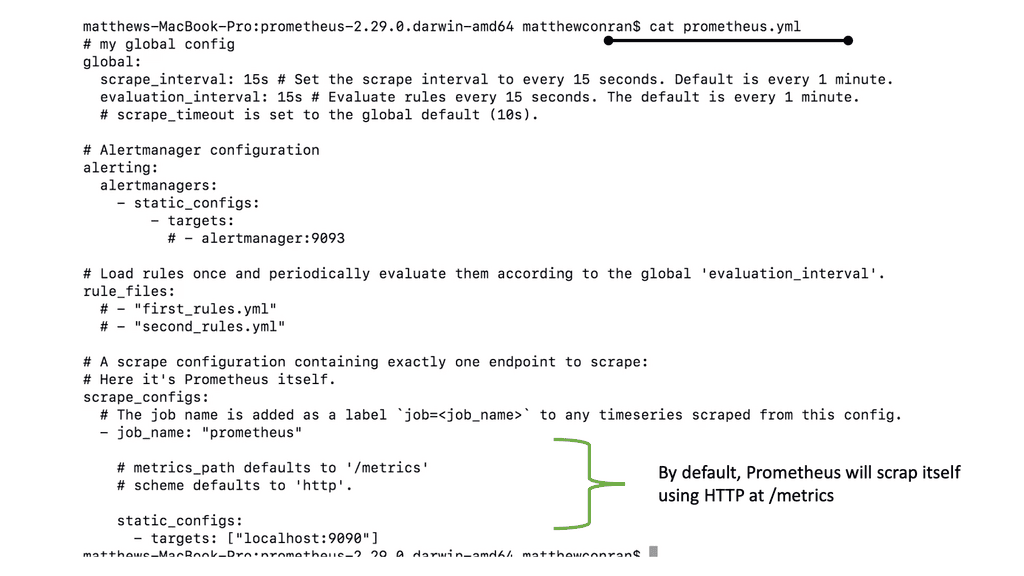
The Prometheus configuration file is written in YAML format and is defined by the scheme. I have done a CAT on the Prometheus configuration file to give you an idea of what it looks like. In the default configuration, a single job called Prometheus scrapes the time series data exposed by the Prometheus server. The job contains a single, statically configured target, the local host on port 9090. 

The Transition to Prometheus network monitoring

Around eight years ago, Ganglia introduced SaaS-based monitoring solutions. These now solved some problems with alerting built-in and API to get to the data. However, now there are two systems, and this introduces complexity. The collector and the agents are pushing to the SaaS-based system along with an on-premises design.

These systems may need to be managed by two different teams. There can be cloud teams looking after the cloud-based SaaS solution and on-premises network or security teams looking at the on-premises monitoring. So, there is already a communication gap, not to mention the creation of a considerably siloed environment in one technology set—monitoring.

Also, questions arise about where to put the metrics in the SaaS-based product or Ganga. For example, we could have different metrics in the same place or the same metrics in only one spot. How can you keep track and ensure consistency?

Ideally, if you have a dispersed PoP design and expect your infrastructure to grow and plan for the future, you don’t want to have centralized collectors. But unfortunately, most on-premise solutions still have a push-based centralized model. 

Prometheus Monitoring: Prometheus Pull

Then Prometheus Pull came around and offered a new approach to monitoring. It can handle millions of metrics on modest hardware. In general, rather than having external services push metrics to it, Prometheus uses a pull approach compared to a push approach.

Prometheus network monitoring is a server application written in GO. It is an open-source, decentralized monitoring tool that can be centralized using the federate option. Prometheus has a server component, which you run in each environment. You can also run a Prometheus container in each Kubernetes pod.

We use a time-series database for Prometheus monitoring, and every metric is recorded with a timestamp. Prometheus is not an SQL database; you need to use PromQL as its query language, which allows you to query the metrics. 

Prometheus Monitoring: Legacy System

So, let us expand on this and look at two environments for monitoring. We have a legacy environment and a modern Kubernetes environment. We are running a private cloud for the legacy with many SQL, Windows, and Linux servers. There is nothing new here. Here, you would run Prometheus on the same subnet. A Prometheus agent would also be installed. 

We would have Node Exporters for both Linux and Windows, extracting and creating a metric endpoint on your servers. The metric endpoint is needed on each server or host so Prometheus can scrap the metrics. So, a Daemon is running, collecting all of the metrics. These metrics are exposed on a page, for example, http://host:port/metrics, that allows Prometheus to scrape. 

There is also a Prometheus federation feature. You can have a federated endpoint, allowing Prometheus to expose its metrics to other services. This will enable you to pull metrics around different subnets. So, we can have another Prometheus in a different subnet, scrapping the other Prometheus. The federate option will enable you to link these two Prometheus solutions quickly. 

Prometheus Monitoring
Diagram: Prometheus Monitoring. Source is Opcito

Prometheus Monitoring: Modern Kubernetes

Here, we have a microservices observability platform and a bunch of containers or VMs running in a Kubernetes cluster. In this environment, we usually create a namespace; for example, we could call the namespace monitoring. So, we deploy a Prometheus pod in our environments.

The Prometheus pod YAML file will point to the Kubernetes API. The Kubernetes API has a metric server that gets all metrics from your environments. So here we are, getting metrics for the container processes. You can deploy the library in your code if you want to instrument your application.

This can be done with Prometheus code libraries. We now have a metrics endpoint similar to before, and we can grab metrics specific to your application. We also have a metrics endpoint on each container that Prometheus can scrape.

**What is Prometheus Exporter**

Prometheus exporter is a specialized component that extracts and exposes metrics from third-party systems, applications, and services. It bridges Prometheus, an open-source monitoring and alerting toolkit, and the target system or application.

By implementing the Prometheus exporter, users can conveniently collect and monitor custom metrics, enabling them to gain valuable insights into their systems’ health and performance.

How Does Prometheus Exporter Work?

Prometheus exporter follows a simple and efficient architecture. It utilizes a built-in HTTP server to expose metrics in a format that Prometheus understands. The exporter periodically collects metrics from the target system or application and makes them available over HTTP endpoints. Prometheus then scrapes these endpoints, discovers and stores the metrics, and performs analysis and alerting based on the defined rules.

Benefits of Prometheus Exporter:

1. Flexibility: The Prometheus exporter provides flexibility in monitoring various metrics, making it suitable for multiple systems and applications. With its support for custom metrics, users can easily monitor specific aspects and gain insights into their systems’ behavior.

2. Compatibility: Due to its popularity, many systems and applications offer native support for Prometheus exporters. This compatibility allows users to effortlessly integrate the exporter into their existing monitoring infrastructure, eliminating the need for complex configurations or additional tools.

3. Extensibility: Prometheus exporter encourages extensibility by offering a straightforward mechanism to develop and expose custom metrics. This capability enables users to monitor specific application-level metrics critical to their unique monitoring requirements.

4. Scalability: With Prometheus exporter, users can scale their monitoring infrastructure as their systems grow. The exporter’s lightweight design and efficient data collection mechanism ensure that monitoring remains reliable and efficient, even in high-throughput environments.

Exposing Runtime Metrics: The Prometheus Exporter

  • Exporter Types:

To enable Prometheus monitoring, you must add a metric API to the application containers to support this. For applications that don’t have their metric API, we use what is known as an Exporter. This utility reads the runtime metrics the app has already collected and exposes them on an HTTP endpoint.

Prometheus can then look at this HTTP endpoint. So we have different types of Exporters that collect metrics for other runtimes, such as a JAVA Exporter, which will give you a set of JVM statistics, and a .NET Exporter, which will provide you with a set of Windows performance metrics.

Essentially, we are adding a Prometheus endpoint to the application. In addition, we use an Exporter utility alongside the application. So, we will have two processes running in the container. 

With this approach, you don’t need to change the application. This could be useful for some regulatory environments where you can’t change the application code. So now you have application runtime metrics without changing any code.

This is the operating system and application host data already collected in the containers. To make these metrics available to Prometheus, add an Exporter to the Docker Image. Many use the Exporters for legacy applications instead of changing the code to support Prometheus monitoring.

Essentially, we are exporting the statistics to a metric endpoint.

Prometheus Monitoring • Block 3

Exporter & Kubernetes Monitoring Lab

Not every system can expose Prometheus metrics directly. Choose the environment and see when direct instrumentation, an exporter, or Kubernetes-aware discovery is the better monitoring pattern.

Application you control

You own the application code and can add Prometheus client-library instrumentation directly into the application.

Recommended collection pattern
Direct instrumentation
This gives the application a native metrics interface for application-specific measurements such as request rates, latency, queue depth, and business-level counters.
GET /metrics

Architecture

Application Instrumented code
→
Prometheus Scrapes metrics
→
PromQL Query / alert

Can you change the application?

Kubernetes monitoring pattern

Kubernetes introduces a dynamic environment where workloads can be created, removed, rescheduled, and scaled. Prometheus can use the Kubernetes API for service discovery and then scrape appropriate targets.

1
Kubernetes API Provides current cluster objects and metadata.
2
Discovery Prometheus identifies eligible targets.
3
Labels Namespace, pod, service and application context.
4
Scrape Prometheus requests metrics from the target.
5
Query PromQL powers dashboards and alerts.
In Kubernetes environments, the exact configuration depends on the Prometheus deployment. A plain Prometheus configuration can use Kubernetes service discovery; Prometheus Operator-based environments may additionally use resources such as ServiceMonitor or PodMonitor to define scrape intent.

Collection method cheat sheet

Environment Pattern Why
Application you own Client library Expose application-specific metrics directly from the code.
Linux host Node Exporter Expose operating-system and host-level metrics without modifying the OS.
Existing database Database exporter Translate database statistics into Prometheus-compatible metrics.
HTTP / network endpoint Blackbox Exporter Probe availability, latency, status codes, DNS, TLS and related behaviour.
Kubernetes workload Discovery + scrape Handle dynamically changing workloads and attach Kubernetes context.
Engineering takeaway Use direct instrumentation when you control the application and need application-specific metrics. Use an exporter when you need to expose metrics from an existing system that cannot reasonably be instrumented. In Kubernetes, combine dynamic discovery with the appropriate scrape pattern so monitoring follows the workload as it changes.
Exporters are not all the same: some expose host or application statistics, while probing exporters such as Blackbox Exporter actively test an external endpoint. The common pattern is that Prometheus still scrapes the exporter's metrics endpoint.
service level objectives

Starting Observability

Starting Observability

OpenShift networking provides the connectivity layer that allows containerised workloads to communicate with one another, access platform services, and expose applications outside the cluster. Because OpenShift runs distributed workloads across multiple worker nodes, networking must provide more than basic IP connectivity: it must support pod-to-pod communication, service discovery, ingress traffic, egress control, network isolation, and application-level traffic management.

The OpenShift networking model is built around several core objects. Pods receive network identities and communicate across the cluster, while Services provide stable virtual endpoints for groups of pods whose individual IP addresses may change as workloads are created, removed, or rescheduled. Routes provide an OpenShift-specific mechanism for exposing HTTP and HTTPS applications externally, connecting cluster services to clients outside the platform.

Modern OpenShift deployments commonly use OVN-Kubernetes as the cluster network provider. It uses Open Virtual Network technologies to provide software-defined networking across the cluster, supporting pod connectivity, logical switching and routing, network segmentation, and policy enforcement. This creates a programmable network fabric in which connectivity can be controlled independently of the underlying physical network.

NetworkPolicy provides an important security boundary within this architecture. Policies can control which workloads are permitted to communicate with one another and can restrict ingress and egress traffic according to namespaces, pods, labels, and other selectors. Correctly designed policies allow teams to move beyond simple network reachability and implement segmentation principles such as least privilege between application tiers.

External connectivity introduces another set of considerations. OpenShift provides mechanisms for exposing services through routes and ingress infrastructure, while cluster egress determines how workloads communicate with systems outside the cluster. Load balancing, DNS, TLS termination, firewall controls, and external network integration all contribute to the complete application connectivity model.

For more complex distributed applications, OpenShift can also integrate with service mesh technologies. A service mesh can provide application-aware traffic management, mutual TLS, service-to-service security, observability, retries, and controlled traffic routing without requiring every application to implement these capabilities independently.

OpenShift networking is therefore best understood as a layered architecture rather than simply a mechanism for assigning IP addresses. From pod connectivity and service discovery through software-defined networking, policy enforcement, ingress and egress, and service-to-service communication, each layer contributes to the reliability, security, and scalability of applications running on the platform. Understanding these layers makes it much easier to troubleshoot connectivity problems and design secure OpenShift environments.

Starting Observability • Block 1

Observability Signal Explorer

Logs, metrics and traces are not interchangeable. Select a signal and investigate what it can reveal about the same distributed-system incident.

Incident scenario
A checkout service suddenly becomes slow. Overall error rate is increasing, but only some requests appear affected. The application runs across multiple services and Kubernetes pods.

Metrics — establish the signal

Best question
What is changing?
Metrics provide a fast numerical view of system behaviour. They help establish whether latency, traffic, errors or resource consumption has changed.
http_request_duration_seconds
http_requests_total
http_requests_total{status="500"}
Start here: determine whether the checkout service is actually experiencing elevated latency or errors.

How the signals work together

Metrics Detect the abnormal behaviour.
Logs Inspect detailed events and context.
Traces Follow the request across services.
Observability becomes powerful when these signals are correlated. A metric can tell you that latency increased; logs can show an application error; a trace can identify which downstream service introduced the delay.
The goal is not to collect telemetry for its own sake. The goal is to reduce uncertainty about system behaviour.
Engineering takeaway Metrics are usually the fastest way to establish that something has changed. Logs and traces then provide the context required to explain what happened and where the problem occurred.
The three signals complement one another. A production observability strategy should avoid treating any single signal as the complete picture.

Highlights: Starting Observability

Understanding Observability

To comprehend the essence of observability, we must first grasp its fundamental components. Observability involves collecting, analyzing, and interpreting data from various sources within a system. This data provides insights into the system’s performance, health, and potential issues. By monitoring metrics, logs, traces, and other relevant data points, observability equips organizations with the ability to diagnose problems, optimize performance, and ensure reliability.

The benefits of observability extend far beyond the realm of technology. Organizations across industries are leveraging observability to enhance their operations and drive innovation. In software development, observability enables teams to identify and resolve bugs, bottlenecks, and vulnerabilities proactively.

Additionally, it facilitates efficient troubleshooting and aids in the optimization of critical systems. Moreover, observability is pivotal in enabling data-driven decision-making, empowering organizations to make informed choices based on real-time insights.

**Key Components of Observability: Logs, Metrics, and Traces**

To fully grasp observability, you must understand its key components:

1. **Logs**: Logs are records of events that occur within your system. They provide detailed information about what happened, where, and why. Effective log management allows you to search, filter, and analyze these events to detect anomalies and pinpoint issues.

2. **Metrics**: Metrics are numerical values that represent the performance and health of your system over time. They help you track resource utilization, response times, and other critical parameters. By visualizing these metrics, you can easily identify trends and potential bottlenecks.

3. **Traces**: Traces follow the path of requests as they flow through your system. They offer a high-level view of your application’s behavior, highlighting dependencies and latency issues. Tracing is invaluable for diagnosing complex problems in distributed systems.

Starting Observability — The Foundation of Understanding Modern Systems

Observability is the discipline of designing systems so that engineers can understand what is happening inside them purely from their external outputs. In modern distributed architectures — Kubernetes, microservices, service meshes, serverless, multi‑cloud — traditional monitoring is no longer enough. Observability provides the signals, context, and correlations required to debug unknown failures, optimize performance, and maintain reliability at scale.

What Observability Actually Means

Observability is not dashboards.

It is not alerts.

It is not logs, metrics, or traces individually.

Observability is the ability to ask any question about your system — without shipping new code.

A system is observable when engineers can:

  • understand internal state
  • diagnose failures
  • trace request paths
  • identify bottlenecks
  • detect anomalies
  • validate performance
  • correlate signals across components

Observability is about insight, not just data.

The Three Pillars — Metrics, Logs, and Traces

Observability is built on three core signal types:

1. Metrics — Numeric Health Indicators

Fast, lightweight, ideal for dashboards and alerts.

Examples: latency, error rate, CPU, memory, queue depth.

2. Logs — Detailed Event Records

Rich context for debugging.

Examples: errors, state changes, authentication events.

3. Traces — End‑to‑End Request Journeys

Critical for microservices.

Shows how a request flows across services, pods, and nodes.

Together, these signals allow engineers to reconstruct system behavior.

Why Observability Matters in Modern Architectures

Legacy monitoring assumed:

  • one application
  • one server
  • one log file
  • one failure domain

Modern systems are:

  • distributed
  • containerized
  • ephemeral
  • autoscaled
  • multi‑cloud
  • event‑driven

Failures propagate across dozens of services.

Observability ensures you can see the entire system, not just isolated components.

Observability vs Monitoring — A Critical Distinction

Monitoring answers known questions:

  • Is CPU too high
  • Is memory exhausted
  • Is error rate above threshold

Observability answers unknown questions:

  • Why did latency spike only for one customer
  • Why did pod restarts cascade across the cluster
  • Why did the service mesh route traffic incorrectly
  • Why did autoscaling trigger unexpectedly

Monitoring is reactive.

Observability is investigative.

Designing for Observability — Not Adding It Later

Observability must be designed into the system, not bolted on afterward.

Key design principles:

  • consistent logging structure
  • shared correlation IDs
  • instrumented code paths
  • distributed tracing headers
  • exported metrics for every critical component
  • telemetry pipelines that scale
  • context propagation across microservices

If telemetry is inconsistent, observability collapses.

Telemetry Pipelines — How Data Flows Through the System

A modern observability pipeline includes:

  • instrumentation (OpenTelemetry SDKs)
  • collection (agents, sidecars, node exporters)
  • transport (OTLP, gRPC, HTTP)
  • storage (Prometheus, Loki, Tempo, Elasticsearch)
  • visualization (Grafana, Kibana, Jaeger)
  • alerting (Alertmanager, PagerDuty)

Observability is not one tool — it is an ecosystem.

Observability and Security — Detecting the Invisible

Observability is also a security capability.

Telemetry reveals:

  • abnormal access patterns
  • lateral movement
  • privilege escalation
  • suspicious API calls
  • compromised workloads
  • unusual DNS behavior

Security without observability is blind.

Outcome — A System You Can Trust, Debug, and Improve

Starting observability means building systems that:

  • expose their internal state
  • provide actionable signals
  • correlate behavior across services
  • support rapid debugging
  • enable SLO‑driven reliability
  • scale with cloud‑native architectures

Observability is the foundation of resilient, reliable, modern engineering.

A New Paradigm Shift

Your infrastructure is undergoing a paradigm shift to support the new variations. As systems become more distributed and complex, methods for building and operating them are evolving, making network visibility into your services and infrastructure more critical than ever. This leads you to adopt new practices, such as Starting Observability and implementing service level objectives (SLO).

Note: The Internal States

Observability aims to provide a level of introspection to understand the internal state of the systems and applications. That state can be achieved in various ways. The most common way to fully understand this state is with a combination of logs, metrics, and traces as debugging signals—all of these need to be viewed as one, not as a single entity.

You have probably encountered the difference between monitoring and Observability. But how many articles have you read that guide starting an observability project?

**Getting Started with Observability Tools**

With a basic understanding of observability, it’s time to explore the tools that can help you implement it. Several observability platforms cater to different needs, including:

– **Prometheus**: Known for its powerful time-series database and flexible querying language, Prometheus is ideal for collecting and analyzing metrics.

– **ELK Stack (Elasticsearch, Logstash, Kibana)**: This open-source stack excels at log management, providing robust search and visualization capabilities.

– **Jaeger**: Designed for distributed tracing, Jaeger helps you trace requests and identify performance bottlenecks in microservices environments.

Choosing the right tools depends on your specific requirements, but starting with these popular options can set you on the right path.

Observability & Service Mesh

**The Role of Service Mesh in Observability**

Service mesh has emerged as a powerful tool in enhancing observability within distributed systems. At its core, a service mesh is a dedicated infrastructure layer that controls service-to-service communication. By handling aspects like load balancing, authentication, and encryption, service meshes provide a centralized way to manage network traffic. More importantly, they offer detailed telemetry, which is essential for observability. With a service mesh, you can collect metrics, traces, and logs in a standardized manner, making it easier to monitor the health and performance of your services.

**Key Benefits of Using a Service Mesh**

One of the primary advantages of implementing a service mesh is the increased visibility it provides. By abstracting the complexities of network communication, a service mesh allows teams to focus on building and deploying applications without worrying about underlying connectivity issues. Additionally, service meshes facilitate better security practices through features like mutual TLS, enabling encryption and authentication between services. This not only boosts observability but also enhances the overall security posture of your applications.

The Basics: How Cloud Service Mesh Works

At its core, a cloud service mesh is a dedicated infrastructure layer that handles service-to-service communication within a cloud environment. It provides a more secure, reliable, and observable way to manage these communications. Instead of embedding complex logic into each service to handle things like retries, timeouts, and security policies, a service mesh abstracts these concerns into a separate layer, often through sidecar proxies that accompany each service instance.

**Key Benefits: Why Adopt a Cloud Service Mesh?**

1. **Enhanced Security**: By centralizing security policies and automating mutual TLS (mTLS) for service-to-service encryption, a service mesh significantly reduces the risk of data breaches.

2. **Observability**: With built-in monitoring and tracing capabilities, a service mesh provides deep insights into the behavior and performance of services, making it easier to detect and resolve issues.

3. **Traffic Management**: Advanced traffic management features such as load balancing, fine-grained traffic routing, and fault injection help optimize the performance and reliability of services.

**Real-World Applications: Success Stories**

Many organizations have successfully implemented cloud service meshes to solve complex challenges. For instance, a large e-commerce platform might use a service mesh to manage its microservices architecture, ensuring that customer transactions are secure and resilient. Another example is a financial institution that leverages a service mesh to comply with stringent regulatory requirements by enforcing consistent security policies across all services.

**Choosing the Right Service Mesh: Key Considerations**

When selecting a cloud service mesh, it’s essential to consider factors such as compatibility with your existing infrastructure, ease of deployment, and community support. Popular options like Istio, Linkerd, and Consul each offer unique features and benefits. Evaluating these options based on your specific needs and constraints will help you make an informed decision.

Compute Engine Monitoring with Ops Agent

Understanding Ops Agent

Google Cloud developed Ops Agent, a lightweight and versatile monitoring agent. It seamlessly integrates with Compute Engine instances and provides real-time insights into system metrics, logs, and more. By installing Ops Agent, you gain granular visibility into your instances’ performance, allowing you to address any issues proactively.

To start with Ops Agent, you must install and configure it on your Compute Engine instances. This section will guide you through the steps, from enabling the necessary APIs to deploying Ops Agent on your instances. 

Ops Agent offers an extensive range of metrics and logs you can monitor to gain valuable insights into your infrastructure’s health and performance. This section will delve into the available metrics and logs, such as CPU utilization, disk I/O, network traffic, and application logs. 

Observability is critical for building, changing, and understanding the software that powers complex modern systems. Teams that adopt Observability are much better equipped to ship code swiftly and confidently, identify outliers and aberrant behaviors, and understand every user’s experience.

In that case, Observability for software systems measures how well you can understand and explain any state your system can get into, no matter how novel or bizarre.

Observability & Managed Instance Groups

**The Core of Google Cloud’s Scalability**

Managed Instance Groups are a fundamental feature of Google Cloud, designed to automate the deployment and management of virtual machine instances. By leveraging MIGs, developers can automatically scale their applications based on current demand, ensuring optimal performance without manual intervention. This automation is achieved through policy-based scaling, which adjusts the number of instances in real-time.

—

**Enhanced Observability with Managed Instance Groups**

Observability is crucial for maintaining the health and performance of cloud-based applications. With Managed Instance Groups, Google Cloud provides robust monitoring and logging tools that offer deep insights into application performance. These tools enable developers to track metrics, set up alerts, and gain a comprehensive view of their infrastructure’s behavior. By integrating observability with MIGs, Google Cloud ensures that any issues can be swiftly identified and resolved, minimizing downtime and enhancing reliability.

—

**Advantages of Using Managed Instance Groups**

Managed Instance Groups offer several advantages that make them indispensable for modern cloud computing. First and foremost, they provide automatic scaling, which optimizes resource usage and reduces costs. Additionally, MIGs ensure high availability by distributing instances across multiple zones, thereby enhancing fault tolerance. Moreover, they support rolling updates, enabling developers to deploy new features or fixes with minimal disruption.

Managed Instance Group


SLO, SLI & Error Budget Lab

Turn an observable service signal into a reliability target. Choose the user-facing indicator, define the SLO, then see how much unreliability the service can tolerate before reliability work should take priority.

1. Define the reliability objective

Select the SLI
SLO target
Measurement window
SLI = actual measured service behaviour
SLO = target for the SLI over a defined window
Error budget = 100% − SLO

2. Simulate service performance

Assume the checkout service is being measured against the selected SLO. Change the observed performance to see the reliability decision.
Observed performance
Selected SLI Availability
SLO 99.9%
Error Budget 43.2m
Reliability is within target. There is room for normal delivery and experimentation.
Engineering takeaway: An SLI measures what users experience. An SLO defines the reliability target for that measurement. The error budget converts the target into an explicit amount of tolerated unreliability, giving engineering teams a measurable basis for balancing feature delivery against reliability work.

Starting Observability

The Three Pillars of Observability

Three Pillars of Observability: Observability rests upon three main pillars: logs, metrics, and traces. Logs capture textual records of system events, providing valuable context and aiding post-incident analysis. Conversely, metrics are quantitative measurements of system behavior, allowing us to track performance and identify anomalies. Traces give a detailed view of request flows and interactions between system components, facilitating troubleshooting and understanding system dependencies.

The Power of Proactive Maintenance: One critical advantage of observability is its ability to enable proactive maintenance. We can continuously monitor and analyze system data to identify potential issues or anomalies before they escalate into critical problems. This proactive approach empowers us to take preventive measures, reducing downtime and improving system reliability.

Unleashing the Potential of Data Analysis: Observability generates a wealth of data that can be harnessed to drive informed decision-making. We can uncover patterns, identify performance bottlenecks, and optimize system behavior by leveraging data analysis techniques. This data-driven approach empowers us to make data-backed decisions that enhance system performance, scalability, and user experience.

The Starting Strategy

Start your observability project in the middle, not in the fridge, and start with something meaningful. There is no point in starting an observability project on something no one cares about or uses that much. So, choose something that matters, and the result will be noticed. On the other hand, something no one cares about will not attract any stakeholder interest.

Service level objectives (SLO)

So, to start an observability project on something that matters and will attract interest, you need to look at metrics that matter: Service Level Objectives (SLOs). With service level objectives, we attach the needs of the product and business to the needs of the individual components, finding the perfect balance for starting observability projects.

The service level objective aggregates over time and is a mathematical equivalent of an error budget. So, over this period, am I breaching my target? If you exceed your SLO target, your users will be happy with the state of your service.

If you are missing your SLO target, your users are unhappy with the state of your service. It’s as simple as that. So, the SLO is the target’s goal over a measurement period. The SLO includes two things: it contains the target and a measurement window. For example, 99.9% of checkout requests in the past 30 days have been successful. Thirty days is the measurement window.  

Example: Understanding GKE-Native Monitoring

GKE-Native Monitoring provides real-time insights into your GKE clusters, allowing you to monitor the health and performance of your applications. You can easily track resource utilization, latency, error rates, and more with built-in metrics and dashboards. This proactive monitoring enables you to identify bottlenecks, troubleshoot issues, and optimize your cluster’s performance.

GKE-Native Logging simplifies the collection, storage, and analysis of logs generated by your applications running on GKE. By consolidating logs from multiple sources, such as containers, system components, and services, GKE-Native Logging provides a unified view of your application’s behavior. This centralized log management enhances troubleshooting capabilities and lets you gain valuable insights into your application’s performance and security.

**Key Point: Take advantage of Error Budgets**

Once you have determined your service level objectives, it would help to look at your error budgets. Nothing can always be reliable, and it’s ok to fail. This is the only way to perform tests and innovate to meet better user requirements, which is why we have an error budget. An error budget references a budget of failure that you are allowed to have per hour or month.

We need a way to measure the amount of unreliability we will tolerate. Once you know how much of the error budget you have left, you can take more risks and roll out new features. Error budgets help you balance velocity and reliability. So, the practices of SLO and error budgets prioritize reliability and velocity.

**Key Point: Issues with MTTR**

SLO is an excellent way to start and win. This can be approached on a team-by-team basis. It’s a much more accurate way to measure reliability than Mean Time to Recovery (MTTR). The issue with MTTR is that you measure the time it takes to resolve every incident. However, this measurement method can be subject to measurement error. The SLO is more challenging to cheat and a better way to measure.

So, we have key performance indicators ( KPI), service level indicators (SLI), and service level objectives (SLO). These are the first ways to implement Observability, not just look at the KPI. First, you should monitor KPI, SLx, and the system’s internal state. From there, you can derive your service level metrics, which will be the best place to start an observability project.

What is a KPI and SLI: User experience

The key performance indicator (KPI) is tied to system implementation. It conveys health and performance and may change if the system’s architecture changes. For example, database latency would be a KPI. In contrast to KPI, we have service level indicators (SLI). An SLI measures your user experience and can be derived from several signals.

The SLI does not change unless the user needs to. It’s a metric that matters most to the user. This indicator tells you if your service is acceptable or not. So, this line tells you if you have a happy or sad user. It’s a performance measurement, like a metric that describes a user’s experience. 

Types of Service Level Indicators

An example of an SLI would be availability, latency, correctness, quality, freshness, and throughout. We need to gather these metrics, which can be done by implementing several measurement strategies, such as application-level metrics, log processing, and client-side instrumentation. So, if we look at an SLI implementation for availability, it would be, for example, the portion of HTTP GET request for /type of request.

The users care about SLI and not KPI. I’m not saying that database latency is not essential. You should measure it and put it in a predefined dashboard. However, users don’t care about database latency or how quickly their requests can be restored. Instead, the role of the SLI is to capture the user’s expectation of how the system behaves. If your database is too slow, you must front it with a cache. So, the cache hit ratio becomes a KPI, but the user’s expectations have not changed. 

Starting Observability Engineering

Good Quality Telemetry

You need to understand the importance of high-quality telemetry and adopt it carefully, as it is the first step to good Observation. So, it would be best to have quality logs and metrics and a modern approach such as Observation, which is required for long-term success. For this, you need good Telemetry; without good telemetry, it will be hard to shorten the length of outages. 

What are VPC Flow Logs?

VPC Flow Logs provide detailed information about the IP traffic flowing into and out of Virtual Private Clouds (VPCs) within Google Cloud. These logs capture data at the network interface level, including source and destination IP addresses, ports, protocols, and timestamps. By enabling VPC Flow Logs, network administrators gain a comprehensive view of network traffic, facilitating analysis and troubleshooting.

Analyzing VPC Flow Logs can yield valuable insights for various use cases. Firstly, it enables network administrators to monitor and detect anomalies in network traffic. By studying patterns and identifying unexpected or suspicious behavior, potential security threats can be identified and mitigated promptly. Additionally, VPC Flow Logs provide performance optimization opportunities by identifying bottlenecks, analyzing traffic patterns, and optimizing resource allocation.

Instrumentation: OpenTelemetry 

The first step to consider is how your applications will omit telemetry data. OpenTelemetry is the emerging standard for instrumenting frameworks and application code. With OpenTelemetry’s pluggable exporters, you can configure your instrumentation to send data to the analytics tool of your choice.

In addition, OpenTelementry helps with distributed tracing, which enables you to understand system interdependencies. Unless their relationships are clearly understood, those interdependencies can obscure problems and make them challenging to debug.

Understanding Application Latency

Application latency refers to the time it takes for a request to travel from the user to the server and back. Various factors influence it, including network latency, database queries, and processing time. By understanding and measuring application latency, developers can identify areas that require optimization and improve overall performance.

Example: Google Cloud Trace

Google Cloud Trace is a powerful tracing tool provided by Google Cloud Platform. It enables developers to analyze application latency by capturing and visualizing detailed traces of requests as they flow through various components of their applications. With Cloud Trace, developers gain insights into their applications’ performance, enabling them to identify and resolve latency issues efficiently.

**Data storage and analytics**

Once you have high-quality telemetry data, you must consider how it’s stored and analyzed. Depending on whether you use open-source or proprietary solutions, data storage, and analytics are often bundled into the same solution.  Commercial vendors typically bundle storage and analytics. These solutions will be proprietary all-in-one solutions, including Honeycomb, Lightstep, New Relic, Splunk, Datadog, etc.

Then, we have the open-source solutions that typically require separate data storage and analytics approaches. These open-source frontends include solutions like Grafana, Prometheus, or Jaeger. While they handle analytics, they all need an independent data store to scale. Popular open-source data storage layers include Cassandra, Elastic, M3, and InfluxDB.

**A final note: Buy instead of building?**

The most significant pain point is knowing how to start. Building your observability tooling rather than buying a commercially available solution quickly proves a return on investment (ROI). However, if you don’t have enough time, you will need to buy it. I prefer buying to get a quick recovery and stakeholder attention. While at the side, you could start to build with open-source components.

Essentially, you are running two projects in parallel. You buy to get immediate benefits and gain stakeholder attraction, and then, on the side, you can start to build your own., which may be more flexible for you in the long term.

Observability Architecture Builder

Build a telemetry path from application instrumentation to operational action. Select the environment and signals, then see which components fit each stage of the observability pipeline.

1. Choose the environment

Architecture
Telemetry signals

2. Design principle

Recommended approach
Instrument applications consistently, centralise telemetry processing where useful, and preserve enough context to correlate metrics, logs and traces during investigation.
1. Instrument Application and platform emit telemetry.
2. Collect Agents, SDKs or collectors receive signals.
3. Transport Telemetry moves through protocols such as OTLP.
4. Store Signals are retained for querying and analysis.
5. Visualize Dashboards and investigation tools expose patterns.
6. Alert Important conditions trigger operational action.
Engineering takeaway: Observability is not a single monitoring product. It is a telemetry architecture. The important design decisions are what you instrument, how signals are collected and correlated, where they are stored, and how engineers turn those signals into investigation and action.
System Observability

Distributed Systems Observability

Distributed Systems Observability

In the realm of modern technology, distributed systems have become the backbone of numerous applications and services. However, the increasing complexity of such systems poses significant challenges when it comes to monitoring and understanding their behavior. This is where observability steps in, offering a comprehensive solution to gain insights into the intricate workings of distributed systems. In this blog post, we will embark on a captivating journey into the realm of distributed systems observability, exploring its key concepts, tools, and benefits.

Observability, as a concept, enables us to gain deep insights into the internal state of a system based on its external outputs. When it comes to distributed systems, observability takes on a whole new level of complexity. It encompasses the ability to effectively monitor, debug, and analyze the behavior of interconnected components across a distributed architecture. By employing various techniques and tools, observability allows us to gain a holistic understanding of the system's performance, bottlenecks, and potential issues.

To achieve observability in distributed systems, it is crucial to focus on three interconnected components: logs, metrics, and traces.

Logs: Logs provide a chronological record of events and activities within the system, offering valuable insights into what has occurred. By analyzing logs, engineers can identify anomalies, track down errors, and troubleshoot issues effectively.

Metrics: Metrics, on the other hand, provide quantitative measurements of the system's performance and behavior. They offer a rich source of data that can be analyzed to gain a deeper understanding of resource utilization, response times, and overall system health.

Traces: Traces enable the visualization and analysis of transactions as they traverse through the distributed system. By capturing the flow of requests and their associated metadata, traces allow engineers to identify bottlenecks, latency issues, and performance optimizations.

In the ever-evolving landscape of distributed systems observability, a plethora of tools and frameworks have emerged to simplify the process. Prominent examples include:

1. Prometheus: A powerful open-source monitoring and alerting system that excels in collecting and storing metrics from distributed environments.

2. Jaeger: An end-to-end distributed tracing system that enables the visualization and analysis of transaction flows across complex systems.

3. ELK Stack: A comprehensive combination of Elasticsearch, Logstash, and Kibana, which collectively offer powerful log management, analysis, and visualization capabilities.

4. Grafana: A widely-used open-source platform for creating rich and interactive dashboards, allowing engineers to visualize metrics and logs in real-time.

The adoption of observability in distributed systems brings forth a multitude of benefits. It empowers engineers and DevOps teams to proactively detect and diagnose issues, leading to faster troubleshooting and reduced downtime. Observability also aids in capacity planning, resource optimization, and identifying performance bottlenecks. Moreover, it facilitates collaboration between teams by providing a shared understanding of the system's behavior and enabling effective communication.

In the ever-evolving landscape of distributed systems, observability plays a pivotal role in unraveling the complexity and gaining insights into system behavior. By leveraging the power of logs, metrics, and traces, along with robust tools and frameworks, engineers can navigate the intricate world of distributed systems with confidence. Embracing observability empowers organizations to build resilient, high-performing systems that can withstand the challenges of today's digital landscape.

Highlights: Distributed Systems Observability

Interactive Distributed Systems Lab 01

Distributed Failure Investigation Lab

A request is slow, but the frontend and API appear healthy. Investigate the dependency chain and determine where the partial failure actually originates.

SCENARIO

Checkout requests have become noticeably slower. Users report timeouts, while the frontend and API dashboards still look relatively normal. Your task is to correlate the service path and identify the most likely root cause.

Request dependency path — tap a service to inspect it

Evidence

Select telemetry evidence before choosing your diagnosis.

Investigation Console

Inspect the evidence, then select the most likely root cause.
Awaiting inspection
Signal Select evidence
Observation —
Implication —
What is the most likely root cause?
Evidence inspected: 0 / 4
Engineering takeaway: In a distributed system, the component showing the user-visible symptom is not necessarily the component causing the failure. Correlate latency, dependency health and network evidence across service boundaries to distinguish a local problem from a downstream partial failure.

The Role of Distributed Systems

A – Several decades ago, only a handful of mission-critical services worldwide were required to meet the availability and reliability requirements of today’s always-on applications and APIs. In response to user demand, every application must be built to scale nearly instantly to accommodate the potential for rapid, viral growth. Almost every app built today—whether a mobile app for consumers or a backend payment system—must meet these constraints and requirements.

B – Inherently, distributed systems are more reliable due to their distributed nature. When appropriately designed software engineers build these systems, they can benefit from more scalable organizational models. There is, however, a price to pay for these advantages.

C – Designing, building, and debugging these distributed systems can be challenging. A reliable distributed system requires significantly more engineering skills than a single-machine application, such as a mobile app or a web frontend. Regardless, distributed systems are becoming increasingly important. There is a corresponding need for tools, patterns, and practices to build them.

D – As digital transformation accelerates, organizations adopt multicloud environments to drive secure innovation and achieve speed, scale, and agility. As a result, technology stacks are becoming increasingly complex and scalable. Today, even the most straightforward digital transaction is supported by an array of cloud-native services and platforms delivered by various providers. To improve user experience and resilience, IT and security teams must monitor and manage their applications.

**Key Components of Observability**

Observability in distributed systems typically relies on three pillars: logs, metrics, and traces. Logs provide detailed records of events within the system, offering context for debugging issues. Metrics offer quantitative data, such as CPU usage and request rates, allowing teams to monitor system health and performance over time. Traces enable the tracking of requests as they move through the system, helping to pinpoint where latency or failures occur. Together, these components create a comprehensive picture of the system’s state and behavior.

**Challenges in Achieving Observability**

While observability is essential, achieving it in distributed systems is not without its challenges. The sheer volume of data generated by these systems can be overwhelming. Additionally, correlating data from disparate sources to form a cohesive narrative requires sophisticated tools and techniques. Moreover, ensuring that observability doesn’t introduce too much overhead or affect system performance is a delicate balancing act. Organizations must invest in the right infrastructure and expertise to tackle these challenges effectively.

**Best Practices for Enhancing Observability**

To maximize observability in distributed systems, organizations should adopt several best practices. Firstly, they should implement centralized logging and monitoring solutions that can aggregate data from all system components. Secondly, leveraging open standards like OpenTelemetry can facilitate consistent data collection and integration with various tools. Thirdly, incorporating automated alerting and anomaly detection can help teams proactively address issues before they impact users. Lastly, fostering a culture of collaboration between development and operations teams can ensure that observability is an ongoing, shared responsibility.

Distributed Systems Observability

Distributed systems observability is the discipline of understanding exactly what is happening inside large, multi‑component, multi‑region, microservice‑based architectures — without adding new code or dashboards every time something breaks. It is the evolution of monitoring, designed for systems where failures propagate across services, queues, caches, databases, networks, and cloud edges.

Below is a structured, high‑clarity section you can drop directly into your SRE, cloud, or microservices content.

Core Goal

Distributed systems observability allows engineers to reconstruct system behavior across dozens or hundreds of components using correlated telemetry:

  • Metrics

  • Logs

  • Traces

  • Events

  • Topology

It answers why something happened, not just what happened.

Key Challenges in Distributed Systems

Distributed systems introduce complexity that monitoring alone cannot handle:

  • partial failures

  • network partitions

  • retry storms

  • queue backpressure

  • cascading latency

  • multi‑region inconsistencies

  • service‑to‑service dependency chains

  • ephemeral workloads (Kubernetes)

Observability provides the visibility needed to debug these behaviors.

Core Components of Distributed Systems Observability

1. Metrics — High‑Level Health

Metrics show system symptoms across services:

  • latency (p95/p99)

  • error rate

  • throughput

  • queue depth

  • resource saturation

They reveal where a problem is occurring.

2. Logs — Detailed Forensics

Logs show:

  • state changes

  • errors

  • retries

  • timeouts

  • authentication failures

They reveal what happened inside each component.

3. Traces — End‑to‑End Request Flow

Traces show:

  • how a request moves across microservices

  • where bottlenecks occur

  • which dependency caused the slowdown

  • how long each span took

Traces reveal why the system behaved the way it did.

4. Topology Awareness

Distributed systems need dynamic topology visibility:

  • service maps

  • dependency graphs

  • network paths

  • cloud region routing

This reveals how everything is connected.

Distributed Systems Observability in Modern Architectures

Microservices

Observability correlates:

  • service latency

  • database bottlenecks

  • cache misses

  • downstream failures

  • retry loops

Kubernetes

Observability tracks:

  • pod lifecycle

  • node pressure

  • HPA/VPA scaling

  • container restarts

  • network overlay behavior

Cloud & Serverless

Observability reveals:

  • cold starts

  • throttling

  • multi‑region latency

  • API gateway behavior

  • IAM permission failures

Event‑Driven Systems

Observability shows:

  • queue depth

  • consumer lag

  • backpressure

  • dead‑letter queues

  • event replay patterns

Why Distributed Systems Need Observability

Distributed systems fail in non‑linear ways. Observability enables:

  • root‑cause analysis across multiple services

  • correlation of identity + network + application behavior

  • detection of cascading failures

  • SLO‑driven reliability

  • intelligent auto‑scaling

  • faster incident response

  • reduced MTTR

  • prevention of blind spots

Monitoring alone cannot do this.

📡 Tools for Distributed Systems Observability

  • OpenTelemetry — unified metrics, logs, traces.

  • Prometheus — metrics collection.

  • Grafana — dashboards and alerting.

  • Jaeger — distributed tracing.

  • Zipkin — tracing for microservices.

  • Splunk — analytics + correlation.

  • ThousandEyes — network + cloud path visibility.

  • Elastic — logs + metrics + traces.

Together, these form a complete observability pipeline.

Outcome

Distributed systems observability delivers:

  • complete insight across microservices

  • faster debugging of unknown failures

  • reliable auto‑scaling

  • strong SLO enforcement

  • reduced downtime

  • improved user experience

  • unified visibility across cloud, network, and application layers

It transforms distributed systems from opaque black boxes into fully observable, measurable, and debuggable architectures.

Cloud Service Mesh

### What is a Cloud Service Mesh?

A Cloud Service Mesh is a dedicated infrastructure layer that facilitates service-to-service communication in a microservices architecture. It abstracts the complex communication patterns between services into a manageable, secure, and observable framework. By deploying a service mesh, organizations can effectively manage the interactions of their microservices, ensuring seamless connectivity, security, and resilience.

### Key Benefits of Implementing a Cloud Service Mesh

1. **Enhanced Security**: A service mesh provides robust security features such as mutual TLS authentication, which encrypts communications between services. This ensures that data remains secure and tamper-proof as it travels across the network.

2. **Traffic Management**: With a service mesh, you can implement sophisticated traffic management policies, including load balancing, circuit breaking, and retries. This leads to improved performance and reliability of your distributed systems.

3. **Observability**: One of the standout features of a service mesh is its ability to provide deep observability into the interactions between services. Metrics, logs, and traces are collected and analyzed, offering invaluable insights into system health and performance.

### Enhancing Observability in Distributed Systems

Observability is a key concern in managing distributed systems. With the proliferation of microservices, tracking and understanding service interactions can become overwhelmingly complex. A Cloud Service Mesh addresses this challenge by offering comprehensive observability features:

– **Metrics Collection**: Collects real-time metrics on service performance, latency, error rates, and more.

– **Distributed Tracing**: Enables tracing of requests as they propagate through multiple services, helping identify bottlenecks and performance issues.

– **Centralized Logging**: Aggregates logs from various services, providing a unified view for easier troubleshooting and analysis.

These capabilities empower teams to detect issues early, optimize performance, and ensure the reliability of their applications.

### Real-World Applications and Use Cases

Several organizations have successfully implemented Cloud Service Meshes to transform their operations. For instance, financial institutions use service meshes to secure sensitive transactions, while e-commerce platforms leverage them to manage high traffic volumes during peak shopping seasons. By providing a robust framework for service communication, a service mesh enhances scalability, reliability, and security across industries.

Googles Ops Agent

Ops Agent is a lightweight agent that runs on your Compute Engine instances, collecting and forwarding metrics and logs to Google Cloud Monitoring and Logging. By installing Ops Agent on your instances, you gain real-time visibility into your Compute Engine’s performance and behavior.

To start monitoring your Compute Engine, you must install Ops Agent on your instances. The installation process is straightforward and can be done manually or through automation tools like Cloud Deployment Manager or Terraform. Once installed, the Ops Agent will automatically begin collecting metrics and logs from your Compute Engine.

Ops Agent allows you to customize the metrics and logs you want to monitor for your Compute Engine. Various options are available, allowing you to choose specific metrics and logs relevant to your application or system. By configuring metrics and logs, you can gain deeper insights and track the performance of critical components.

**Challenge: Fragmented Monitoring Tools**

Fragmented monitoring tools and manual analytics strategies challenge IT and security teams. The lack of a single source of truth and real-time insight makes it increasingly difficult for these teams to access the answers they need to accelerate innovation and optimize digital services. To gain insight, they must manually query data from various monitoring tools and piece together different sources of information.

This complex and time-consuming process distracts Team members from driving innovation and creating new value for the business and customers. In addition, many teams monitor only their mission-critical applications due to the effort involved in managing all these tools, platforms, and dashboards. The result is a multitude of blind spots across the technology stack, which makes it harder for teams to gain insights.

**Challenge: Kubernetes is Complex**

Understanding how Kubernetes adds to the complexity of technology stacks is imperative. In the drive toward modern technology stacks, it is the platform of choice for organizations refactoring their applications for the cloud-native world. Through dynamic resource provisioning, Kubernetes architectures can quickly scale services to new users and increase efficiency.

However, the constant changes in cloud environments make it difficult for IT and security teams to maintain visibility into them. To provide observability in their Kubernetes environments, these teams cannot manually configure various traditional monitoring tools. The result is that they are often unable to gain real-time insights to improve user experience, optimize costs, and strengthen security. Due to this visibility challenge, many organizations are delaying moving more mission-critical services to Kubernetes.

GKE-Native Monitoring

The Basics of GKE-Native Monitoring

GKE-Native Monitoring is a comprehensive monitoring solution provided by Google Cloud Platform (GCP) designed explicitly for GKE clusters. It offers deep insights into your applications’ performance and behavior, allowing you to proactively detect and resolve issues. With GKE-Native Monitoring, you can easily collect and analyze metrics, monitor logs, and set up alerts to ensure the reliability and availability of your applications.

One of the critical features of GKE-Native Monitoring is its ability to collect and analyze metrics from your GKE clusters. It provides preconfigured dashboards that display essential metrics such as CPU usage, memory utilization, and network traffic. Additionally, you can create custom dashboards tailored to your specific requirements, allowing you better to understand your application’s performance and resource consumption.

The Role of Megatrends

We have had a considerable drive with innovation that has spawned several megatrends that have affected how we manage and view our network infrastructure and the need for distributed systems observability. We have seen the decomposition of everything from one to many.

Many services and dependencies in multiple locations, aka microservices observability, must be managed and operated instead of the monolithic where everything is generally housed internally. The megatrends have resulted in a dynamic infrastructure with new failure modes not seen in the monolithic, forcing us to look at different systems observability tools and network visibility practices. 

Shift in Control

There has also been a shift in the point of control. As we move towards new technologies, many of these loosely coupled services or infrastructures your services depend on are not under your control. The edge of control has been pushed, creating different network and security perimeters. These parameters are now closer to the workload than a central security stack. Therefore, the workloads themselves are concerned with security.

Example Product: Cisco AppDynamics

### What is Cisco AppDynamics?

Cisco AppDynamics is an application performance management (APM) solution designed to provide real-time visibility into the performance of your applications. It helps IT professionals identify bottlenecks, diagnose issues, and optimize performance, ensuring a seamless user experience. With its powerful analytics, you can gain deep insights into your application stack, from the user interface to the backend infrastructure.

### Key Features and Capabilities

#### Real-Time Monitoring

One of the standout features of Cisco AppDynamics is its ability to monitor applications in real-time. This allows IT teams to detect and resolve issues as they occur, minimizing downtime and ensuring a smooth user experience. Real-time monitoring covers everything from user interactions to server performance, providing a comprehensive view of your application’s health.

#### End-User Experience Monitoring

Understanding how users interact with your application is crucial for delivering a high-quality experience. Cisco AppDynamics offers end-user experience monitoring, which tracks user sessions and interactions. This data helps you identify any pain points or performance issues that may be affecting user satisfaction.

#### Business Transaction Monitoring

Cisco AppDynamics takes a unique approach to monitoring by focusing on business transactions. By tracking the performance of individual transactions, you can gain a clearer understanding of how different parts of your application are performing. This level of granularity allows for more targeted optimizations and quicker issue resolution.

### Benefits of Using Cisco AppDynamics

#### Improved Application Performance

With its comprehensive monitoring and diagnostic capabilities, Cisco AppDynamics helps you identify and resolve performance issues quickly. This leads to faster load times, fewer errors, and an overall improved user experience.

#### Enhanced Operational Efficiency

By automating many of the monitoring and diagnostic processes, Cisco AppDynamics reduces the workload on your IT team. This allows them to focus on more strategic initiatives, driving greater value for your business.

#### Better Decision Making

The insights provided by Cisco AppDynamics enable better decision-making at all levels of your organization. Whether you’re looking to optimize resource allocation or plan for future growth, the data and analytics provided can inform your strategies and drive better outcomes.

### Integrations and Flexibility

Cisco AppDynamics offers seamless integrations with a wide range of third-party tools and platforms. Whether you’re using cloud services like AWS and Azure or CI/CD tools like Jenkins and GitHub, AppDynamics can integrate into your existing workflows, providing a unified view of your application’s performance.


Interactive Distributed Systems Lab 02

Distributed Trace Explorer

Follow one request across multiple services. Inspect individual spans, identify retries and downstream latency, and determine which component contributes most to the user-visible delay.

TRACE SCENARIO

Request checkout-7f31 takes approximately 1.82 seconds. The trace contains several downstream operations. Tap individual spans to inspect what happened inside the request.

Distributed trace — tap a span to inspect
1.82 s
1.49 s
430 ms
165 ms
1.12 s
Total trace duration
1.82 s
Database span
1.12 s
Retry detected
Yes

Span Inspector

Select a span to understand its role in the request.
No span selected
Service —
Duration —
Dependency —
Finding Tap a span

Trace Analysis

Choose the observation that best explains the trace.
Trace actions: 0 / 3
Engineering takeaway: A distributed trace turns one user request into a sequence of correlated spans. The key is not simply finding the longest span: engineers must understand dependency relationships, retries and whether work is sequential or overlapping before assigning causality.

Distributed Systems Observability

Distributed Systems

Today’s world of always-on applications and APIs has availability and reliability requirements that would have been needed of solely a handful of mission-critical services around the globe only a few decades ago. Likewise, the potential for rapid, viral service growth means that every application has to be built to scale nearly instantly in response to user demand.

Finally, these constraints and requirements mean that almost every application made—whether a consumer mobile app or a backend payments application—needs to be a distributed system. A distributed system is an environment where different components are spread across multiple computers on a network. These devices split up the work, harmonizing their efforts to complete the job more efficiently than if a single device had been responsible.

**The Key Components of Observability**

Observability in distributed systems is achieved through three main components: monitoring, logging, and tracing.

1. Monitoring: Monitoring involves continuously collecting and analyzing system metrics and performance indicators. It provides real-time visibility into the health and performance of the distributed system. By monitoring various metrics such as CPU usage, memory consumption, network traffic, and response times, engineers can proactively identify anomalies and make informed decisions to optimize system performance.

2. Logging: Logging involves recording events, activities, and errors within the distributed system. Log data provides a historical record that can be analyzed to understand system behavior and debug issues. Distributed systems generate vast amounts of log data, and effective log management practices, such as centralized log storage and log aggregation, are crucial for efficient troubleshooting.

3. Tracing: Tracing involves capturing the flow of requests and interactions between different distributed system components. It allows engineers to trace the journey of a specific request and identify potential bottlenecks or performance issues. Tracing is particularly useful in complex distributed architectures where multiple services interact.

**Benefits of Observability in Distributed Systems**

Adopting observability practices in distributed systems offers several benefits:

1. Enhanced Troubleshooting: Observability enables engineers to quickly identify and resolve issues by providing detailed insights into system behavior. With real-time monitoring, log analysis, and tracing capabilities, engineers can pinpoint the root cause of problems and take appropriate actions, minimizing downtime and improving system reliability.

2. Performance Optimization: By closely monitoring system metrics, engineers can identify performance bottlenecks and optimize system resources. Observability allows for proactive capacity planning and efficient resource allocation, ensuring optimal performance even under high loads.

3. Efficient Change Management: Observability facilitates monitoring system changes and their impact on overall performance. Engineers can track changes in metrics and easily identify any deviations or anomalies caused by updates or configuration changes. This helps maintain system stability and avoid unexpected issues.

What are VPC Flow Logs?

VPC Flow Logs is a feature offered by Google Cloud that captures and records network traffic information within Virtual Private Cloud (VPC) networks. Each network flow is logged, providing a comprehensive view of the traffic traversing. These logs include valuable information such as source and destination IP addresses, ports, protocol, and packet counts.

Once the VPC Flow Logs are enabled and data is being recorded, we can start leveraging the power of analysis. Google Cloud provides several tools and services for analyzing VPC Flow Logs. One such tool is BigQuery, a scalable and flexible data warehouse. By exporting VPC Flow Logs to BigQuery, we can perform complex queries, visualize traffic patterns, and detect anomalies using industry-standard SQL queries.

**How This Affects Failures**

The primary issue I have seen with my clients is that application failures are no longer predictable, and dynamic systems can fail creatively, challenging existing monitoring solutions. But, more importantly, the practices that support them. We have a lot of partial failures that are not just unexpected but not known or have never been seen before. For example, if you recall, we have the network hero. 

**The network Hero**

It is someone who knows every part of the network and has seen every failure at least once. These people are no longer helpful in today’s world and need proper Observation. When I was working as an Engineer, we would have plenty of failures, but more than likely, we would have seen them before. And there was a system in place to fix the error. Today’s environment is much different.

We can no longer rely on simply seeing a UP or Down, setting static thresholds, and then alerting based on those thresholds. A key point to note at this stage is that none of these thresholds considers the customer’s perspective.  If your POD runs at 80% CPU, does that mean the customer is unhappy?

When monitoring, you should look from your customer’s perspectives and what matters to them. Content Delivery Network (CDN) was one of the first to realize this game and measure what matters most to the customer.

Distributed Systems Observability

The different demands

So, the new, modern, and complex distributed systems place very different demands on your infrastructure and the people who manage it. For example, in microservices, there can be several problems with a particular microservice:

    • The microservices could be running under high resource utilization and, therefore, slow to respond, causing a timeout
    • The microservices could have crashed or been stopped and is, therefore, unavailable
    • The microservices could be fine, but there could be slow-running database queries.
    • So we have a lot of partial failures. 

Consequently, We can no longer predict

The significant shift we see with software platforms is that they evolve much quicker than the products and paradigms we use to monitor them. As a result, we need to consider new practices and technologies with dedicated platform teams and sound system observability. We can’t predict anything anymore, which puts the brakes on some traditional monitoring approaches, especially the metrics-based approach to monitoring.

I’m not saying that these monitoring tools are not doing what you want them to do. But, they work in a siloed environment, and there is a lack of connectivity. So we have monitoring tools working in silos in different parts of the organization and more than likely managed by other people trying to monitor a very dispersed application with multiple components and services in various places. 

Relying On Known Failures

Metric-Based Approach

A metrics-based monitoring approach relies on having previously encountered known failure modes. The metric-based approach relies on known failures and predictable failure modes. So, we have predictable thresholds that someone is considered to experience abnormal.

Monitoring can detect when these systems are either over or under the predictable thresholds that were previously set. Then, we can set alerts, and we hope that these alerts are actionable. This is only useful for variants of predictable failure modes.

Traditional metrics and monitoring tools can tell you any performance spikes or notice that a problem occurs. But they don’t let you dig into the source of the issues and let us slice and dice or see correlations between errors. If the system is complex, this approach is more challenging in getting to the root cause in a reasonable timeframe.

Google Cloud Trace

Example: Application Latency & Cloud Trace

Before we discuss Cloud Trace’s specifics, let’s establish a clear understanding of application latency. Latency refers to the time delay between a user’s action or request and the corresponding response from the application. It includes network latency, server processing time, and database query execution time. By comprehending the different factors contributing to latency, developers can proactively optimize their applications for improved performance.

Google Cloud Trace is a powerful diagnostic tool offered by Google Cloud Platform (GCP) that enables developers to identify and analyze application latency bottlenecks. It provides detailed insights into the flow of requests and events within an application, allowing developers to pinpoint areas of concern and optimize accordingly. Cloud Trace integrates seamlessly with other GCP services and provides a comprehensive view of latency across various components of an application stack.

Traditional style metrics systems

With traditional metrics systems, you had to define custom metrics, which were always defined upfront. This approach prevents us from starting to ask new questions about problems. So, it would be best to determine the questions to ask upfront.

Then, we set performance thresholds, pronounce them “good” or “bad, ” and check and re-check those thresholds. We would tweak the thresholds over time, but that was about it. This monitoring style has been the de facto approach, but we don’t now want to predict how a system can fail. Always observe instead of waiting for problems, such as reaching a certain threshold before acting.

**Metrics: Lack of connective event**

The metrics did not retain the connective event, so you cannot ask new questions in the existing dataset. These traditional system metrics could miss unexpected failure modes in complex distributed systems. Also, the condition detected via system metrics might be unrelated to what is happening.

An example of this could be an odd number of running threads on one component, which might indicate garbage collection is in progress or that slow response times are imminent in an upstream service.

**Users experience static thresholds**

User experience means different things to different sets of users. We now have a model where different service users may be routed through the system in other ways, using various components and providing experiences that can vary widely. We also know now that the services no longer tend to break in the same few predictable ways over and over.  

We should have a few alerts triggered by only focusing on symptoms that directly impact user experience and not because a threshold was reached.

The Challenge: Can’t reliably indicate any issues with user experience

If you use static thresholds, they can’t reliably indicate any issues with user experience. Alerts should be set up to detect failures that impact user experience. Traditional monitoring falls short in this regard. With traditional metrics-based monitoring, we rely on static thresholds to define optimal system conditions, which have nothing to do with user experience.

However, modern systems change shape dynamically under different workloads. Static monitoring thresholds can’t reflect impacts on user experience. They lack context and are too coarse.

Required: Distributed Systems Observability

Systems observability and reliability in distributed systems are practices. Rather than just focusing on a tool that logs, metrics, or alters, Observability is all about how you approach problems, and for this, you need to look at your culture. So you could say that Observability is a cultural practice that allows you to be proactive about findings instead of relying on a reactive approach that we are used to in the past.

Nowadays, we need a different viewpoint and want to see everything from one place. You want to know how the application works and how it interacts with the other infrastructure components, such as the underlying servers, physical or server, the network, and how data transfer looks in a transfer and stale state. 

Levels of Abstraction

What level of observation is needed to ensure everything performs as it should? What should you look at to obtain this level of detail?

Monitoring is knowing the data points and the entities from which we gather information. On the other hand, Observability is like putting all the data together. So monitoring is collecting data, and Observability is putting it together in one single pane of glass. Observability is observing the different patterns and deviations from the baseline; monitoring is getting the data and putting it into the systems. A vital part of an Observability toolkit is service level objectives (slos).

**Preference: Distributed Tracing**

We have three pillars of Systems Observability. There are Metrics, Traces, and Logging. So, defining or viewing Observability as having these pillars is an oversimplification. But for Observability, you need these in place. Observability is all about connecting the dots from each of these pillars.

If someone asked me which one I prefer, it would be distributed tracing. Distributed tracing allows you to visualize each step in service request executions. As a result, it doesn’t matter if services have complex dependencies. You could say that the complexity of the Dynamic systems is abstracted with distributed tracing.

**Use Case: Challenges without tracing**

For example, latency can stack up if a downstream database service experiences performance bottlenecks, resulting in high end-to-end latency. When latency is detected three or four layers upstream, it can be complicated to identify which component of the system is the root of the problem because now that same latency is being seen in dozens of other services.

**Distributed tracing: A winning formula**

Modern distributed systems tend to scale into a tangled knot of dependencies. Therefore, distributed tracing shows the relationships between various services and components in a distributed system. Traces help you understand system interdependencies. Unfortunately, those inter-dependencies can obscure problems and make them challenging to debug unless their relationships are clearly understood.

In distributed systems, observability is vital in ensuring complex architectures’ stability, performance, and reliability. Monitoring, logging, and tracing provide engineers with the tools to understand system behavior, troubleshoot issues, and optimize performance. By adopting observability practices, organizations can effectively manage their distributed systems and provide seamless and reliable services to their users.

Interactive Distributed Systems Lab 03

Observability Architecture & Dependency Lab

Distributed applications cross application, platform, network and external dependency boundaries. Explore the architecture and identify where an observability design can still leave engineers blind.

ARCHITECTURE SCENARIO

Your application runs on Kubernetes and uses several microservices, a service mesh, a database and an external payment provider. The team has application metrics and logs, but an incident still cannot be explained quickly. Find the visibility gaps.

Distributed application — tap components to inspect observability coverage
Application
User-facing workloads and service dependencies
→
Platform
Kubernetes and service-to-service communication
→
Dependencies
Data, network and third-party systems

Visibility Inspector

Inspect what telemetry exists and what may still be missing.
Select an architecture component
Component —
Telemetry —
Visibility —
Risk —

Investigation Tasks

Identify the three capabilities most important for explaining cross-service failures.
Architecture checks: 0 / 3
Engineering takeaway: Observability coverage should follow the dependency graph, not just the application code. A useful design connects telemetry across workloads, platform infrastructure, service-to-service communication, networks, databases and external dependencies so that failures can be correlated across boundaries.