
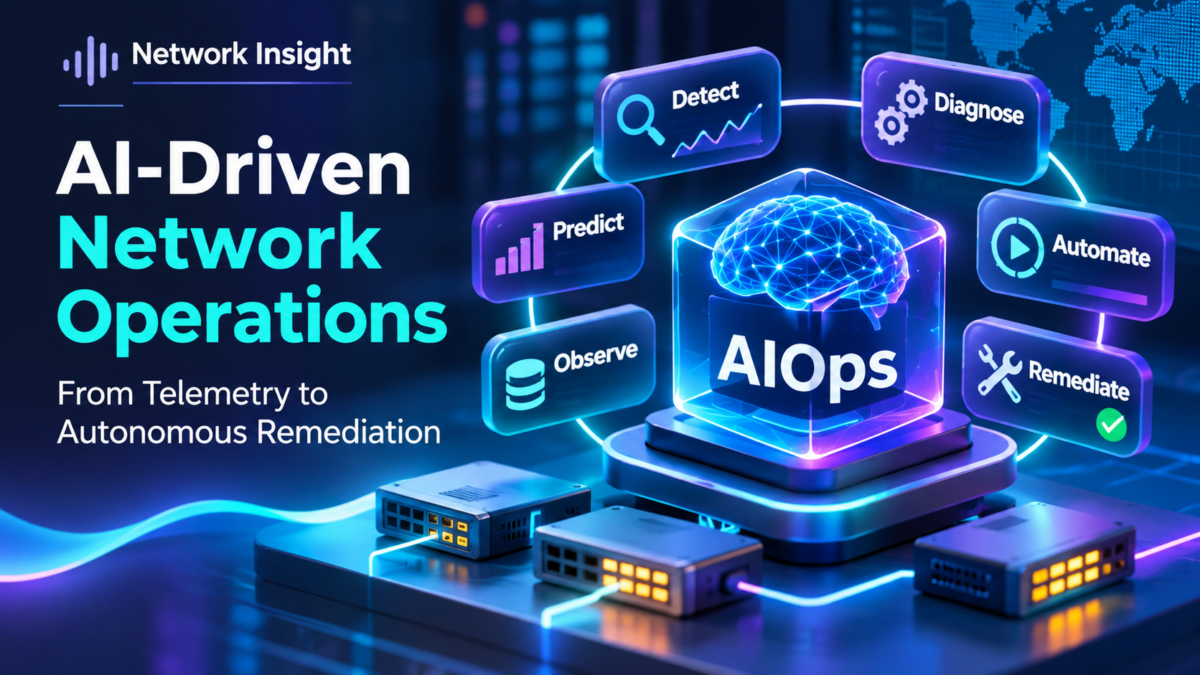
AI-Driven Network Operations Explained: AIOps, Telemetry, Anomaly Detection, and Autonomous Remediation
Modern networks generate enormous volumes of operational data from routers, switches, firewalls, cloud infrastructure, and distributed applications. Artificial intelligence can help network engineers transform this telemetry into actionable operational intelligence.
Traditional network operations depend on monitoring platforms, threshold-based alerts, event logs, and engineer-led troubleshooting. These approaches remain essential, but increasingly complex environments can generate more events than teams can efficiently investigate manually.
Artificial Intelligence for IT Operations (AIOps) introduces techniques such as anomaly detection, event correlation, predictive analytics, and automated incident investigation. Applied to networking, these techniques can help engineers identify unusual routing behavior, detect performance degradation, and investigate infrastructure failures.
AIOps does not replace routing protocols, monitoring systems, or sound network engineering. Instead, it adds an analytical layer that interprets infrastructure telemetry and supports better operational decisions.
Understanding the AI-Driven Network Operations Architecture
An AIOps architecture connects network infrastructure to telemetry collectors, data processing systems, analytical engines, and controlled automation workflows.
The following conceptual architecture illustrates how operational data becomes an investigation, a recommendation, and potentially an authorized network change.
Network Infrastructure
Telemetry and Data Processing
AI Analysis and Investigation
Controlled Network Operations
Simplified architecture for educational purposes. AI analysis may produce hypotheses rather than definitive diagnoses. Production remediation requires explicit authorization, safety checks, auditability, and rollback planning.
Three Core Capabilities of AI-Driven Network Operations
Detect Network Anomalies
Identify deviations in routing behavior, interface utilization, latency, packet loss, and other operational signals. Statistical and machine-learning techniques can supplement conventional thresholds.
Investigate Root Causes
Correlate network topology, event timestamps, routing changes, telemetry, and recent configuration activity to develop and test possible explanations for an incident.
Support Controlled Remediation
Recommend corrective actions, evaluate operational risk, request approval, and validate results. Automation can execute permitted changes when appropriate safeguards are satisfied.
Engineering Example: Investigating a BGP Failure
Consider an enterprise WAN where an eBGP neighbor becomes unavailable. The event may trigger route withdrawals, alternative path selection, increased latency, and application performance alerts.
A conventional monitoring system may generate several independent notifications. An AIOps system can correlate these events using network topology, timing, and routing state to support a more focused investigation.
Telemetry reports a neighbor state transition and related route changes.
The system links routing changes, interface events, and affected traffic.
The analysis compares link state, BGP logs, topology, and recent configuration changes.
Engineers receive evidence, a proposed investigation or fix, and validation steps.
This approach does not guarantee that AI will identify the correct root cause. Its value depends on the completeness of telemetry, the accuracy of network context, the quality of analytical methods, and the controls surrounding automated actions.
From Reactive Monitoring to Intelligent Network Operations
AI-driven network operations combine network telemetry, topology awareness, anomaly detection, event correlation, and controlled automation to help engineers understand and manage increasingly complex infrastructure. The goal is not automation for its own sake, but faster investigation, better operational decisions, and safer network changes.
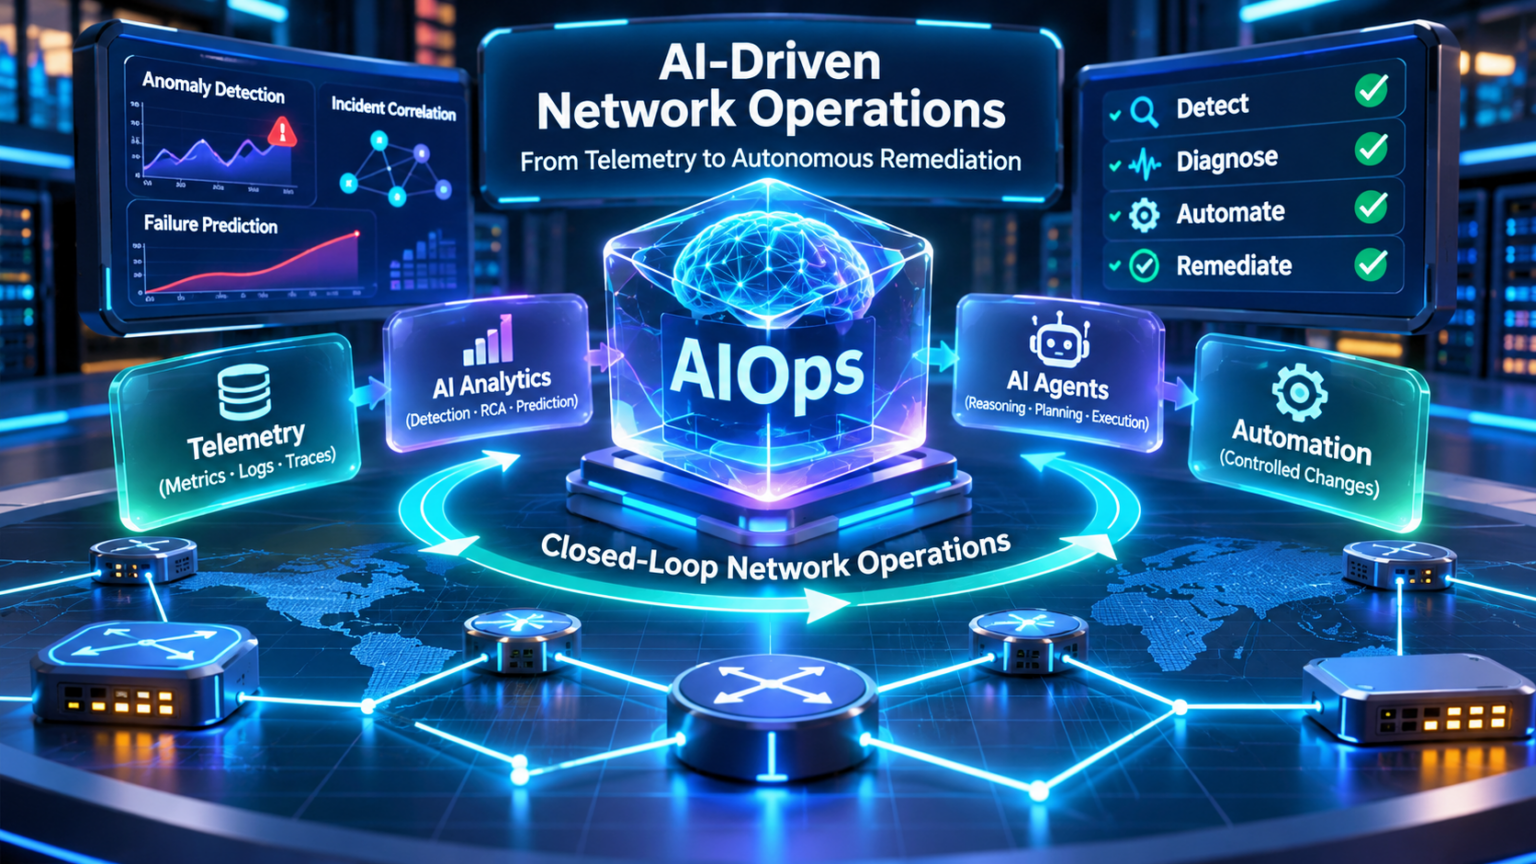
Explore the AIOps Architecture
Follow the complete AI-driven network operations journey, from telemetry collection and anomaly detection to AI agents, autonomous remediation, and enterprise production architecture. Select any section to explore its engineering concepts.
Understanding AI-Driven Network Operations Architecture
AI-driven network operations combine traditional network management, telemetry infrastructure, analytical systems, and controlled automation into a unified operational architecture. The goal is to improve network visibility, accelerate incident investigation, and support reliable operational decisions.
Enterprise networks contain many interconnected components, including routers, switches, firewalls, WAN circuits, virtual networks, and cloud infrastructure. Each component produces operational signals that describe its current state and behavior.
Network engineers traditionally interpret these signals through command-line interfaces, monitoring dashboards, syslog events, SNMP, and protocol-specific troubleshooting tools.
An AIOps architecture adds data processing and analytical capabilities that can correlate these signals across devices, time periods, network paths, and operational events.
1.1 The Five Layers of an AIOps Network Architecture
A practical AIOps architecture can be divided into five logical layers. Each layer performs a different engineering function and introduces its own operational dependencies.
Network Infrastructure Layer
Telemetry Collection Layer
Data Processing and Intelligence Layer
Operational Decision Layer
Automation and Validation Layer
Conceptual logical architecture. Individual products may combine several layers, and some deployments use AIOps only for observation and recommendations without automated configuration changes.
1.2 Data Plane, Control Plane, and Management Plane
AIOps must understand the difference between network forwarding, routing decisions, and operational management. These are distinct functions that produce different categories of evidence.
Data Plane
Forwards packets according to installed forwarding state. Operational evidence includes interface counters, packet drops, latency, queue occupancy, and forwarding behavior.
Control Plane
Establishes routing and other control information. AIOps can investigate BGP neighbor transitions, OSPF adjacency changes, route withdrawals, and convergence events.
Management Plane
Provides configuration, telemetry, monitoring, and administrative access. Common interfaces include NETCONF, RESTCONF, gNMI, SSH, and management APIs.
A network incident may involve more than one plane. For example, a failed physical link can cause a routing adjacency to transition down, resulting in forwarding changes and application performance degradation.
Effective AIOps analysis therefore requires cross-plane correlation rather than interpreting isolated alerts without network context.
1.3 The AIOps Operational Decision Lifecycle
AI-driven operations should follow a structured process that separates observation from decision-making and execution.
Collect device state, protocol events, counters, and performance telemetry.
Detect unusual patterns, correlate signals, and assess possible causes.
Evaluate evidence, impact, confidence, policy, and corrective options.
Execute only authorized actions through controlled operational workflows.
Compare actual network state with expected results and verify recovery.
1.4 Engineering Principles for Reliable AIOps
Telemetry Quality
Incomplete, delayed, or inconsistent network telemetry can produce misleading analytical conclusions. Timestamp accuracy and data completeness matter.
Topology Awareness
Network relationships provide context for understanding dependencies, failure propagation, routing paths, and affected services.
Evidence-Based Analysis
AI-generated explanations should be evaluated against measurable network state, operational logs, and independent verification.
Controlled Automation
Production changes require authorization, bounded scope, auditability, pre-change checks, and recovery planning.
1.5 Traditional Monitoring vs AI-Driven Network Operations
| Engineering Area | Traditional Monitoring | AI-Driven Operations |
|---|---|---|
| Event Detection | Configured thresholds and rules | Rules plus learned or statistical anomaly detection |
| Event Correlation | Manual analysis or predefined correlation rules | Context-aware and model-assisted correlation |
| Root Cause Investigation | Engineer-led troubleshooting | Evidence aggregation and AI-assisted hypotheses |
| Predictive Analysis | Trend reports and capacity thresholds | Forecasting and probabilistic risk estimation |
| Remediation | Manual or predefined automation | AI-assisted recommendations and controlled workflows |
| Validation | Manual verification and monitoring | Automated state comparison with engineering checks |
AI-driven operations extend traditional monitoring rather than eliminating it. Deterministic checks, protocol expertise, and conventional monitoring remain essential foundations for reliable network investigation.
1.6 Engineering Scenario: BGP Neighbor Failure
Consider a network containing two routers connected through an eBGP session. A physical interface failure interrupts connectivity between the peers.
The resulting operational signals may include interface state changes, BGP neighbor transitions, withdrawn prefixes, routing table updates, and increased latency on an alternate path.
An AIOps system can use timestamps and topology information to correlate these signals into a single incident candidate. It can then evaluate whether the interface failure plausibly explains the subsequent routing and performance changes.
AIOps Begins with Network Architecture and Reliable Evidence
AI-driven network operations depend on a well-engineered foundation of network telemetry, control-plane visibility, topology context, data processing, analytical models, and controlled automation. The objective is to transform operational signals into useful engineering decisions while preserving security, validation, and human oversight.
AIOps Network Architecture Explorer
Explore how AI-driven network operations connects infrastructure, streaming telemetry, anomaly analysis, incident correlation, agentic decisions and controlled remediation.
Healthy Network
AIOps processing pipeline
Network operational state
Telemetry and AI evidence
AIOps event timeline
AI engineering assessment
Network Telemetry and Data Collection for AIOps
Network telemetry provides the operational evidence required for AI-driven network monitoring, anomaly detection, incident correlation, and predictive analytics. Without reliable telemetry, an AIOps platform cannot accurately understand network behavior.
Routers, switches, firewalls, and network services continuously generate information describing their operational state. This information includes interface counters, routing protocol events, forwarding statistics, packet loss, latency measurements, and configuration changes.
Traditional monitoring systems commonly retrieve data at scheduled intervals or receive event notifications when specific conditions occur. Modern telemetry architectures can also stream structured operational data from devices to centralized collectors.
For AI-driven network operations, the engineering challenge is not simply collecting more data. It is collecting the right signals, at the right frequency, with accurate timestamps, consistent structure, and sufficient network context.
2.1 The Network Telemetry Processing Pipeline
A production telemetry architecture transforms raw infrastructure measurements into structured data that analytical systems can interpret.
The following conceptual pipeline illustrates five common processing stages.
Network Devices
Routers, switches, firewalls, WAN and cloud systems.
Collection
gNMI, SNMP, syslog, APIs, and flow exports.
Processing
Parsing, validation, normalization, and enrichment.
Storage
Time-series data, event stores, and historical records.
AI Analysis
Anomaly detection, correlation, and prediction.
Conceptual data flow. Production systems may use message brokers, stream processors, distributed collectors, and multiple storage systems. Real-time analytics can also process telemetry before long-term storage.
2.2 The Main Sources of Network Telemetry
Different network technologies expose different types of operational information. A useful AIOps architecture combines multiple sources rather than depending on a single monitoring protocol.
Interface Metrics
Link state, bandwidth, utilization, errors, discards, queue occupancy, and physical-layer performance indicators.
Routing Telemetry
BGP neighbor state, OSPF adjacencies, route changes, next-hop information, and convergence events.
Event and Security Logs
Syslog messages, firewall decisions, authentication events, configuration changes, and system warnings.
Traffic and Flow Data
Flow records, traffic volumes, source-destination relationships, application paths, and communication patterns.
2.3 SNMP, Syslog, gNMI, and Streaming Telemetry
Network telemetry is not a single protocol. Several technologies are commonly combined to collect measurements, receive events, and retrieve structured operational state.
| Technology | Primary Purpose | Engineering Characteristics | AIOps Use |
|---|---|---|---|
| SNMP | Network monitoring and management | Polling of management objects and asynchronous notifications through traps or informs. | Interface counters, device health, and operational alerts. |
| Syslog | Operational event logging | Event-oriented messages with severity and implementation-dependent structure. | Incident detection, protocol events, and troubleshooting evidence. |
| gNMI | Structured network management and telemetry | gRPC-based interface supporting Get, Set, and Subscribe operations for modeled data. | Streaming operational state, counters, and selected configuration data. |
| NETCONF | Configuration and state management | XML-based RPC framework using modeled network data, commonly with YANG. | Configuration context, state retrieval, and controlled automation. |
| IPFIX / NetFlow | Traffic flow measurement | Exported records describing observed traffic flows, often using sampling or aggregation. | Traffic analysis, behavioral baselines, and flow anomalies. |
Important distinction: Streaming telemetry describes a data delivery approach, not a single protocol. gNMI is one widely used interface for subscribing to modeled telemetry, but other vendor-specific and standards-based mechanisms also exist.
2.4 Understanding gNMI and Model-Driven Telemetry
The gRPC Network Management Interface (gNMI) provides operations for retrieving, modifying, and subscribing to network configuration and operational state.
gNMI telemetry commonly uses structured data paths based on network models, including OpenConfig and supported vendor models.
A collector can subscribe to selected operational paths and receive updates according to supported subscription modes.
Sample Subscription
The device publishes selected data at a configured or negotiated sampling interval, subject to implementation support.
On-Change Subscription
The device reports updates when subscribed values change, where the selected paths and platform support this mode.
Target-Defined Behavior
The device determines the applicable update behavior for supported telemetry paths. The collector must understand the resulting semantics.
Subscription behavior, update intervals, timestamp semantics, and available data depend on the device platform, operating system, and telemetry implementation.
2.5 Normalization, Enrichment, and Time-Series Storage
Raw network telemetry is rarely ready for AI analysis immediately after collection. Devices may use different naming conventions, schemas, counter types, timestamps, and measurement units.
A processing layer transforms these inputs into a consistent representation.
Normalize
Standardize interface identifiers, metric names, units, device identity, and schema fields. Preserve the original measurement meaning.
Enrich
Associate telemetry with topology, device roles, site information, routing neighbors, and recent changes.
Store and Query
Retain suitable historical metrics, event records, and operational context for investigation and model analysis.
Time-series databases are useful for storing measurements indexed by time, while event stores and log platforms retain operational messages and incident evidence.
Network topology, configuration history, and inventory information may require separate data stores or contextual services.
2.6 Engineering Scenario: Telemetry During a BGP Failure
Consider a WAN router that loses its physical connection to an external BGP neighbor.
Several telemetry sources may record different symptoms of the same underlying incident.
The device reports that the connected interface transitioned to a down state.
The local BGP process reports loss of the established neighbor session.
Routes associated with the failed neighbor are removed or replaced according to available alternatives.
Monitoring detects increased latency or traffic redistribution across an alternate path.
The analytics platform groups related events and identifies the interface failure as a plausible initiating event.
Illustrative timestamps only. Real event ordering and collection delays depend on device behavior, routing convergence, monitoring intervals, clock synchronization, and telemetry transport.
This example demonstrates why an AIOps system needs more than an isolated BGP neighbor alert.
Interface state, routing protocol behavior, forwarding changes, and performance measurements provide complementary evidence.
2.7 Telemetry Data Quality and Engineering Reliability
AI models can produce misleading conclusions when their inputs are incomplete, inconsistent, or poorly contextualized.
Network telemetry engineering must therefore address several important data-quality requirements.
Timestamp Accuracy
Synchronize device clocks where possible and distinguish measurement timestamps from collector arrival times.
Collection Completeness
Detect missing updates, telemetry gaps, dropped messages, and unavailable data sources.
Schema Consistency
Normalize data while preserving the meaning of counters, gauges, state transitions, and measurement units.
Context and Identity
Associate metrics with the correct device, interface, routing instance, topology location, and operational role.
2.8 Counter Semantics and Network Anomaly Detection
Many network measurements are cumulative counters, including transmitted bytes, received packets, interface errors, and packet discards.
AIOps platforms often need to calculate rates from counter changes over time.
Other telemetry values are gauges or state measurements rather than cumulative counters.
Examples include interface operational state, temperature, queue occupancy, and current BGP neighbor state.
The analytical system must understand the measurement type before applying anomaly detection or forecasting methods.
2.9 Production Telemetry Architecture Considerations
A production telemetry platform must remain reliable even when the monitored network is experiencing failures.
Collector placement, network reachability, buffering, data retention, and telemetry volume all influence operational reliability.
Collector Resilience
Use appropriate redundancy and recovery mechanisms so collector failures do not silently remove network visibility.
Secure Collection
Authenticate telemetry endpoints, protect transport channels, restrict access, and safeguard sensitive operational data.
Telemetry Volume
Control sampling, subscription scope, storage retention, and high-cardinality metrics to avoid unnecessary overhead.
Pipeline Observability
Monitor collector health, processing latency, message loss, ingestion failures, and storage availability.
Reliable AI Analysis Begins with Reliable Network Telemetry
AIOps platforms depend on accurate network measurements, structured collection, consistent timestamps, data normalization, topology enrichment, and historical context. These capabilities transform raw infrastructure signals into evidence that can support anomaly detection, incident correlation, root cause investigation, and predictive network analytics.
Streaming Network Telemetry Simulator
Compare network telemetry collection methods, inspect live-style operational metrics, simulate congestion and sample loss, and understand how telemetry feeds AI-driven network analysis.
gNMI Streaming Telemetry
Live telemetry visualization
Structured telemetry records
Collection statistics
Engineering interpretation
AI-Based Network Anomaly Detection
AI-based network anomaly detection identifies unusual changes in network behavior by comparing current telemetry with expected patterns, historical baselines, statistical models, or learned relationships between network signals.
Enterprise networks experience continuous variation in bandwidth utilization, routing activity, latency, and application demand. Not every change indicates a problem. A sudden increase in traffic, for example, may reflect a legitimate backup operation, a scheduled software deployment, or an unexpected network incident.
Conventional monitoring often relies on fixed thresholds and predefined alert rules. AI-driven analysis can supplement these mechanisms by learning recurring behavior, identifying multivariate deviations, and highlighting conditions that deserve engineering investigation.
The objective is not simply to generate more alerts. It is to identify meaningful deviations while reducing unnecessary operational noise.
3.1 The Network Anomaly Detection Pipeline
An anomaly detection system transforms network measurements into candidate findings that engineers or automated investigation workflows can evaluate.
Collect
Gather routing events, interface metrics, latency and loss.
Prepare
Validate timestamps, clean samples, normalize signals.
Baseline
Establish expected behavior by device, time and workload.
Score
Measure deviations and identify unusual combinations of signals.
Investigate
Correlate findings with topology, events and changes.
Conceptual analytical workflow. Real systems may perform streaming detection, batch analysis, or a combination of both.
3.2 Establishing Normal Network Behavior
A network baseline describes expected operational behavior under defined conditions. Useful baselines account for device roles, traffic patterns, time of day, maintenance windows, and recurring workload cycles.
A WAN interface may routinely operate at high utilization during a nightly backup. The same utilization at an unusual time, accompanied by packet loss and increased latency, may warrant further investigation.
3.3 Common Network Anomaly Categories
Interface Anomalies
Unexpected utilization spikes, increasing discards, CRC errors, or abnormal interface state transitions.
Routing Anomalies
Unusual BGP update rates, repeated neighbor resets, unexpected prefix changes, or abnormal path selection.
Performance Anomalies
Deviations in latency, jitter, packet loss, or application path performance relative to expected conditions.
Traffic Flow Anomalies
Unexpected traffic concentration, unusual source-destination patterns, or changes in flow distribution.
Control-Plane Instability
Repeated adjacency changes, route churn, or unexpected control-plane event frequency.
Security-Related Anomalies
Unusual connection patterns, scanning indicators, or traffic deviations requiring security investigation.
3.4 Statistical and Machine-Learning Detection Methods
Network anomaly detection can use deterministic thresholds, statistical techniques, machine-learning models, and combinations of these approaches. Each method has different data requirements and operational limitations.
| Method | How It Works | Network Example | Limitation |
|---|---|---|---|
| Fixed Threshold | Alerts when a measurement crosses a configured limit. | Interface utilization exceeds 90%. | Does not automatically adapt to workload patterns. |
| Statistical Baseline | Compares observations with expected distributions or ranges. | Latency deviates from its normal hourly pattern. | Can be sensitive to seasonality and nonstationary data. |
| Change-Point Detection | Identifies significant changes in a measurement's behavior. | Sudden sustained increase in packet loss. | May flag legitimate operational changes. |
| Isolation Forest | Uses randomized partitioning to identify unusual observations. | Unusual combinations of traffic and error metrics. | Requires suitable features and threshold calibration. |
| Autoencoder | Learns to reconstruct representative patterns and scores reconstruction differences. | Multivariate deviations across network telemetry. | Can learn undesirable patterns or fail under data drift. |
| Sequence Models | Analyzes temporal relationships across observations. | Abnormal sequences of routing or performance events. | Requires appropriate temporal data and careful validation. |
More complex models are not necessarily more accurate. A well-designed statistical detector may outperform a poorly calibrated machine-learning system for a particular network metric.
3.5 Multivariate Anomaly Detection
Individual network measurements can appear normal while their combined behavior indicates an unusual condition. Multivariate detection evaluates relationships between several signals.
Interface Utilization
Traffic increases from a typical 40% to 75%, which may still be within operational capacity.
Packet Discards
Output discards rise at the same time, suggesting possible queue pressure or another forwarding issue.
Latency
Path latency increases significantly, strengthening the case for investigating congestion.
The combined signals may justify investigating a congestion hypothesis. However, they do not prove congestion without further evidence from queue counters, traffic paths, device state, and relevant operational context.
3.6 Engineering Scenario: Detecting BGP Route Instability
Consider an enterprise edge router connected to two upstream providers. During normal operation, the router receives relatively stable routing information, with occasional updates reflecting ordinary Internet changes.
An anomaly detector observes a sudden increase in route updates from one peer. It also detects repeated withdrawals and advertisements for a subset of prefixes.
The detector has identified unusual routing activity, but several explanations remain possible: an unstable upstream link, routing policy changes, planned maintenance, or legitimate external routing events.
Further investigation should determine which prefixes are affected, whether the neighbor session is stable, whether forwarding has changed, and whether application services are experiencing an impact.
3.7 False Positives, False Negatives, and Alert Quality
Anomaly detection systems must balance sensitivity with operational usefulness. A detector that reports every variation can overwhelm engineers, while one that is too conservative may miss important incidents.
False Positives
Legitimate network behavior is classified as anomalous. Examples include planned backup traffic, maintenance events, or normal workload peaks.
False Negatives
A meaningful network incident is not detected. This may occur when thresholds are poorly calibrated, relevant telemetry is missing, or the incident resembles learned baseline behavior.
Detection performance should be evaluated using suitable measures, including precision, recall, false-positive rates, detection delay, and operational investigation cost.
Model confidence or anomaly scores should not automatically be interpreted as the probability that a network fault exists.
3.8 Model Drift and Changing Network Behavior
Networks are not static environments. New applications, traffic migrations, infrastructure upgrades, routing policy changes, and seasonal workload patterns can alter normal behavior.
A model trained on historical telemetry may become less useful as the network evolves. This problem is commonly described as data drift or concept drift, depending on what has changed.
Monitor Detection Quality
Track changes in input distributions, alert volumes, investigation outcomes, and detector performance. Reassess models when behavior changes materially.
Maintain Reliable Baselines
Use appropriate baseline windows, maintenance context, periodic validation, and controlled recalibration rather than continuously accepting every observation as normal.
3.9 Engineering Checklist: Production Anomaly Detection
Detect Unusual Behavior Before Assuming Network Failure
AI-driven network anomaly detection combines reliable telemetry, behavioral baselines, statistical analysis, machine-learning models, and network context to identify conditions that deserve investigation. Effective engineering requires distinguishing unusual observations from confirmed faults, validating detector performance, and maintaining human oversight for operational decisions.
Network Anomaly Detection Lab
Train a baseline, generate synthetic network observations, compare detection algorithms and investigate how AIOps identifies unusual network behavior.
Baseline learning and anomaly classification
Establish normal network behavior, then compare incoming observations with the selected detection model.
Anomaly severity
Detection model
Detection event log
Engineering interpretation
AI Root Cause Analysis and Event Correlation
AI-assisted root cause analysis helps network engineers investigate how infrastructure failures propagate through routing protocols, forwarding paths, and dependent services. Event correlation groups related operational signals into a more coherent incident view.
A single network failure can generate many monitoring alerts. A failed physical interface may cause BGP or OSPF adjacency changes, route withdrawals, traffic redistribution, packet loss, and application performance degradation.
These events describe different consequences of a shared incident, but they do not necessarily identify its initiating cause. Network engineers must distinguish between the original failure, intermediate effects, and downstream symptoms.
AIOps platforms can assist by combining timestamps, topology relationships, routing information, configuration history, and operational measurements to develop and evaluate possible root cause hypotheses.
4.1 The AI Event Correlation Architecture
Network event correlation transforms fragmented monitoring information into incident candidates supported by contextual evidence.
Collect Events
Interface alarms, routing logs, performance alerts.
Normalize
Align timestamps, identify devices, standardize events.
Correlate
Group related events using time, topology and context.
Investigate
Evaluate candidate causes against available evidence.
Respond
Present findings, recommend checks, support decisions.
Simplified workflow. Production platforms may use rules, statistical correlation, graph analysis, machine learning, and language-model-assisted investigation.
4.2 Why One Network Failure Generates Multiple Alerts
Modern networks contain dependency chains. Physical connectivity supports routing adjacencies, routing protocols establish reachability, and forwarding paths support applications and services.
When a lower-layer dependency fails, multiple higher-layer components may report symptoms.
Interface Failure
Physical connectivity between routers is interrupted.
Neighbor Down
The routing session loses connectivity and transitions down.
Route Changes
Affected routes are withdrawn or replaced.
Path Changes
Forwarding may move to an alternative path.
Application Alert
Users may experience latency, packet loss, or interrupted service.
Illustrative dependency chain. The actual effects depend on routing design, redundancy, convergence, traffic patterns, and failure conditions.
An AIOps platform should avoid treating every downstream alert as a separate root cause. Instead, it can investigate whether a common dependency explains several observations.
4.3 The Main Sources of Correlation Evidence
Interface and Link Events
Link transitions, errors, optical measurements, port counters, and physical connectivity status.
Routing Protocol Events
BGP neighbor resets, OSPF adjacency transitions, route withdrawals, and convergence information.
Network Topology
Device connections, routing relationships, redundant paths, and service dependencies.
Configuration History
Recent deployments, routing policy modifications, interface changes, and approved maintenance activity.
Performance Measurements
Latency, jitter, packet loss, traffic rates, queue occupancy, and application reachability.
Security and Policy Events
Firewall denies, session failures, access-control changes, and authentication events.
4.4 Time-Based, Topology-Based, and Causal Investigation
Different correlation techniques answer different engineering questions. A reliable investigation combines temporal relationships with network structure and protocol behavior.
| Technique | Engineering Question | Example | Limitation |
|---|---|---|---|
| Time-Based Correlation | Did events occur within a related time window? | Interface-down and BGP-down events occur close together. | Coincidence and collection delays can mislead analysis. |
| Topology-Based Correlation | Do affected components share a dependency? | Several services traverse the same WAN link. | Topology records may be incomplete or outdated. |
| Rule-Based Correlation | Does a known protocol or failure relationship apply? | Physical link failure precedes directly connected BGP session loss. | Rules may not cover unfamiliar incident patterns. |
| Graph-Based Analysis | Which infrastructure relationships connect the events? | Multiple impacted paths share a failed router. | Graph relationships do not automatically prove causation. |
| Machine-Learning Correlation | Which event combinations resemble learned patterns? | Repeated interface and routing instability patterns. | Results depend on training data and model validation. |
| AI-Assisted Investigation | What hypotheses and checks are supported by the evidence? | Generate a structured BGP troubleshooting plan. | Language-model explanations may be incorrect or unsupported. |
4.5 Engineering Scenario: BGP Failure Investigation
Consider a WAN edge router connected to an upstream provider. A physical interface failure interrupts the directly connected eBGP session.
The monitoring environment receives several events from different infrastructure components.
The edge router records a local physical interface state transition.
The directly connected BGP session transitions out of Established.
Routes learned through the failed neighbor are removed or replaced according to available alternatives.
Traffic monitoring observes redistribution toward a surviving route.
A service monitor detects performance degradation after the forwarding change.
Illustrative event sequence and timestamps. Actual convergence and alert timing depend on platform behavior, failure detection mechanisms, routing design, and collection delays.
These events support the hypothesis that a physical connectivity failure initiated the incident. However, the investigation should still validate whether the interface failure explains the observed routing and application behavior.
4.6 From Event Correlation to a Root Cause Hypothesis
A root cause analysis engine should produce an evidence-based explanation rather than simply selecting the earliest observed event.
The hypothesis is useful because it identifies a plausible initiating condition and provides a focused verification plan.
It is not a substitute for investigating the physical infrastructure, recent changes, and the upstream connection.
4.7 Root Cause vs Contributing Factors
Complex incidents may have multiple contributing factors. An initiating event may explain why a network changed state, while another weakness explains why the resulting impact was severe.
Initiating Failure
A WAN interface loses connectivity, triggering routing protocol and forwarding changes.
Contributing Factor
The alternate path has insufficient capacity to carry the redistributed traffic without congestion.
Observed Impact
Applications experience increased latency and packet loss despite continued network reachability.
A useful incident report should distinguish these factors instead of compressing every symptom into a single oversimplified explanation.
4.8 Engineering Challenges in AI Root Cause Analysis
Event Ordering and Clock Accuracy
Device clocks, buffering, and collection delays can make events appear in the wrong order. Correlation systems should distinguish source timestamps from ingestion times.
Incomplete Network Topology
Missing links, outdated inventory, and unknown dependencies can lead to incorrect conclusions about failure propagation.
Missing or Noisy Evidence
Dropped telemetry, repeated alarms, and inconsistent event formats can distort incident grouping and hypothesis evaluation.
Model Reliability
AI-generated explanations must remain traceable to observed network state and should not invent events, commands, or confirmed causes.
4.9 Production Root Cause Analysis Checklist
Correlation Connects Events; Engineering Evidence Establishes Causes
AI-assisted root cause analysis combines event timestamps, network topology, routing protocol state, performance telemetry, configuration history, and structured investigation to help engineers understand complex network incidents. Effective AIOps distinguishes initiating failures from downstream symptoms, evaluates alternative explanations, and validates conclusions before recommending operational changes.
AI Network Incident Correlation Engine
Investigate multi-device network incidents, group related alerts, trace dependencies and identify likely root causes using topology-aware event correlation.
BGP Neighbor Failure
Network event timeline
No events ingested.
Probable root cause
Correlation evidence
Structured incident record
Engineering interpretation
Predictive Network Analytics and Failure Forecasting
Predictive network analytics uses historical telemetry, statistical forecasting, and machine-learning techniques to estimate future network conditions and identify emerging operational risks before they become service-impacting incidents.
Traditional network monitoring describes what is happening now or what has already happened. Predictive analytics attempts to estimate what may happen next.
For network engineers, useful predictive applications include forecasting WAN bandwidth demand, identifying approaching capacity constraints, estimating the risk of recurring interface instability, and detecting patterns that may precede network performance degradation.
These predictions are probabilistic assessments rather than guarantees. Their reliability depends on telemetry quality, historical relevance, forecasting methods, and the stability of network operating conditions.
5.1 The Predictive Network Analytics Pipeline
A prediction system must collect historical measurements, prepare relevant features, evaluate models, generate forecasts, and monitor whether those forecasts remain accurate over time.
Collect History
Gather interface, routing, latency, and capacity data.
Prepare Features
Normalize signals, handle gaps, add context.
Build Models
Fit statistical forecasts or predictive models.
Forecast
Estimate trends, capacity limits, or risk indicators.
Validate
Compare forecasts with observations and recalibrate.
Conceptual architecture. Production systems may combine streaming analytics, scheduled forecasting, model monitoring, and capacity planning workflows.
5.2 Forecasting Network Capacity and Utilization
One of the most practical uses of predictive analytics is forecasting future bandwidth demand on WAN links, data centre uplinks, and shared network paths.
A network engineer may observe that an interface's peak utilization has increased steadily over several weeks. A forecasting model can estimate when utilization might approach a defined engineering threshold.
A planning threshold is not necessarily a hard technical failure point. Networks may experience congestion below or above a particular utilization percentage depending on traffic bursts, queue behavior, link characteristics, and application sensitivity.
5.3 Predictive Analytics Use Cases
Bandwidth Forecasting
Estimate future utilization and identify links that may require additional capacity.
Routing Instability Risk
Analyze recurring BGP resets, route churn, and associated network conditions to identify elevated instability indicators.
Performance Forecasting
Estimate latency or loss trends under recurring traffic conditions and planned workload changes.
Capacity Constraints
Forecast resource demand across uplinks, WAN circuits, and network infrastructure.
Hardware Health Trends
Identify worsening temperature, error-counter, or optical measurements that may justify preventive inspection.
Service Risk Estimation
Estimate the likelihood of future performance threshold violations using validated historical relationships.
5.4 Forecasting Techniques for Network Engineers
| Technique | Engineering Purpose | Network Example | Limitation |
|---|---|---|---|
| Moving Average | Smooth historical variation and estimate short-term trends. | Average WAN utilization. | May lag sudden changes and miss seasonality. |
| Exponential Smoothing | Forecast trends and, with suitable variants, seasonal patterns. | Daily traffic demand. | Depends on assumptions and model configuration. |
| ARIMA / SARIMA | Model temporal dependence and suitable seasonal behavior. | Hourly bandwidth forecasting. | Requires appropriate data preparation and validation. |
| Regression Models | Estimate future values from selected explanatory variables. | Traffic demand versus workload growth. | Relationships may change as the network evolves. |
| Tree-Based ML Models | Learn nonlinear relationships among engineered features. | Estimate congestion risk from utilization and queue metrics. | Feature quality and data leakage can distort results. |
| Sequence Models | Learn temporal patterns across multiple measurements. | Forecast multivariate network performance signals. | May require substantial representative training data. |
Model complexity should match the operational problem. For a stable bandwidth trend, a simple statistical forecast may be easier to validate and maintain than a complex machine-learning architecture.
5.5 Engineering Scenario: Early Warning of BGP Instability
Consider a WAN edge router that has experienced intermittent BGP neighbor resets over several days.
Historical telemetry shows increasing session reset frequency, occasional interface errors, and periods of elevated packet loss.
These observations may indicate deteriorating network conditions, but they do not establish that another BGP failure will occur.
More frequent session transitions observed across recent measurement windows.
Error counters show a sustained increase relative to the historical baseline.
Monitoring reports recurring packet-loss episodes on the affected path.
The session is currently operational, despite historical instability indicators.
Illustrative relative indicators, not calibrated probabilities or measured risk scores.
5.6 From Prediction to an Engineering Recommendation
Predictive analysis becomes useful when it supports a concrete, evidence-based operational decision.
The appropriate outcome may be a preventive maintenance ticket, closer monitoring, or a planned engineering investigation.
An elevated risk indicator should not automatically trigger disruptive routing changes without evidence, authorization, and impact assessment.
5.7 Prediction Intervals, Risk Scores, and Uncertainty
Forecasts are estimates, not deterministic descriptions of future network state.
Point Forecast
A single estimated future value, such as expected utilization during a future time window.
Prediction Interval
A range designed to express uncertainty around a future observation, when properly calibrated and validated.
Risk Score
A model-generated indicator of relative risk. It is not necessarily a calibrated failure probability.
Engineering teams should understand how forecasts and risk indicators are produced before incorporating them into capacity planning, maintenance scheduling, or automated decisions.
5.8 Evaluating Forecast Accuracy
Predictive models should be tested against observations that were not used to train them. Time-series evaluation must preserve temporal ordering to avoid learning from future information.
Historical Backtesting
Evaluate forecasts across multiple historical periods using rolling or expanding training windows. Compare predicted values with actual network measurements.
Forecast Error Metrics
Use suitable metrics such as mean absolute error or root mean squared error. For risk predictions, assess calibration, precision, recall, and operational consequences.
Model Drift
Detect changes caused by new applications, traffic migrations, routing policy updates, and infrastructure upgrades.
Operational Context
Include planned maintenance, seasonal demand, topology changes, and known incidents when interpreting predictions.
5.9 Production Predictive Analytics Checklist
Predictive Analytics Turns Historical Network Evidence into Forward-Looking Decisions
AI-driven predictive network analytics combines historical telemetry, forecasting models, capacity trends, risk indicators, uncertainty estimation, and engineering validation to help network teams anticipate emerging operational problems. Predictions are most valuable when they support measurable, proportionate, and controlled engineering decisions rather than unsupported claims of certain future failures.
Network Failure Prediction Simulator
Forecast network deterioration using historical telemetry, compare prediction methods and evaluate proactive maintenance decisions before operational thresholds are exceeded.
Interface Error Growth
Predictive risk score
Forecast model output
Risk assessment
Preventive maintenance recommendation
AI Agents and Network Automation
AI agents extend network automation by combining reasoning, contextual information, and controlled tool execution to investigate operational conditions and coordinate multi-step workflows.
Traditional network automation executes predefined instructions. A script may collect interface statistics, deploy configuration templates, or validate routing neighbors according to established rules.
An AI agent can support more flexible workflows by selecting from approved tools, interpreting returned data, forming investigation hypotheses, and deciding which permitted diagnostic action to perform next.
The distinction is important. AI agents do not replace network protocols, device operating systems, or automation interfaces. They operate above those components, using tools and policy-controlled workflows to interact with them.
6.1 AI Agent Architecture for Network Operations
A production-oriented AI network agent typically separates model reasoning from network access. Tool adapters retrieve telemetry or perform approved operations through existing infrastructure management interfaces.
Network Engineer
Defines objectives, reviews findings, authorizes changes.
AIOps Event Platform
Supplies alerts, incidents, telemetry, and operational context.
AI Network Agent
Interprets the task, plans investigation steps, selects approved tools, evaluates returned evidence, and proposes next actions.
Policy and Tool Gateway
Enforces permissions, validates arguments, records activity, and requires approval for sensitive operations.
Network Tool Adapters
CLI, NETCONF, RESTCONF, gNMI, controllers and APIs.
Network Infrastructure
Routers, switches, firewalls, WAN edges, and service platforms.
Conceptual architecture. Actual tool access must be enforced by independent authorization controls rather than model instructions alone.
6.2 How AI Agents Differ from Traditional Automation
| Capability | Traditional Automation | AI-Assisted Agent Workflow |
|---|---|---|
| Task Execution | Follows predefined scripts and workflows. | Selects permitted steps based on task context and returned results. |
| Network Investigation | Runs predefined diagnostic sequences. | Can propose follow-up diagnostics based on observed evidence. |
| Tool Selection | Determined by program logic. | May be selected by the model within an approved tool catalogue. |
| Unexpected Conditions | Requires explicit handling or operator intervention. | Can suggest alternative investigative paths, subject to validation. |
| Change Control | Implemented through automation platform policies. | Still requires independently enforced policies, authorization, and rollback controls. |
| Reliability | Predictable within its implemented logic. | May produce incorrect reasoning or tool choices and requires additional safeguards. |
6.3 Network Interfaces and Agent Tool Integration
AI agents interact with network infrastructure through software interfaces rather than directly controlling packet forwarding.
Network CLI
Retrieve routing tables, interface counters, neighbor states, and diagnostic outputs using approved commands.
NETCONF
Access structured network configuration and operational data through supported YANG-modeled interfaces.
RESTCONF
Use HTTP-based operations to retrieve or modify YANG-modeled network data on compatible devices.
gNMI
Retrieve, subscribe to, and where supported modify structured network management data.
Controller APIs
Integrate with SD-WAN, cloud networking, inventory, monitoring, and orchestration systems.
Model Context Protocol
Expose approved tools and contextual resources to AI applications through MCP-compatible clients and servers.
MCP can provide a standardized interface between an AI application and a tool provider. It does not replace NETCONF, RESTCONF, gNMI, or device APIs; an MCP server may wrap those existing interfaces.
6.4 The Agentic Network Investigation Lifecycle
A controlled investigation should separate observation and analysis from any operation that changes network state.
Receive
Accept incident or engineering objective.
Plan
Identify relevant evidence and diagnostic tools.
Observe
Retrieve network state through read-only tools.
Reason
Evaluate findings and alternative hypotheses.
Approve
Validate any proposed change and obtain approval.
Verify
Confirm results, capture evidence, and audit activity.
Read-only investigations may finish without a change request. Configuration changes require additional safeguards and authorization.
6.5 Engineering Scenario: AI-Assisted BGP Troubleshooting
Consider an enterprise edge router with an established eBGP session but an unexpected loss of reachability to a remote network.
A network engineer asks an AI agent to investigate the missing route. The agent selects approved read-only tools to examine neighbor status, received routing information, routing policy, and installed routes.
The evidence supports a routing-policy hypothesis, but the engineer must determine whether the filter is incorrectly configured or intentionally protecting the network.
An agent should not automatically remove a prefix filter merely because a route is missing. The missing route may be the intended result of a security or routing policy.
6.6 Read-Only Diagnostics vs Configuration Changes
Read-Only Investigation
Collect routing tables, interface counters, device inventory, configuration snapshots, and telemetry without intentionally changing network configuration.
State-Changing Operations
Modify routing policies, update interface settings, deploy ACLs, or restart sessions only through approved change workflows with independent authorization.
Even diagnostic tools may have operational impact. Commands that generate significant device load, expose sensitive data, or trigger active network tests should be restricted and assessed.
6.7 Security Architecture for AI Network Agents
AI agents introduce a new control surface because model-generated tool requests may influence network management operations.
Least Privilege
Grant access only to required devices, commands, APIs, and operational scopes.
Tool Validation
Validate command arguments, device identifiers, resource targets, and permitted operations.
Audit Logging
Record tool requests, execution results, approval decisions, and configuration changes.
Human Approval
Require explicit authorization for high-impact changes, routing policy updates, and disruptive operations.
Rollback Controls
Maintain configuration backups, candidate validation, and tested recovery procedures.
Prompt Injection Defense
Treat logs, tool responses, documents, and external content as untrusted data rather than instructions.
6.8 Agent Reliability and Operational Boundaries
AI agents can generate incorrect hypotheses, misinterpret command output, select inappropriate tools, or fail to recognize important network design constraints.
Production systems should enforce boundaries outside the model. These include tool allowlists, credential isolation, execution limits, configuration validation, approval gates, and monitoring of the agent's behavior.
Evidence-Based Reasoning
Require the agent to reference actual tool results and distinguish observed facts from inferred explanations. Missing evidence must remain explicitly unknown.
Governed Execution
Use deterministic validation and authorization systems to decide whether a requested network operation may execute. Model confidence alone is insufficient authorization.
6.9 Production AI Network Agent Checklist
AI Agents Coordinate Network Tools; Security Controls Govern Execution
AI-assisted network automation combines model reasoning, structured telemetry, CLI and API integration, investigation workflows, independent authorization, and engineering verification to support network operations. The most reliable implementations separate flexible AI reasoning from deterministic network control and require explicit safeguards before changing production infrastructure.
Agentic Network Automation Workflow Lab
Investigate how an AI operations agent discovers network state, invokes diagnostic tools, builds an action plan, evaluates policy and executes controlled automation.
BGP Neighbor Failure
Operational policy controls
Tool call and response
Agent event timeline
AI operational assessment
Autonomous Network Remediation
Autonomous network remediation combines network telemetry, incident analysis, policy-controlled automation, and post-change verification to help restore network services after operational failures.
Traditional network operations typically separate monitoring from remediation. A monitoring platform generates an alert, engineers investigate the incident, and an authorized operator executes the required changes.
Closed-loop automation connects these activities into a coordinated process. The system observes network state, evaluates a problem, selects an approved response, executes the response when authorized, and measures whether the network returned to its intended condition.
AI can assist with incident interpretation and remediation selection, but the execution of network changes should remain governed by explicit policies, authorization controls, and deterministic validation.
7.1 The Closed-Loop Remediation Architecture
The fundamental difference between monitoring and closed-loop automation is the feedback mechanism. The system does not stop after producing an alert or executing a command. It evaluates the resulting network state.
Observe
Collect telemetry, routing state, and service metrics.
Analyze
Correlate events and evaluate incident hypotheses.
Authorize
Apply policies, safety checks, and approval gates.
Execute
Perform a permitted recovery operation through automation.
Verify
Measure resulting network state and service health.
Conceptual architecture. Verification failure should trigger a bounded recovery or escalation workflow, not unlimited repeated changes.
7.2 Levels of Network Automation and Autonomy
Not every AIOps implementation requires fully autonomous configuration changes. Different operational tasks may use different autonomy levels.
| Operating Model | System Responsibility | Engineer Responsibility |
|---|---|---|
| Manual Operations | Collects alerts and monitoring information. | Investigates and executes recovery. |
| Assisted Investigation | Correlates evidence and recommends diagnostic steps. | Validates findings and selects actions. |
| Human-Approved Remediation | Prepares a bounded remediation plan. | Reviews and authorizes execution. |
| Policy-Governed Automation | Executes explicitly preauthorized, validated recovery actions. | Defines policy, monitors outcomes, and handles exceptions. |
| Higher-Autonomy Operations | Coordinates a wider set of bounded actions and verification workflows. | Maintains governance, operational limits, and escalation authority. |
Autonomy should be assigned according to the operational risk of the task. Collecting interface counters is different from changing BGP policy, withdrawing routes, or modifying firewall rules.
7.3 The Six Stages of a Controlled Recovery
Detect
Confirm the operational problem.
Diagnose
Identify likely causes and dependencies.
Validate
Assess proposed action and policy compliance.
Execute
Apply the authorized recovery action.
Verify
Check routing, forwarding, and service health.
Recover
Roll back or escalate if objectives fail.
Rollback is conditional. Successful recovery proceeds to monitoring and incident closure; unsuccessful recovery requires controlled rollback or escalation.
7.4 Engineering Scenario: SD-WAN Path Failure
Consider an enterprise branch connected to a data centre through two WAN transports: an MPLS circuit and an Internet-based encrypted overlay.
The primary MPLS transport experiences a connectivity failure. An SD-WAN controller detects the degraded path and may redirect eligible traffic toward a healthy alternative, according to configured application and security policies.
Branch Edge
Enterprise branch
SD-WAN Fabric
Policy-controlled overlay
Data Centre
Application services
Conceptual topology. Traffic migration requires a usable alternate path, appropriate tunnel establishment, valid routing, sufficient capacity, and applicable security policies.
AIOps can add contextual analysis around this recovery. For example, it can correlate transport alarms, confirm that the alternate tunnel is healthy, evaluate application performance, and determine whether further engineering intervention is required.
The underlying SD-WAN controller may already perform deterministic path failover without AI. AI-driven remediation should complement those existing mechanisms rather than duplicate or destabilize them.
7.5 Illustrative Remediation Decision
This example assumes the organization has explicitly preauthorized the path-selection behavior and that the controller has verified the alternate path against its configured policies.
If the alternate transport were unhealthy or failed application requirements, the appropriate response would be escalation, not an unsupported claim of successful remediation.
7.6 Remediation Actions and Their Operational Risk
Observation Actions
Collect counters, inspect routes, review alarms, and validate service reachability.
Policy-Controlled Actions
Select approved alternate paths, apply bounded traffic engineering, or execute validated recovery workflows.
High-Impact Changes
Modify BGP policy, change firewall rules, disable interfaces, or alter routing infrastructure.
The same remediation action may have different risks depending on the device, network segment, traffic dependencies, and time of execution.
7.7 Verification and Rollback Engineering
Executing a configuration change does not prove that the network has recovered. A closed-loop system must evaluate the actual outcome.
Post-Change Verification
Confirm expected routing state, forwarding reachability, application performance, security policy compliance, and absence of new service-impacting symptoms.
Rollback and Escalation
Restore a validated prior configuration when safe, or escalate when rollback could worsen the incident. Recovery procedures must account for concurrent changes and current state.
Rollback is not always a simple reversal. Routing changes, stateful firewall sessions, distributed controllers, and concurrent operations can complicate recovery.
Systems should maintain versioned configuration state, transaction identifiers, execution logs, and explicit recovery procedures.
7.8 Preventing Unsafe Automation Loops
Closed-loop automation can introduce instability if a system repeatedly changes network state in response to noisy measurements.
Hysteresis and Hold-Down
Require sustained conditions before triggering changes and prevent rapid oscillation between paths.
Execution Limits
Bound retry counts, change frequency, affected devices, and maximum automation scope.
Escalation Conditions
Stop automation when verification fails, evidence conflicts, or operational limits are exceeded.
7.9 Production Autonomous Remediation Checklist
Autonomous Remediation Requires a Verified Feedback Loop
Closed-loop network operations combine telemetry, incident diagnosis, policy-governed execution, post-change verification, and controlled recovery to support reliable network remediation. AI may assist with analysis and action selection, but operational safety depends on independent authorization, bounded automation, accurate network-state validation, and clearly defined escalation procedures.
Closed-Loop Network Remediation Simulator
Explore the complete autonomous network remediation lifecycle: detect, diagnose, decide, authorize, execute, verify and continuously monitor.
BGP Neighbor Failure
Network state comparison
Safety and failure controls
Remediation event timeline
Structured remediation record
Engineering interpretation
AI Network Troubleshooting and Security
AI-assisted network troubleshooting combines infrastructure telemetry, routing information, traffic analysis, firewall events, and security context to help engineers investigate complex connectivity and security incidents.
Traditional network troubleshooting often requires engineers to move between routing tables, interface counters, firewall logs, packet captures, and monitoring platforms.
Each source provides only part of the operational picture. A routing table may show that a destination is reachable, while a firewall policy prevents application traffic from completing successfully.
AI-assisted investigation can organize these observations, identify inconsistencies, propose diagnostic hypotheses, and help engineers select the next appropriate verification step.
8.1 The AI Network Investigation Architecture
An effective investigation integrates evidence from multiple network layers and security controls.
Collect
Gather routing, firewall, flow, and security events.
Normalize
Align device, session, timestamp, and policy context.
Correlate
Connect relevant events across network layers.
Investigate
Evaluate root cause and security hypotheses.
Respond
Recommend checks, escalate, or request approved action.
Conceptual architecture. AI-generated findings must be supported by verifiable telemetry and authorized diagnostic tools.
8.2 Network and Security Evidence Sources
Routing and Forwarding
BGP and OSPF state, routing tables, forwarding entries, next-hop reachability, and route-policy results.
Firewall Policy
Rule matches, session state, security zones, NAT translations, and traffic-denial events.
Network Flow Records
Source and destination addresses, ports, protocol identifiers, traffic volumes, and flow timing.
Threat Detection
IDS and IPS alerts, suspicious connection patterns, and security detection metadata.
Network Telemetry
Interface counters, queue metrics, latency, packet loss, and network performance trends.
Identity and Access
Authentication failures, device identity, access decisions, and relevant authorization events.
8.3 Engineering Scenario: Application Connectivity Failure
Consider a user attempting to reach an application hosted in a protected data centre network.
The client can reach its default gateway, the network has a valid route toward the server, and the destination service is operational.
However, the connection fails because a firewall policy denies the application traffic.
Client
10.10.10.25
Edge Router
Valid route
Firewall
Policy deny
Application
10.20.20.50
Illustrative traffic path. The firewall rejects the relevant connection according to its configured security policy. The diagram does not imply that denied packets reach the application server.
This example demonstrates why routing reachability and application connectivity must be investigated separately.
A valid route does not guarantee that traffic passes access-control rules, NAT processing, stateful inspection, or application security controls.
8.4 Correlating the Incident Evidence
Client 10.10.10.25 attempts to connect to 10.20.20.50 on TCP port 443.
The relevant forwarding lookup identifies a next hop toward the protected network.
A matching firewall log records the denied TCP connection attempt.
The client-side monitor reports a failed application connection.
The investigation links the failed connection to the matching firewall deny event.
Synthetic timestamps and events for educational purposes. Actual collection timing and event availability vary by platform.
8.5 Illustrative AI-Assisted Troubleshooting Output
The matching firewall denial provides strong evidence explaining the failed connection attempt.
It does not establish that the firewall rule is incorrect. The policy may be intentionally enforcing network segmentation or access restrictions.
8.6 Operational Failure vs Security Threat
AIOps systems must avoid treating every unusual network event as a security attack.
| Observation | Possible Operational Explanation | Possible Security Explanation |
|---|---|---|
| Unusual Traffic Increase | Backup, software deployment, or workload migration. | Traffic flooding or unauthorized data movement. |
| Repeated Firewall Denials | Incorrect application configuration or outdated access request. | Unauthorized connection attempts or scanning. |
| BGP Route Changes | Maintenance, convergence, or routing-policy modification. | Potential unauthorized routing change or route hijack. |
| Authentication Failures | Expired credentials or automation misconfiguration. | Credential guessing or unauthorized access attempts. |
| Unexpected East-West Traffic | New application dependency or service discovery. | Possible lateral movement or policy violation. |
Accurate classification requires operational context, validated detection logic, and independent evidence.
8.7 AI-Assisted Network Security Investigation
Suspicious Traffic Correlation
Compare unusual flows, security alerts, device behavior, and network context to prioritize investigation.
Segmentation Verification
Examine whether observed communication patterns align with intended network security zones and access policies.
Policy Investigation
Correlate firewall rule matches, configuration changes, and application connectivity failures.
Routing Security Analysis
Investigate unexpected route advertisements, origin changes, policy violations, and reachability anomalies.
Incident Context Enrichment
Combine topology, asset importance, service ownership, and verified threat intelligence.
Response Coordination
Prepare investigation summaries, escalation recommendations, and evidence-backed response proposals.
8.8 Security Boundaries for AI Troubleshooting Agents
Network investigation tools may expose sensitive operational information, including configurations, internal addresses, credentials, and security policy details.
AI-assisted troubleshooting systems should enforce access restrictions and data-handling policies independently of the model's generated reasoning.
Controlled Read-Only Access
Restrict investigation tools to authorized devices, telemetry sources, commands, and data scopes. Apply redaction where sensitive information is not required.
Restricted Security Changes
Firewall policy modifications, host isolation, routing changes, and access-control updates require independent authorization and appropriate verification.
Prompt Injection Resistance
Treat device logs, retrieved documentation, external intelligence, and tool output as untrusted data, not executable instructions.
Investigation Audit Trail
Preserve evidence sources, timestamps, tool calls, analyst decisions, and response approvals for later review.
8.9 Production AI Troubleshooting Checklist
AI Troubleshooting Connects Network Evidence with Security Context
AI-assisted network investigation combines routing state, firewall policy, traffic telemetry, security events, topology relationships, and evidence-based reasoning to help engineers diagnose complex incidents. Reliable implementations distinguish operational failures from potential security threats, preserve policy intent, and require independently authorized responses.
AI Network Incident Investigation Console
Investigate routing, security and performance incidents using CLI evidence, telemetry, packet-path analysis and structured root-cause hypotheses.
BGP Route Loss
Diagnostic command library
Select a diagnostic command to collect evidence.
Root-cause hypotheses
CLI and telemetry evidence
Investigation evidence record
AI-assisted assessment
Production AIOps Reference Architecture
A production AIOps platform integrates network infrastructure, telemetry pipelines, operational data stores, AI analytics, incident management, automation systems, and independently enforced governance controls.
Individual AI capabilities such as anomaly detection, event correlation, and network troubleshooting provide value on their own.
However, enterprise AIOps requires these capabilities to operate as parts of a coherent architecture.
Telemetry must be trustworthy, incident analysis must be explainable, automation must be authorized, and recovery must be verified against actual network and service conditions.
9.1 Seven-Layer Enterprise AIOps Architecture
The following reference design illustrates the major architectural responsibilities of an enterprise AIOps platform.
Network Infrastructure
Routers, switches, firewalls, SD-WAN edges, cloud networks, load balancers, and application services.
Telemetry and Collection
gNMI, SNMP, syslog, flow telemetry, controller APIs, configuration state, and active service measurements.
Data Processing and Storage
Event streaming, normalization, enrichment, time-series databases, event stores, topology and inventory context.
AI Analytics and Correlation
Dynamic baselines, anomaly detection, predictive models, event correlation, and evidence-backed incident hypotheses.
Agent and Decision Orchestration
Investigation workflows, tool selection, incident context, proposed recovery plans, and policy evaluation.
Automation and Execution
Approved CLI and API operations, network controllers, configuration automation, and bounded remediation.
Verification and Operations
Post-change telemetry, service probes, routing validation, audit records, rollback procedures, and incident closure.
Logical reference architecture. Telemetry feedback flows from the network back into the analytics platform. Governance applies across all operational layers.
9.2 Separating the Network Data, Control, and Management Planes
Enterprise AIOps must respect the distinction between packet forwarding, routing decisions, and infrastructure management.
| Plane | Primary Responsibility | AIOps Interaction |
|---|---|---|
| Data Plane | Forwards packets according to installed forwarding state. | Observes traffic, packet loss, forwarding behavior, and service performance. |
| Control Plane | Maintains routing, signaling, and protocol state. | Analyzes BGP, OSPF, route convergence, neighbor status, and routing anomalies. |
| Management Plane | Provides configuration, monitoring, and administrative interfaces. | Uses approved APIs, telemetry interfaces, controllers, and automation tools. |
| AIOps Decision Layer | Analyzes evidence and coordinates operational workflows. | Produces investigation findings and requests independently authorized actions. |
AIOps generally interacts through management and monitoring interfaces. It may influence control-plane behavior through authorized configuration changes, but should not bypass device control mechanisms or established operational policies.
9.3 Production Telemetry and Data Architecture
Telemetry Ingestion
Collect device state, logs, flows, and service metrics with appropriate transport security, authentication, and collection resilience.
Streaming and Processing
Normalize records, handle duplicate events, align timestamps, and enrich observations with topology and device context.
Operational Data Stores
Maintain suitable storage for time-series metrics, logs, incident events, configuration snapshots, and topology relationships.
Data quality directly affects the reliability of AI analysis. Incorrect timestamps, missing interfaces, stale topology information, or inconsistent device identifiers can produce misleading correlations.
9.4 AI Analytics and Incident Intelligence
Anomaly Detection
Compare observed network behavior with statistical or learned baselines. Identify deviations requiring investigation.
Event Correlation
Relate alarms, topology dependencies, routing changes, and service symptoms to develop supported incident hypotheses.
Predictive Analytics
Estimate emerging capacity, performance, or reliability risks using historical patterns and current observations.
These analytical capabilities are complementary. Anomaly detection identifies unexpected behavior. Event correlation provides operational context. Predictive analytics estimates potential future conditions.
None of these capabilities independently guarantees a correct root cause or a safe remediation action.
9.5 End-to-End AIOps Incident Lifecycle
Observe
Collect live operational evidence.
Detect
Identify abnormal or failed conditions.
Correlate
Connect relevant incident signals.
Decide
Evaluate hypotheses and policies.
Act
Execute approved recovery actions.
Verify
Validate service and network recovery.
Not every incident requires automation. The workflow may end with a diagnostic recommendation or engineer escalation. Failed verification triggers controlled recovery or escalation.
9.6 Engineering Scenario: BGP Failure Across the AIOps Stack
Consider an enterprise network where an eBGP neighbor session transitions from Established to Idle following a transport failure.
The incident may generate multiple related observations: a physical interface alarm, a BGP neighbor-down event, route withdrawals, and application reachability degradation.
An AIOps platform can correlate these observations using device identity, timestamps, topology, and routing dependencies.
This incident demonstrates why AI analysis must consider infrastructure dependencies.
Restarting BGP may not resolve a physical transport failure. A more useful response is to identify the failed dependency, inspect available alternate paths, and verify service-level impact.
9.7 Agent Orchestration and Automation Integration
AI agents can coordinate investigation workflows across multiple operational systems, but should use bounded, authorized tools.
Network Controllers
Integrate with SD-WAN, cloud networking, network management, and configuration automation platforms.
AI Tool Integration
Use approved tool adapters and MCP interfaces where appropriate to expose controlled operational capabilities.
Policy Enforcement
Validate permissions, execution scope, change approvals, and operational safety conditions.
An agent may recommend a routing-policy adjustment or select an investigation tool, but independent control systems should determine whether the requested operation is permitted.
9.8 Production Reliability and Security Engineering
High Availability and Resilience
Design resilient collectors, message processing, storage, and orchestration services. Monitor data gaps, ingestion delays, and failed dependencies.
Identity and Data Security
Enforce least privilege, network segmentation, encryption, secrets management, data minimization, and secure tool execution.
AI Evaluation and Monitoring
Test detection accuracy, false positives, reasoning quality, tool selection, model drift, and operational failure cases.
Auditability and Change Control
Preserve evidence, decision records, approval history, configuration snapshots, execution logs, and recovery outcomes.
9.9 Production AIOps Deployment Checklist
Production AIOps Is an Integrated Network Operations Architecture
Enterprise AIOps combines network telemetry, data engineering, anomaly detection, event correlation, predictive analytics, AI agents, policy-controlled automation, and closed-loop verification into a coordinated operational platform. Its value comes not simply from applying AI to network events, but from connecting trustworthy evidence to secure, measurable, and verifiable engineering decisions.
Enterprise AIOps Architecture Builder
Design a production-style AI-driven network operations platform. Configure telemetry, analytics, AI agents, automation and governance, then validate architectural dependencies and operational readiness.
Architecture component builder
Enable or disable components to explore how architecture dependencies affect incident detection, diagnosis and remediation.
Architecture readiness
Architecture validation
Incident processing pipeline
Deployment blueprint
Engineering recommendations

- AI-Driven Network Operations and AIOps Explained - November 14, 2026
- MCP Architecture Explained - November 14, 2026
- Google Cloud AI Architecture Explained - November 14, 2026