
SD WAN Overlay In today’s digital age, businesses rely on seamless and secure network connectivity to support their operations. Traditional Wide Area Network (WAN) architectures often struggle to meet the demands of modern companies due to their limited bandwidth, high costs, and lack of flexibility. A revolutionary SD-WAN (Software-Defined Wide …
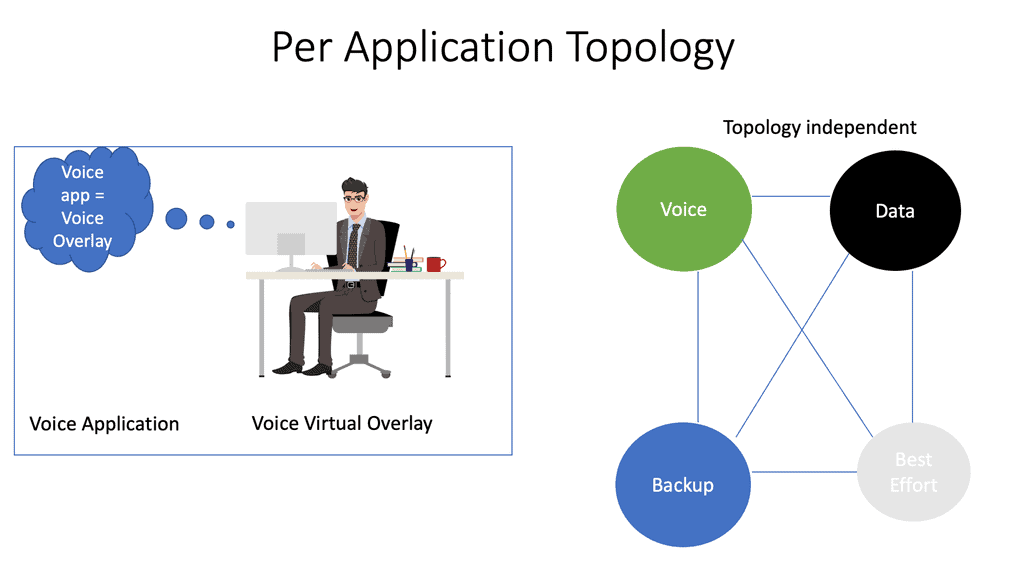
SD WAN Tutorial In the ever-evolving landscape of networking technology, SD-WAN has emerged as a powerful solution that revolutionizes the way businesses connect and operate. This blog post delves into the world of SD-WAN, exploring its key features, benefits, and the impact it has on modern networks. SD-WAN, which stands …
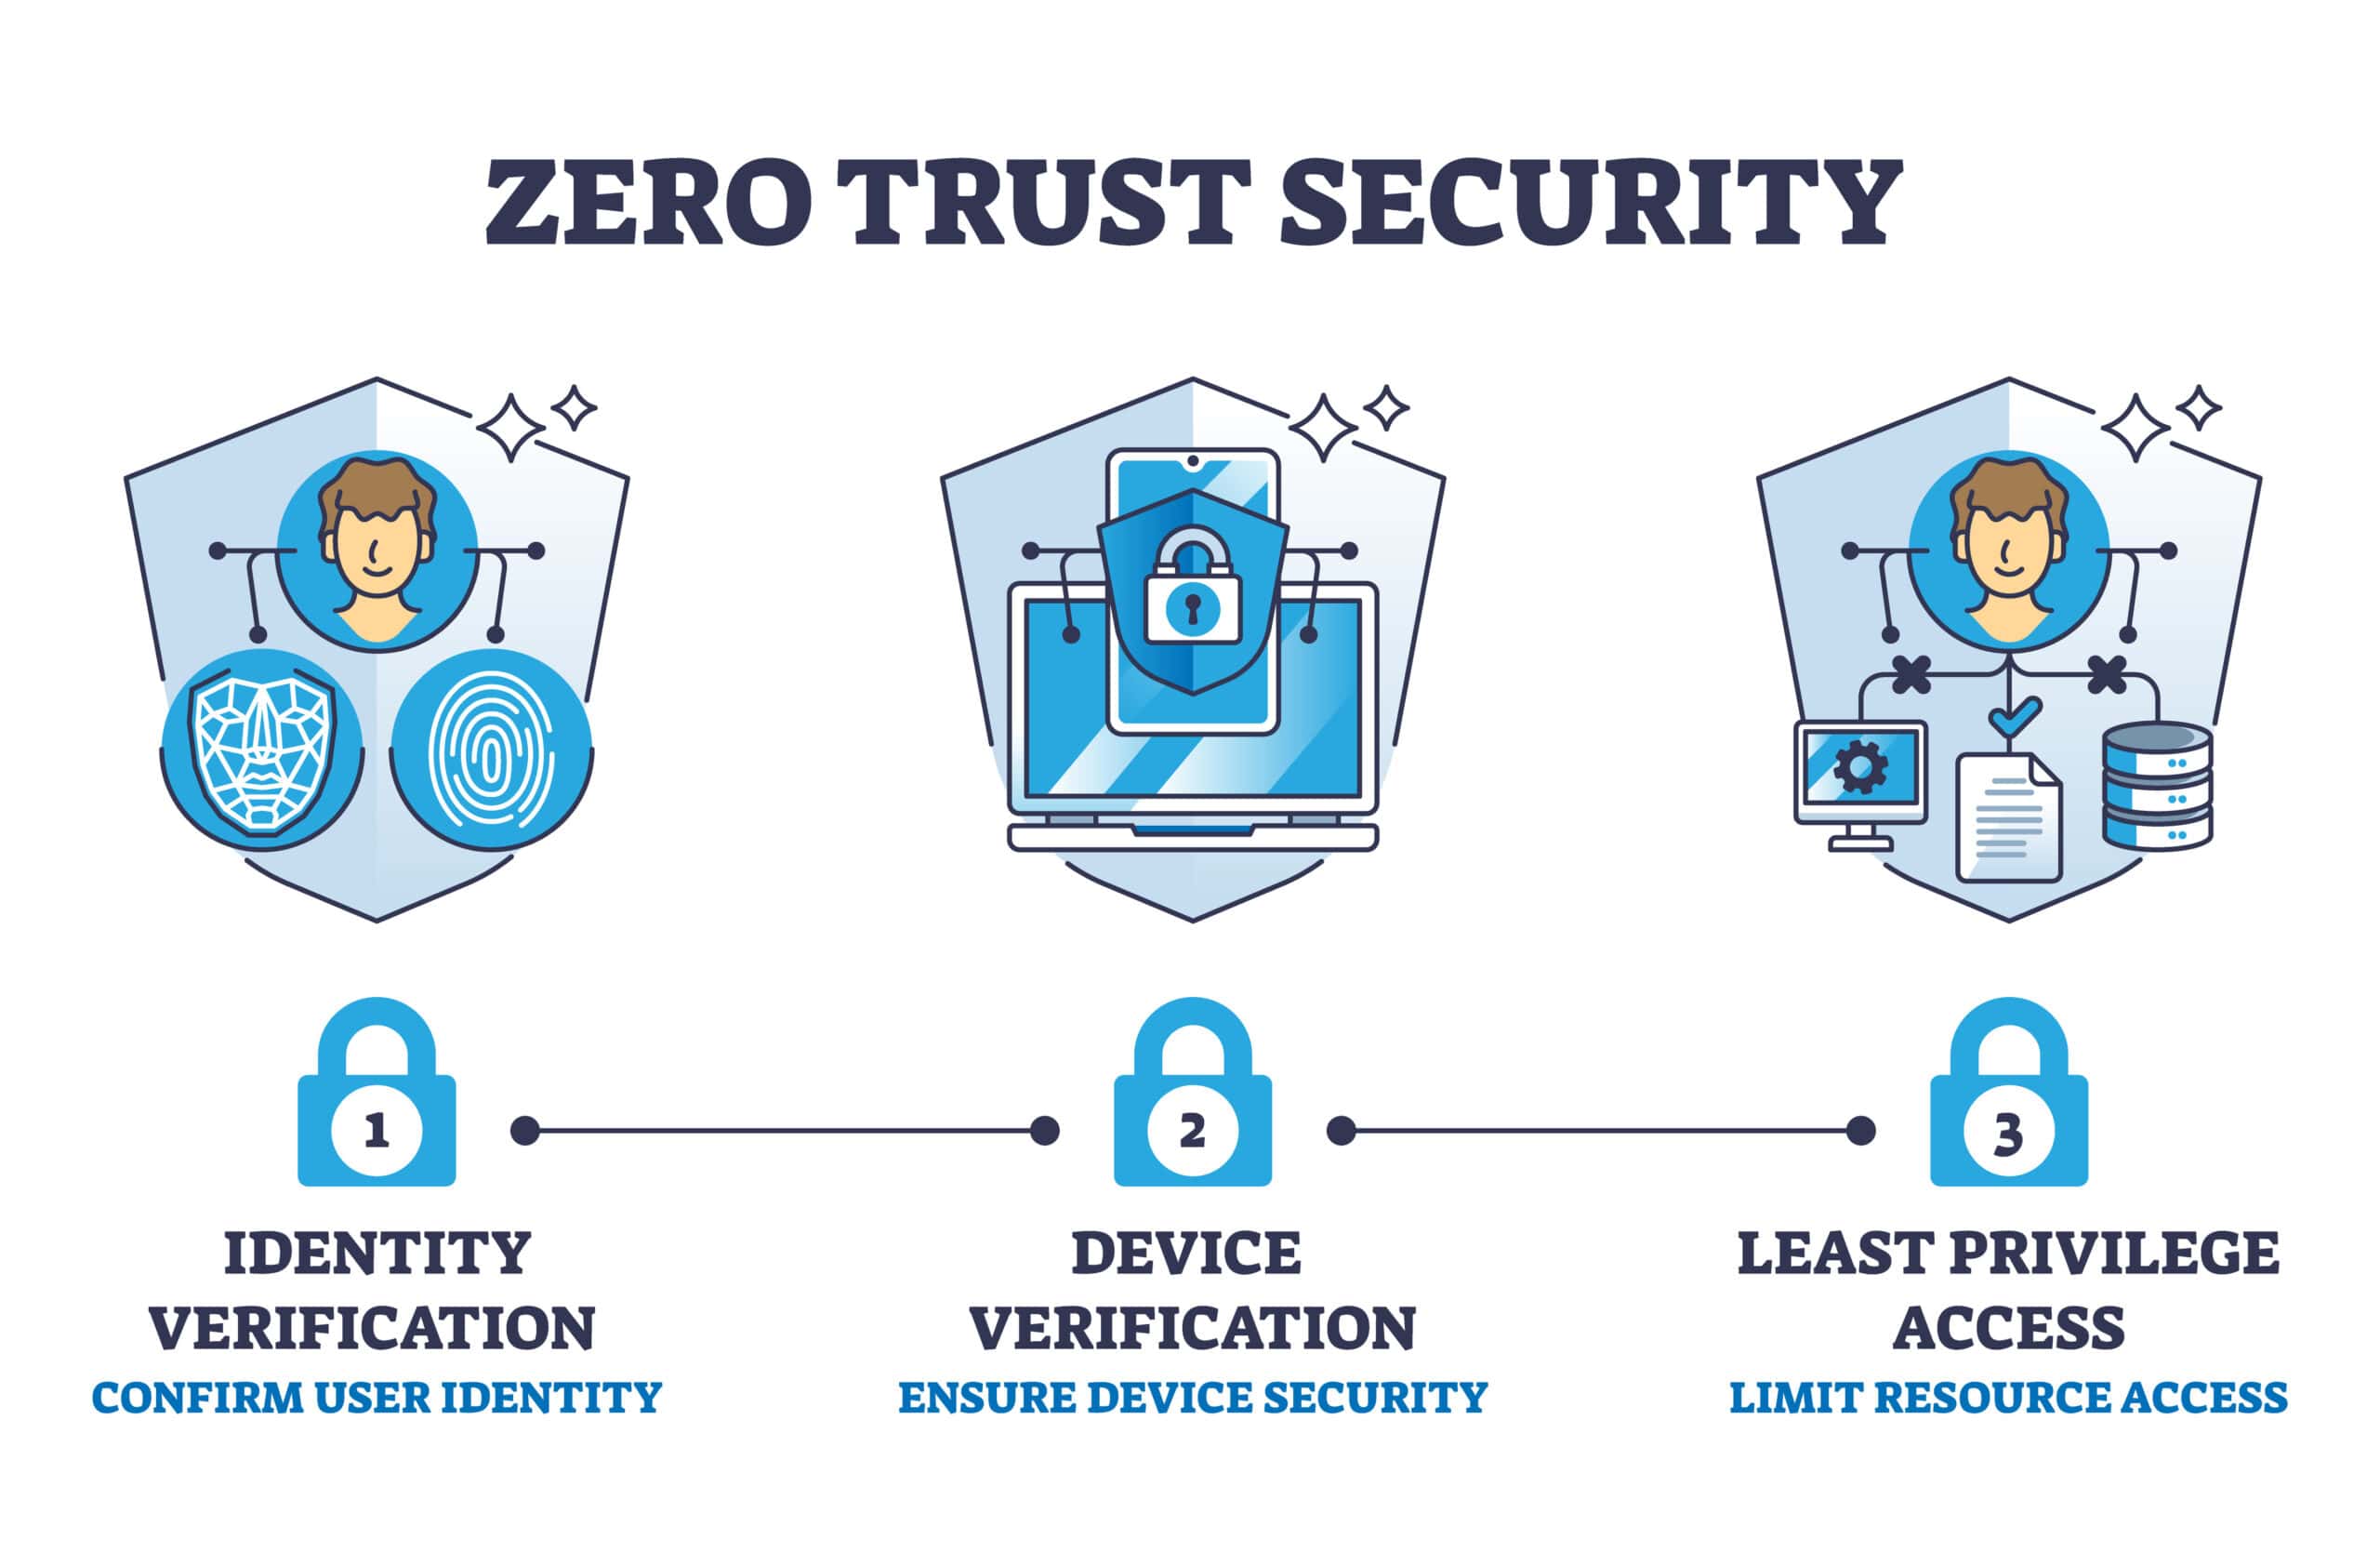
Zero Trust Network Design In today’s interconnected world, where data breaches and cyber threats have become commonplace, traditional perimeter defenses are no longer enough to protect sensitive information. Enter Zero Trust Network Design is a security approach that prioritizes data protection by assuming that every user and device, inside or …
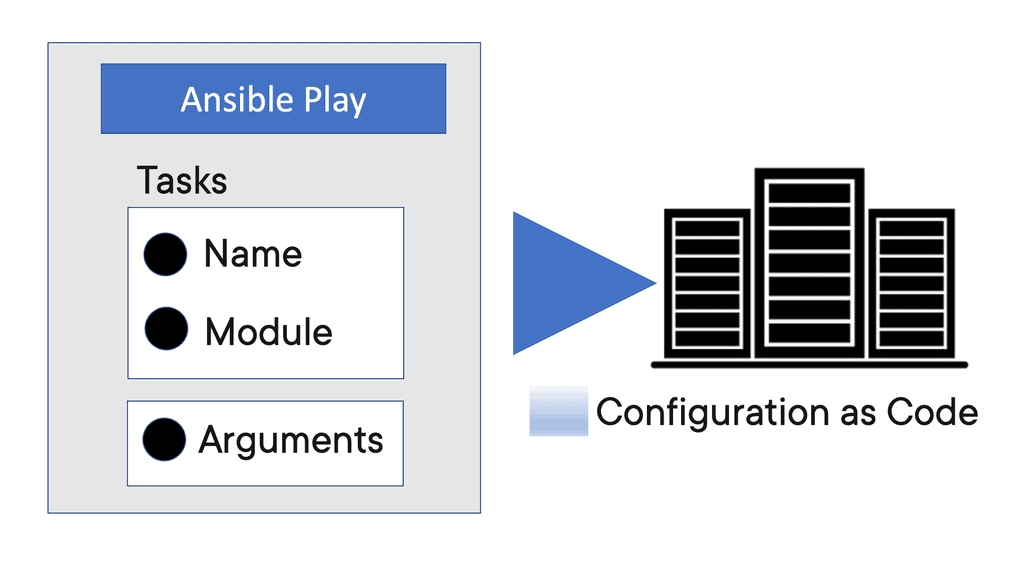
Ansible Variable Ansible, the powerful automation tool, offers a wide range of features to simplify IT infrastructure management. One such feature is the use of variables, which allow for dynamic and flexible configurations. In this blog post, we will dive deep into the world of Ansible variables and explore how …
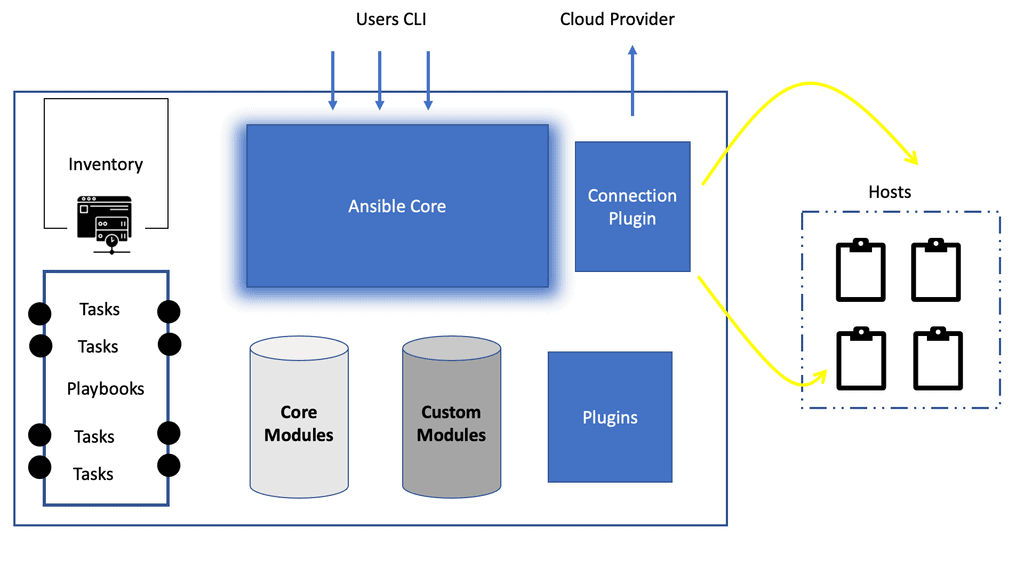
Ansible Architecture When it comes to managing and automating IT infrastructure, Ansible has gained immense popularity. Its simplicity and flexibility make it an ideal choice for sysadmins, developers, and IT professionals alike. In this blog post, we will delve into the intricate architecture of Ansible, understanding its key components and …
OpenShift SDN In the world of networking, Openshift SDN stands out as a powerful and innovative solution. With its cutting-edge features and flexible architecture, it has revolutionized the way we approach software-defined networking. In this blog post, we will dive deep into Openshift SDN, exploring its key components, benefits, and …
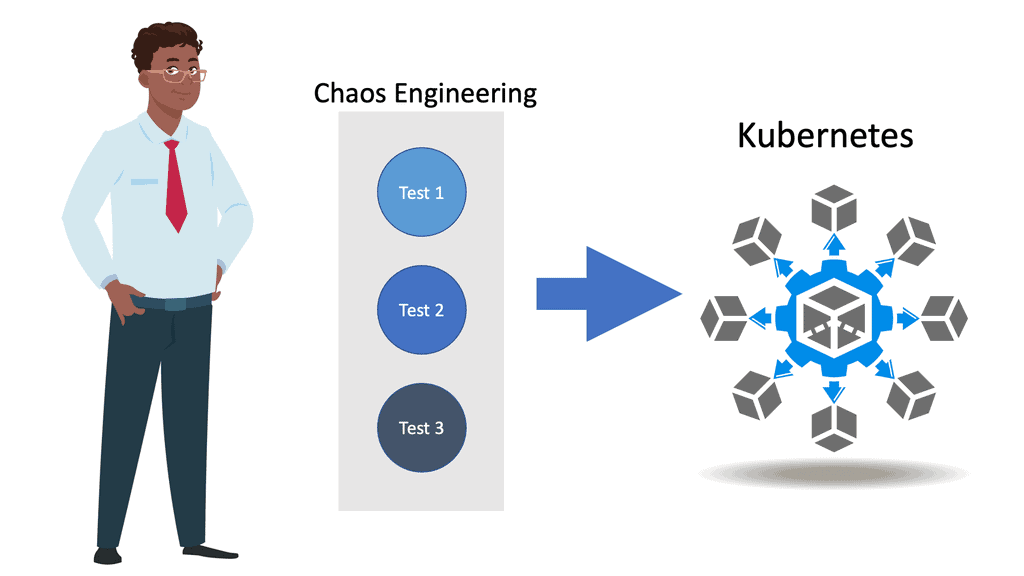
Chaos Engineering Kuberentes In the ever-evolving world of Kubernetes, maintaining system reliability is of paramount importance. Chaos Engineering has emerged as a powerful tool to proactively identify and address weaknesses in distributed systems. In this blog post, we will explore the concept of Chaos Engineering and its application in the …

Docker Container Security In the vast ocean of software development, Docker has emerged as a powerful tool for containerization. With its ability to package applications and their dependencies into self-contained units, Docker offers enhanced portability and scalability. However, as with any technology, security considerations are paramount. In this blog post, …
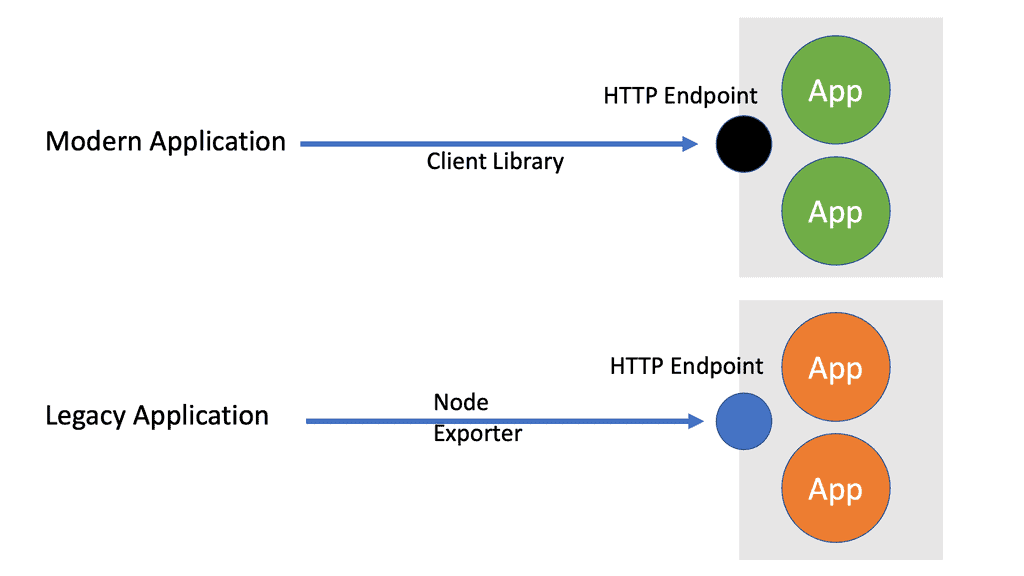
Prometheus Metric Types Prometheus, the popular open-source monitoring and alerting toolkit, offers a wide range of metric types to collect and analyze data. In this blog post, we will delve into the various Prometheus metric types, their features, and use cases. Whether you’re a beginner or an experienced Prometheus user, …

Prometheus Monitoring: The Pull Approach In the world of monitoring and observability, Prometheus has emerged as a powerful tool for collecting and analyzing metrics. One of the key aspects of Prometheus is its unique approach to data collection, known as the pull approach. In this blog post, we will explore …

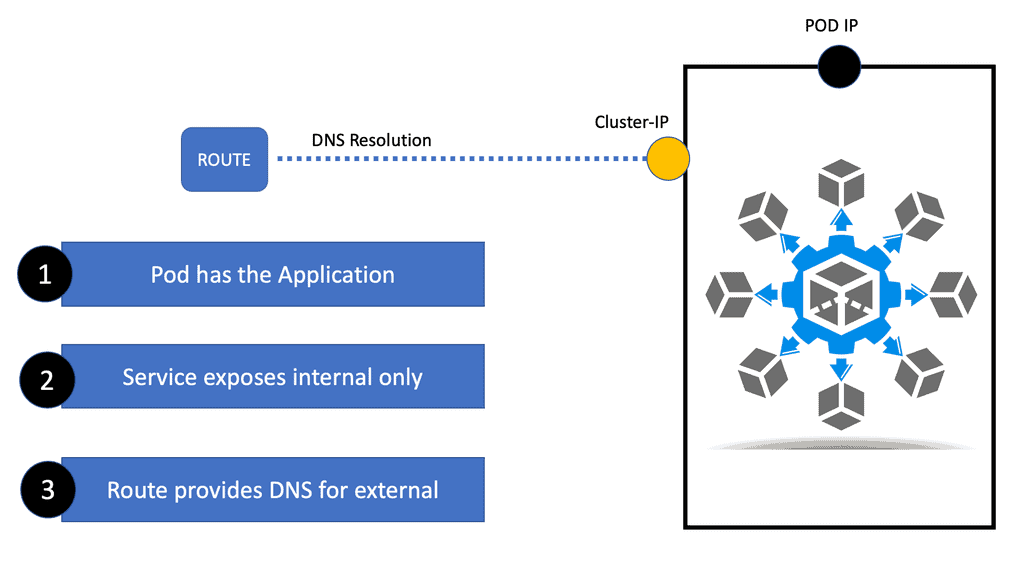
Starting Observability Openshift Networking is a fundamental aspect of managing and orchestrating containerized applications within the Openshift platform. In this blog post, we will embark on a journey to explore the intricacies of Openshift Networking, shedding light on its key components and functionalities. Openshift Networking operates on the concepts of …

OpenShift Networking OpenShift, developed by Red Hat, is a leading container platform that enables organizations to streamline their application development and deployment processes. With its robust networking capabilities, OpenShift provides a secure and scalable environment for running containerized applications. This blog post will explore the critical aspects of OpenShift networking …