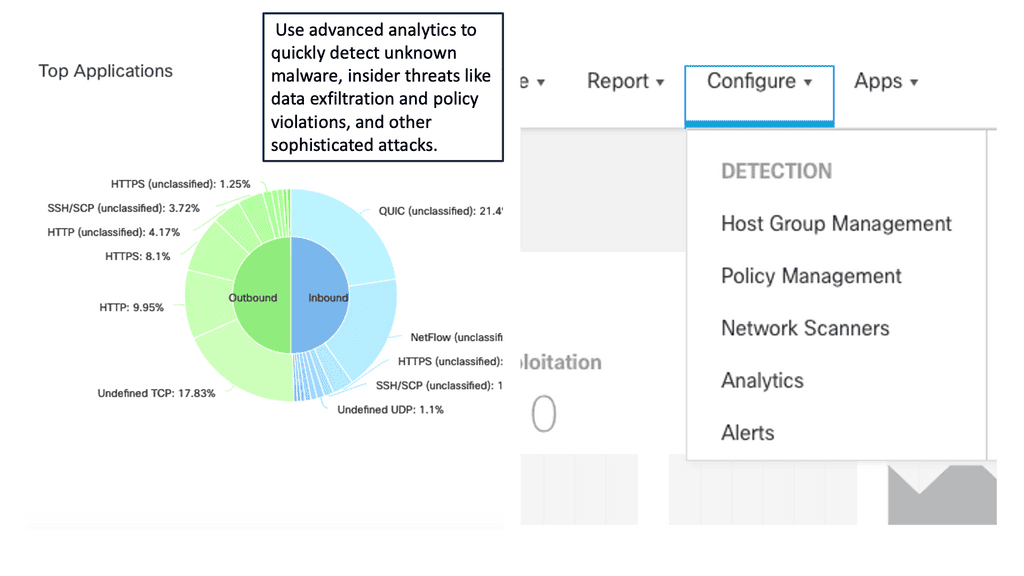
Network Visibility
In today's interconnected world, where digital operations are the backbone of businesses, network visibility plays a crucial role in ensuring seamless connectivity, robust security, and optimal performance. This blog explores the significance of network visibility and how it empowers organizations to stay ahead in the ever-evolving technological landscape.
Network visibility refers to the ability to gain comprehensive insights into every aspect of a network infrastructure. It involves capturing, analyzing, and interpreting network data to obtain a clear picture of traffic patterns, device behavior, and potential threats. By having complete visibility into their networks, organizations can proactively address issues, optimize performance, and make informed decisions.
Enhanced Security: Network visibility serves as a powerful security tool, enabling organizations to detect and mitigate potential threats in real-time. By monitoring network traffic, identifying anomalies, and analyzing patterns, security teams can swiftly respond to cyberattacks, prevent data breaches, and safeguard critical assets.
Proactive Troubleshooting: With network visibility, IT teams can proactively identify and resolve network issues before they impact operations. By monitoring performance metrics, analyzing network data, and leveraging predictive analytics, organizations can optimize network resources, minimize downtime, and ensure a seamless user experience.
Advanced Monitoring Solutions: Effective network visibility requires robust monitoring solutions that capture and analyze network data in real-time. Advanced tools like network packet brokers, flow collectors, and intrusion detection systems enable organizations to collect and aggregate network data, providing a holistic view of their infrastructure.
Data Visualization and Analytics: Data visualization and analytics tools play a vital role in transforming raw network data into actionable insights. By presenting complex data in intuitive dashboards and reports, organizations can quickly identify trends, pinpoint bottlenecks, and make data-driven decisions to optimize network performance.
Defining Clear Objectives: Before implementing network visibility solutions, organizations should define their specific objectives and requirements. This involves identifying key performance indicators, security priorities, and desired outcomes to tailor the visibility strategy accordingly.
Continuous Monitoring and Analysis: Network visibility is an ongoing process. Organizations should establish a robust monitoring framework to continuously capture and analyze network data. Regular audits, performance assessments, and threat intelligence updates ensure that network visibility remains effective and up-to-date.
Network visibility is no longer a luxury but a necessity in today's digital landscape. It empowers organizations to proactively protect their networks, optimize performance, and make informed decisions. By embracing network visibility solutions and following best practices, businesses can unlock the full potential of their network infrastructure, gaining a competitive edge in the ever-evolving technology landscape.Matt Conran
Highlights: Network Visibility
Understanding Network Visibility
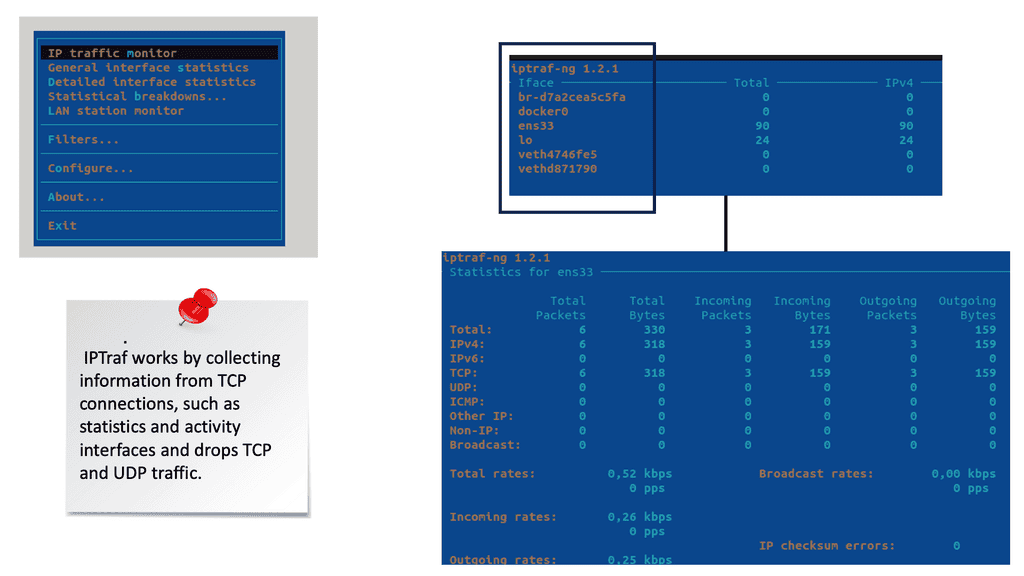
Network visibility can be defined as the ability to monitor and analyze network traffic, allowing organizations to gain deep insights into their network infrastructure. It involves collecting, aggregating, and analyzing data from various network devices and endpoints, providing a comprehensive view of network operations.
**Achieving Effective Network Visibility**
Implementing network visibility requires careful planning and strategic execution. This section highlights some key strategies to consider:
1. Deploying Monitoring Tools: Utilize advanced monitoring tools that offer comprehensive visibility into network traffic, including bandwidth utilization, application performance, and user behavior.
2. Traffic Analysis and Packet Inspection: Leverage traffic analysis and packet inspection techniques to gain granular insights into network behavior, identify anomalies, and detect potential security threats.
3. Network Segmentation: Implement segmentation to divide the network into smaller, more manageable segments. This allows for better control, improved performance, and easier identification of issues within specific segments.
Network Performance
One key consideration of network visibility is its role in optimizing network performance. With real-time monitoring and analysis, organizations can identify bottlenecks, latency issues, or abnormal behavior that might impact performance. This allows for timely troubleshooting and ensures that potential problems are addressed proactively, minimizing downtime and maximizing productivity.
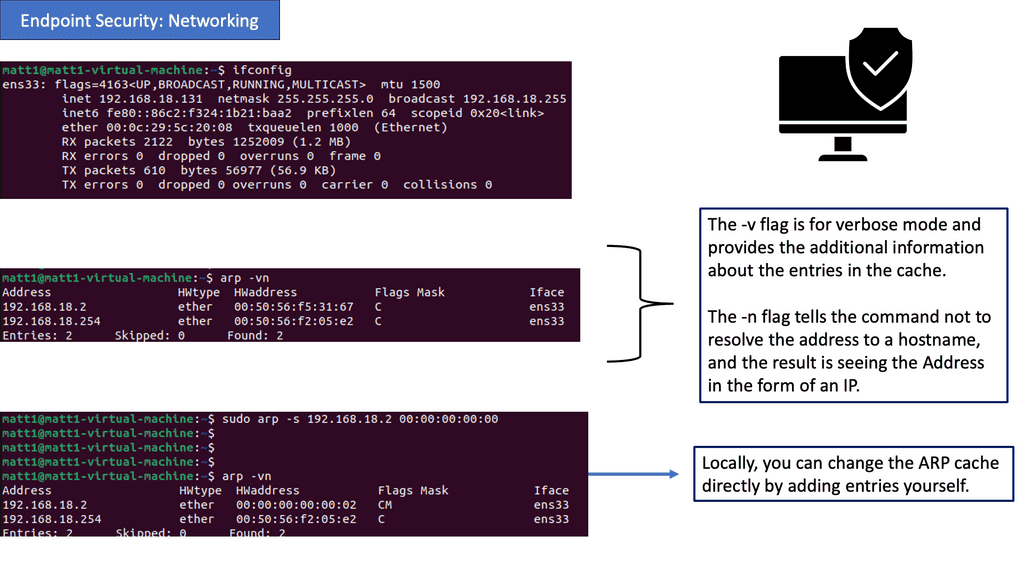
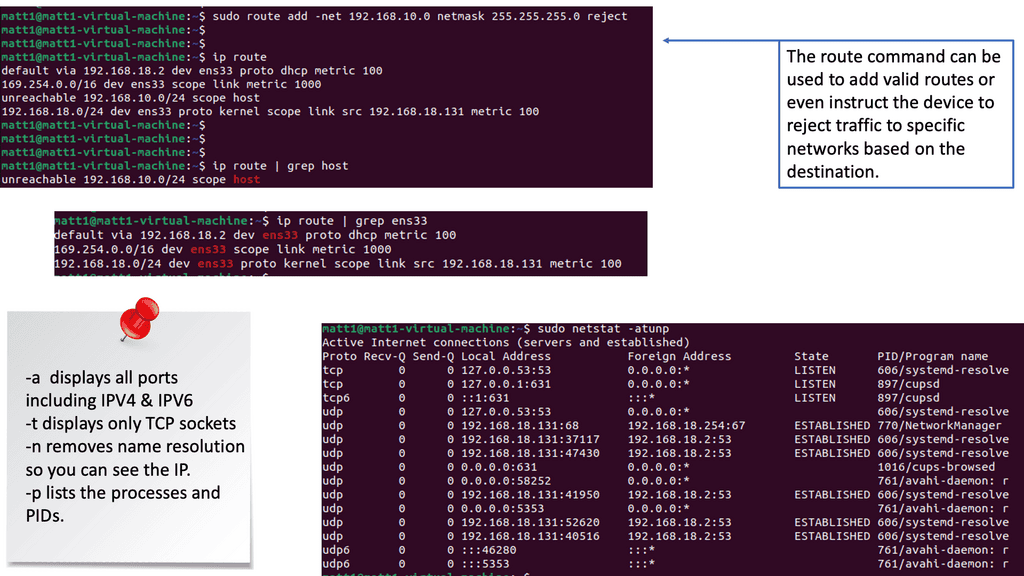
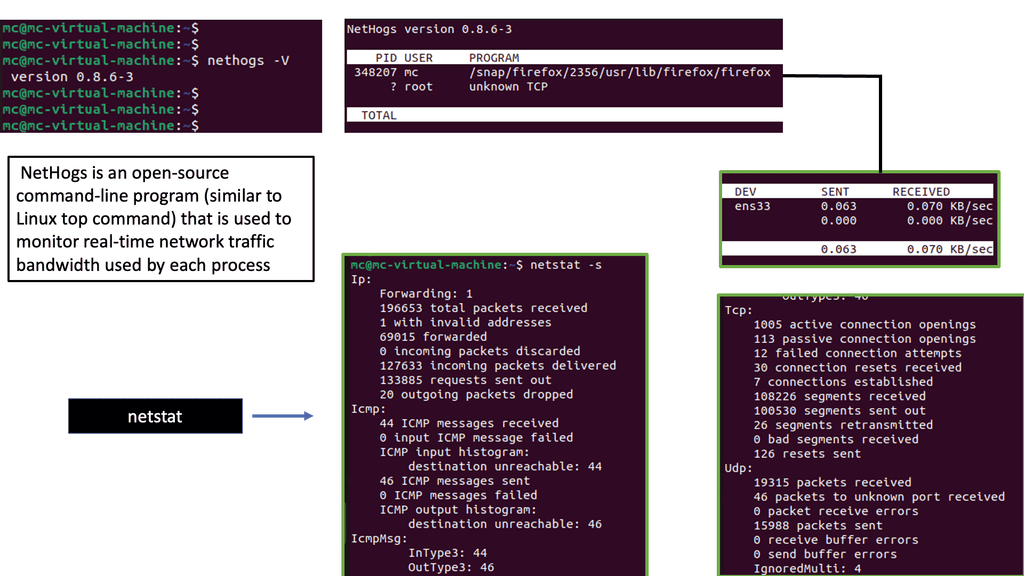
Netstat Analysis:
Netstat is a powerful command-line tool that provides valuable insights into active network connections, listening ports, and associated processes. Regularly analyzing netstat output allows administrators to detect suspicious activities, such as unauthorized connections or unusual listening ports.
Enhanced Security
Additionaly, Network visibility plays a pivotal role in bolstering network security. Organizations can detect and mitigate potential threats by monitoring network traffic, such as unauthorized access attempts, malware infections, or suspicious activities. It provides the opportunity to set up robust security measures, implement intrusion detection systems, and respond promptly to any security incidents.
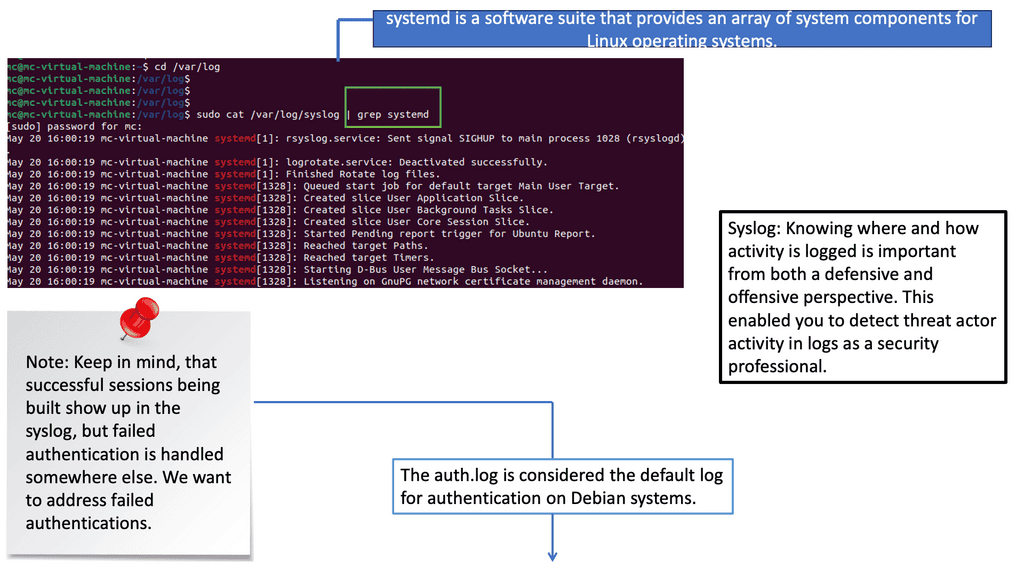
Visibility from Logs: Syslog
Syslog is a standardized protocol used for message logging. It is vital in capturing logs from different devices, applications, and systems. By analyzing syslog, security professionals can gain valuable information about network activities, system events, and potential security incidents. Understanding the structure and content of Syslog messages is the first step toward effective event detection.
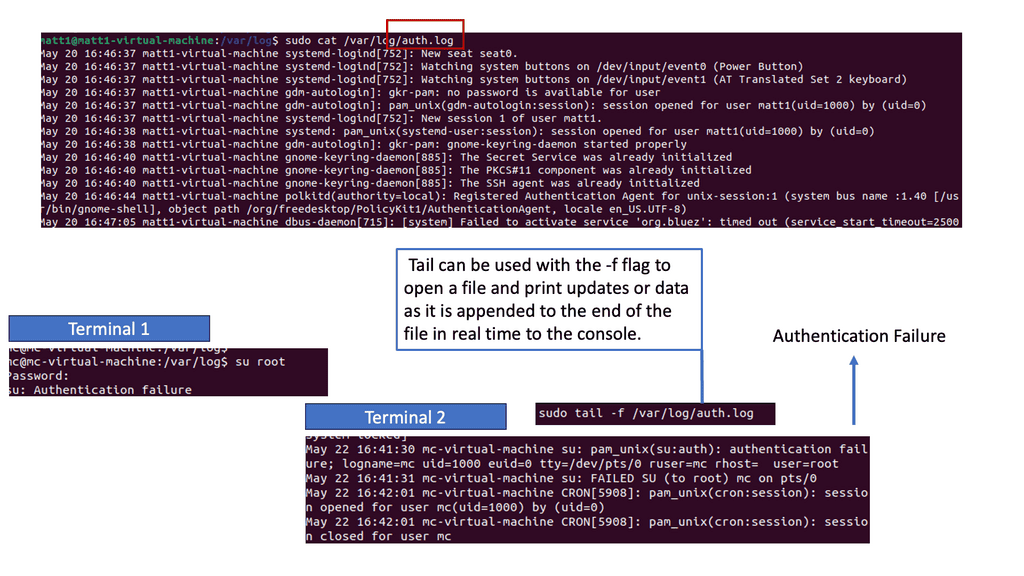
The role of Auth.log
Auth.log is a specific log file that records authentication-related events on a Unix or Linux system. It provides critical insights into user login attempts, authentication failures, and other authentication-related activities. By closely monitoring auth.log, security teams can detect suspicious login patterns, brute-force attacks, and unauthorized access attempts. This section will explore the critical elements of auth.log and highlight the indicators of potential security threats.
Network Visibility Tools
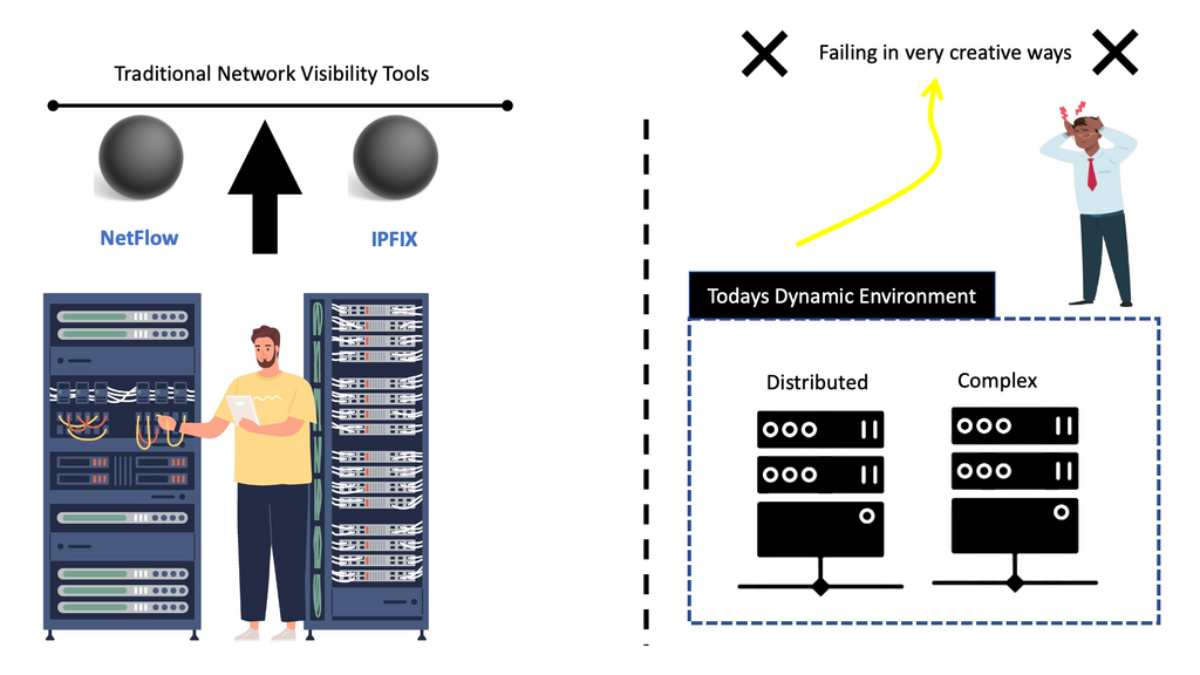
Traditional network visibility tools give you the foundational data to see what’s happening in your network. Network visibility solutions are familiar, and tools like NetFlow and IPFIX have been around for a while. However, they give you an incomplete view of the landscape. Then, we have a new way of looking with a new practice of distributed systems observability.
Observability: Observability software engineering brings a different context to the meaning of the data, allowing you to examine your infrastructure and its applications from other and more exciting angles. It combines traditional network visibility with a platform approach, enabling robust analysis and visibility with full-stack microservices observability.
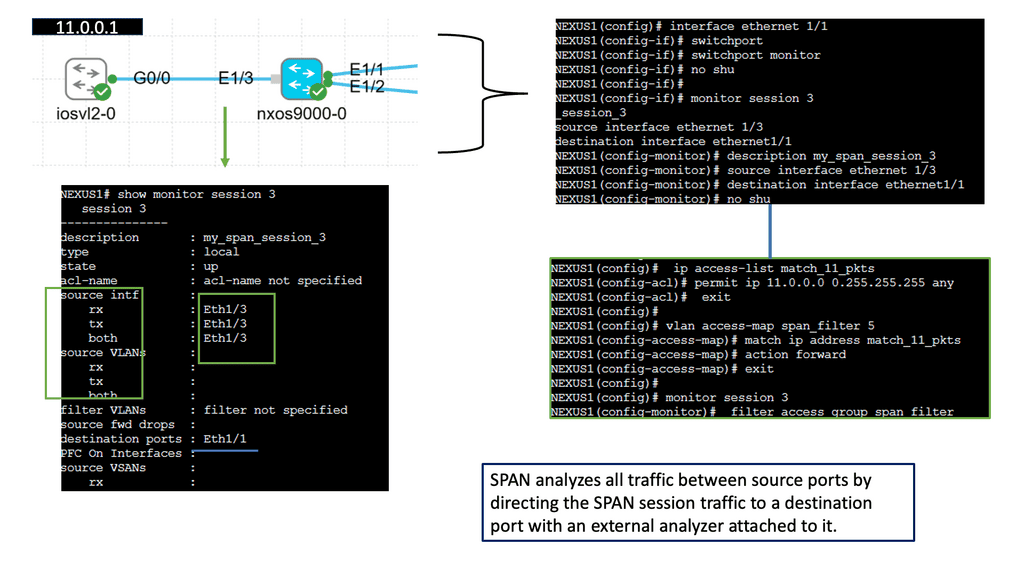
Understanding SPAN
SPAN, also known as port mirroring, is a feature that allows the network administrator to capture and forward network traffic from one or more source ports to a destination port for analysis. By mirroring traffic to a dedicated monitoring device or software tool, network administrators gain valuable insights into the network’s behavior, troubleshoot issues, and ensure optimal performance.
SPAN offers network administrators many benefits:
1) First, it enables network traffic monitoring without disrupting the normal flow of operations. Network administrators can analyze packets and gain insights into network behavior without interfering with live data transfer.
2) Second, SPAN provides a nonintrusive method of capturing network traffic, which is invaluable for security purposes. It allows for the detection of suspicious activities and potential threats and assists in forensic analysis.
3) Configuring SPAN on Cisco NX-OS is straightforward. Network administrators can use the CLI or a graphical interface to define source and destination ports, select the desired traffic types, and set up filters if necessary. Cisco NX-OS provides flexibility and granularity in configuring SPAN sessions, allowing administrators to tailor their monitoring needs to specific requirements.
 What is NetFlow?
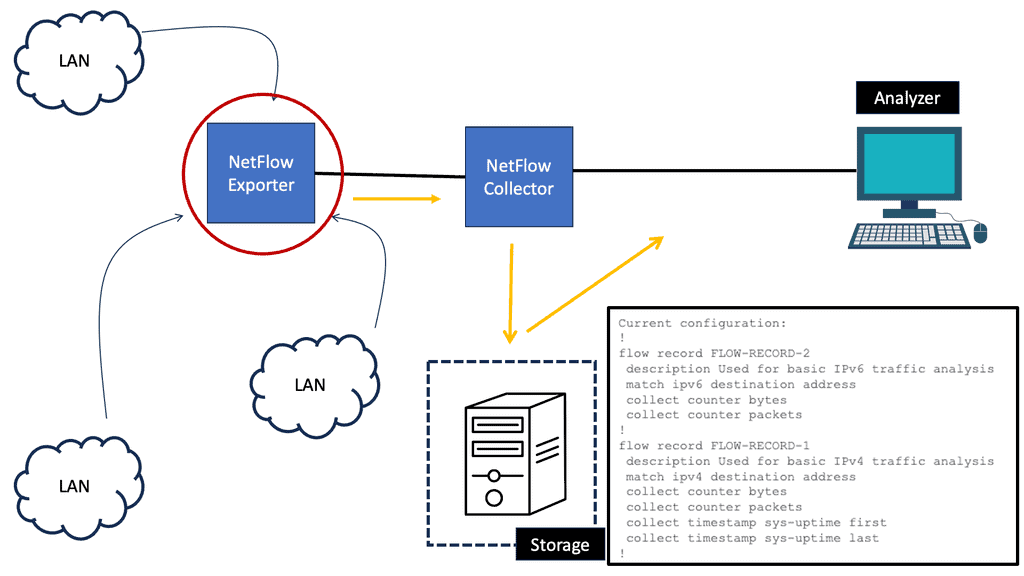
NetFlow is a network protocol developed by Cisco Systems that provides valuable insights into network traffic. It collects and analyzes data packets as they traverse through network devices, allowing network administrators to monitor and understand network behavior.
**Capturing from data packets**
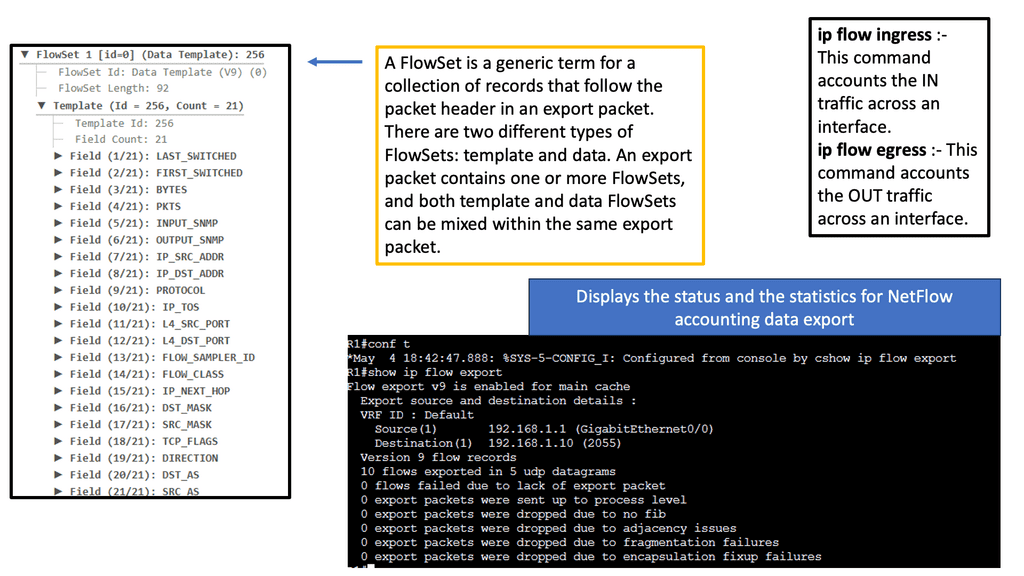
NetFlow captures relevant information from data packets, such as source and destination IP addresses, packet size, and timestamps. This information is then stored in flow records, which provide a comprehensive view of network traffic patterns. NetFlow-enabled devices generate and export these flow records to a NetFlow collector for further analysis.
**Complete visibility to traffic patterns**
NetFlow analysis offers numerous benefits to network administrators and security professionals. Firstly, it provides visibility into network traffic patterns, allowing for better network capacity planning and optimization. Additionally, NetFlow analysis aids in troubleshooting network issues by identifying bandwidth hogs, unusual traffic patterns, and potential security threats.
**Enhancement to network security**
One significant advantage of NetFlow is its ability to enhance network security. By analyzing flow records, security teams can detect and respond to suspicious activities like network intrusion attempts, DDoS attacks, or data exfiltration. NetFlow can also contribute to incident response efforts by providing valuable forensic data.
**Network performance and diagnostics**
NetFlow plays a crucial role in performance monitoring and network diagnostics. Administrators can identify bottlenecks, application performance issues, and network congestion by analyzing flow records. This valuable insight allows for proactive measures to optimize network performance and ensure a smooth user experience.
Understanding sFlow
sFlow is a standardized packet-sampling technology that allows network administrators to monitor traffic flow without needing dedicated monitoring ports. By capturing and analyzing a representative sample of network packets, sFlow provides valuable insights into the network’s overall health and performance.
Enhanced Network Performance: sFlow on Cisco NX-OS enables administrators to identify bandwidth-hungry applications and users, allowing for proactive management and optimization of network resources. By pinpointing performance bottlenecks, network administrators can proactively ensure optimal network performance.
Strengthened Network Security: sFlow provides real-time visibility into network traffic, allowing for the detection of anomalies and potential security threats. With sFlow on Cisco NX-OS, administrators can monitor and analyze traffic patterns, identify suspicious behavior, and take immediate action to mitigate security risks.
Streamlined Troubleshooting: Troubleshooting network issues can be time-consuming and complex. However, with sFlow on Cisco NX-OS, administrators gain access to detailed network traffic data, enabling faster and more accurate troubleshooting. By analyzing sFlow data, administrators can quickly identify the root cause of network issues and implement effective solutions.
Example Product: Cisco Secure Cloud Analytics
### Unmatched Visibility and Insight
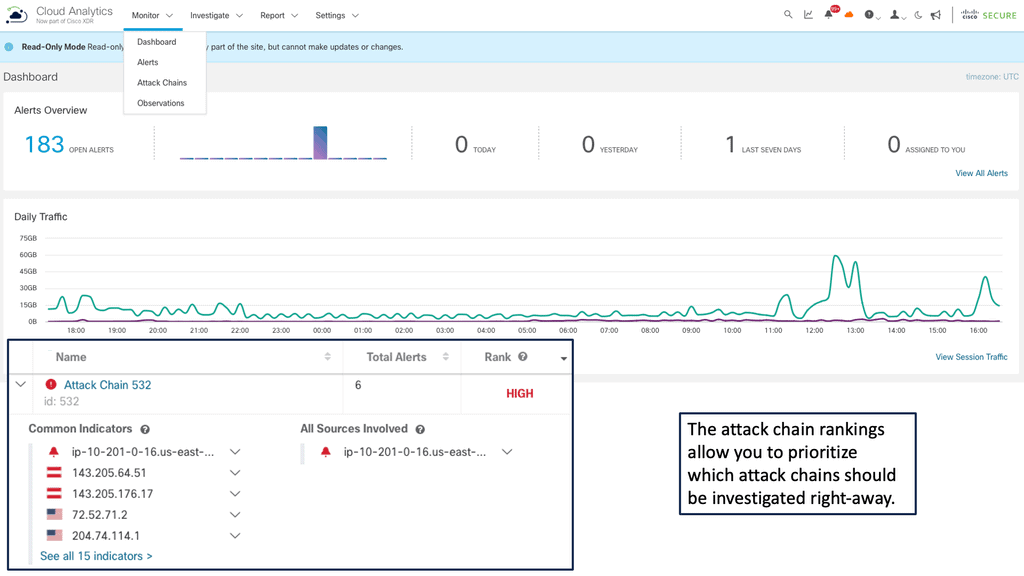
Cisco Secure Cloud Analytics offers unparalleled visibility into your cloud environment, helping you identify and address potential threats before they can cause harm. By leveraging advanced machine learning algorithms and behavioral analytics, it continuously monitors network traffic and user activities.
This ensures that any anomalous behavior, which could signify a potential breach, is swiftly detected and acted upon. The platform’s intuitive dashboard provides real-time insights and detailed reports, making it easier for security teams to stay ahead of threats.
### Seamless Integration and Scalability
One of the standout features of Cisco Secure Cloud Analytics is its ability to seamlessly integrate with existing security infrastructure. Whether your organization uses AWS, Azure, or Google Cloud, this tool can be easily deployed and scaled to meet your specific needs. Its compatibility with a wide range of APIs and third-party applications ensures that it can work harmoniously within your current ecosystem, providing a unified approach to cloud security.
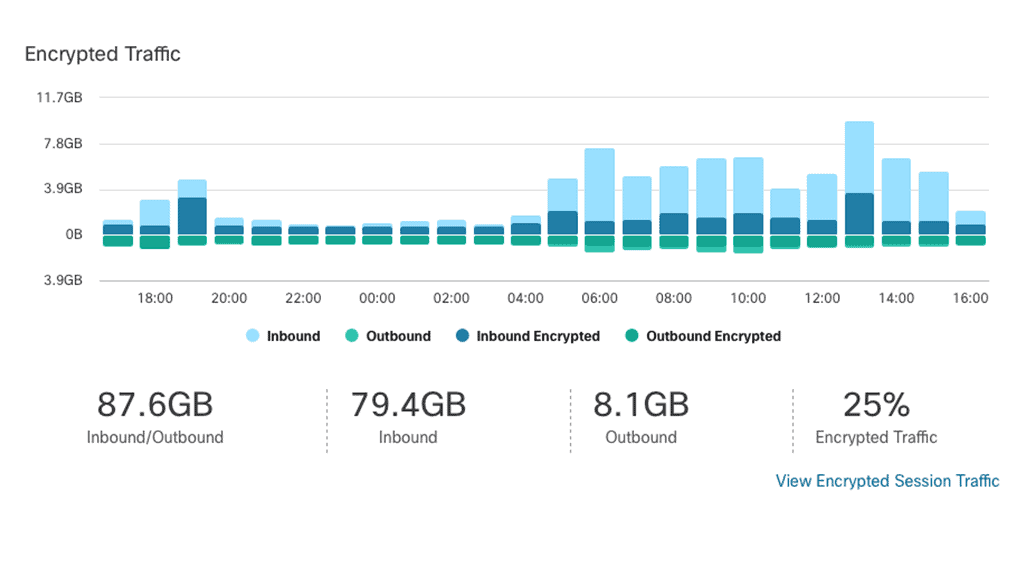 ### Proactive Threat Detection and Response
In the realm of cybersecurity, speed and accuracy are paramount. Cisco Secure Cloud Analytics excels in both, thanks to its proactive threat detection capabilities. It not only identifies potential threats but also prioritizes them based on their severity, allowing your security team to respond swiftly. Automated alerts and incident response workflows ensure that critical issues are addressed promptly, minimizing the risk of data breaches and operational disruptions.
### Compliance and Risk Management
Maintaining compliance with industry standards and regulations is a crucial aspect of modern cybersecurity. Cisco Secure Cloud Analytics helps organizations achieve and maintain compliance by providing detailed audit trails and compliance reports. This makes it easier to adhere to standards such as GDPR, HIPAA, and PCI-DSS, thereby reducing the risk of costly fines and reputational damage. Additionally, its risk management features enable you to assess and mitigate vulnerabilities before they can be exploited.
Network Visibility Solutions
When you look at monitoring, it’s based on event alerts and the dashboard, all of which are populated with passive ( sampling ) to generate a dashboard. It is also per domain. However, we have very complex, distributed, and hybrid environments.
**Different API Consumption**
We have a hybrid notion from a code perspective and physical location with cloud-native solutions. The way you consume API will be different in each area, too. For example, how you consume API for SaaS will differ for authentication for on-premise and cloud. Keep in mind that API security is a top concern.
With our network visibility solutions, we must support all journeys in a complex and distributed world. So, we need system full-stack observability and observability software engineering to see what happens in each domain and to know what is happening in real-time.
**Active with metrics, logs, traces and events**
So, instead of being passive with data, we are active with metrics, logs, traces, events, and any other types of data we can inject. If there is a network problem, we inject all network-related data. If there is a security problem, we inject all security-related information.
Example: Getting hit by Malware
If Malware hits you, you need to be able to detect a container quickly. Then, avoid remote code execution attempts from succeeding while putting the affected server in quarantine for patching.
So, there are several stages you need to perform. The security breach has affected you across different domains and teams. The topology now changes, too. The backend and front end will change, so we must reroute traffic while maintaining performance. To solve this, we need to analyze different types of data.
You must inject as much telemetry data as possible, including application, security, VPC, VNETs, and Internet statistics. We create all this data via automation, metrics, events, logs, and distributed tracing based on open telemetry.
- Metrics: Metrics are aggregated measurements grouped or collected at the standard interface or a given period. For example, there could be a 1 min aggregate, so some details are lots. Aggregation helps you save on storage but requires proper pre-planning on what metrics to consider.
- Events are discrete actions happening at a specific moment in time. The more metadata associated with an event, the better. Events help confirm that particular actions occurred at a specific time.
- Logs: Logs are detailed and have timestamps associated with them. These can either be structured or unstructured. As a result, logs are very versatile and empower many use cases.
- Traces: Traces are events that change between different application components. This item was purchased via credit card at this time; it took 37 seconds to complete the transaction. All chain details and dependencies are part of the trace, which allows you to follow what is going on.
In the case of Malware detection, a combination of metrics, traces, and logs would have helped you, and switching between views and having automated correlation will help you get to the root cause. But you must also detect and respond appropriately, leading us to secure network analytics.
Related: Before you proceed, you may find the following posts helpful:
Back to Basics: Network Visibility
Understanding Network Visibility
Network visibility refers to gaining clear insights into the network infrastructure, traffic, and the applications running on it. It involves capturing, monitoring, and analyzing network data to obtain valuable information about network performance, user behavior, and potential vulnerabilities. By having a comprehensive network view, organizations can make informed decisions, troubleshoot issues efficiently, and proactively address network challenges.
**Security threats with network analysis and visibility**
Remember, those performance problems are often a direct result of a security breach. So, distributed systems observability goes hand in hand with networking and security. It does this by gathering as much data as possible, commonly known as machine data, from multiple data points. It then ingests the data and applies normalization and correlation techniques with some algorithm or statistical model to derive meaning.
Key Components of Network Visibility:
a) Traffic Monitoring: Effective network visibility relies on robust traffic monitoring tools that capture and analyze network packets in real-time. These tools provide granular details about network performance, bandwidth utilization, and application behavior, enabling organizations to identify and resolve bottlenecks.
b) Network Taps: Network taps are hardware devices that provide a nonintrusive way to access network traffic. By connecting to a network tap, organizations can gain full visibility into network data without disrupting network operations. This ensures accurate monitoring and analysis of network traffic.
c) Network Packet Brokers: Network packet brokers act as intermediaries between network taps and monitoring tools. They collect, filter, and distribute network packets to the appropriate monitoring tools, optimizing traffic visibility and ensuring efficient data analysis.
d) Packet Capture and Analysis: Packet capture tools capture network packets and provide detailed insights into network behavior, protocols, and potential issues. These tools enable deep packet inspection and analysis, facilitating troubleshooting, performance monitoring, and security investigations.
e) Flow-Based Monitoring: Flow-based monitoring tools collect information on network flows, including source and destination IP addresses, protocols, and data volumes. By analyzing flow data, organizations can gain visibility into network traffic patterns, identify anomalies, and detect potential security threats.
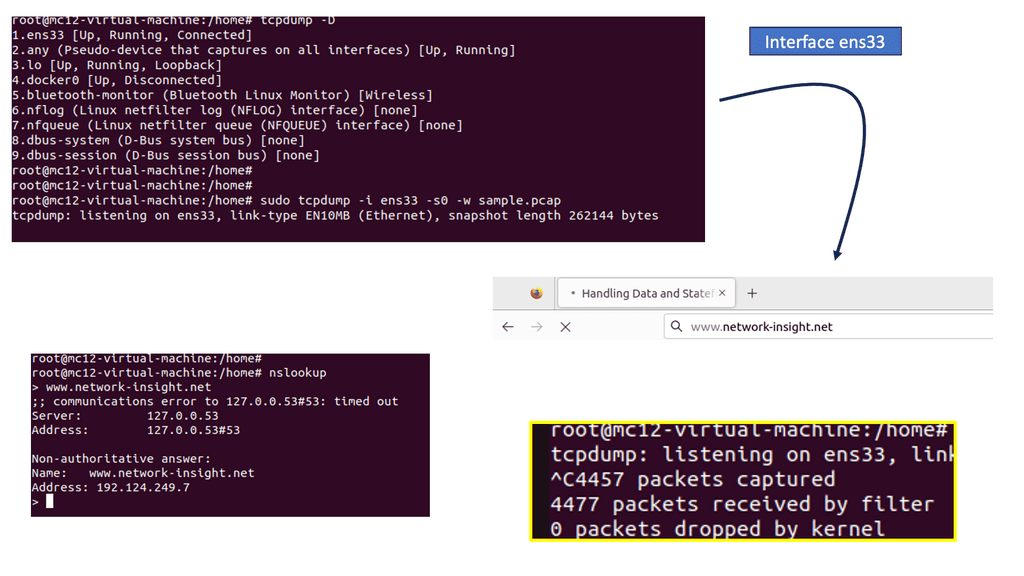
Capturing Traffic: Network Analysis
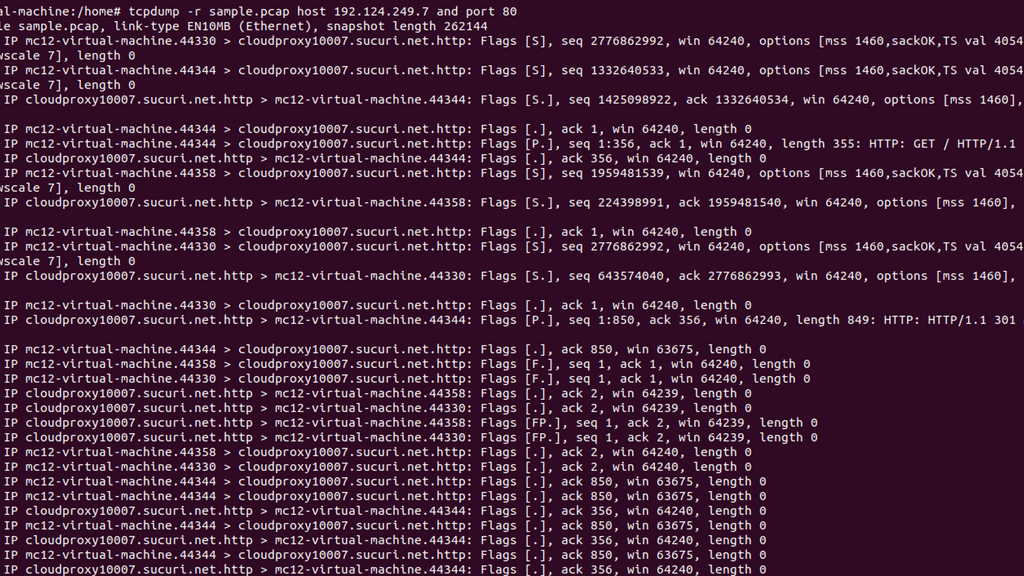
Tcpdump is a command-line packet analyzer tool for capturing and analyzing network packets. It captures packets from a network interface and displays their contents in real time or saves them to a file for later analysis. With tcpdump, you can inspect packet headers, filter packets based on specific criteria, and perform detailed network traffic analysis.
Visibility with CDP
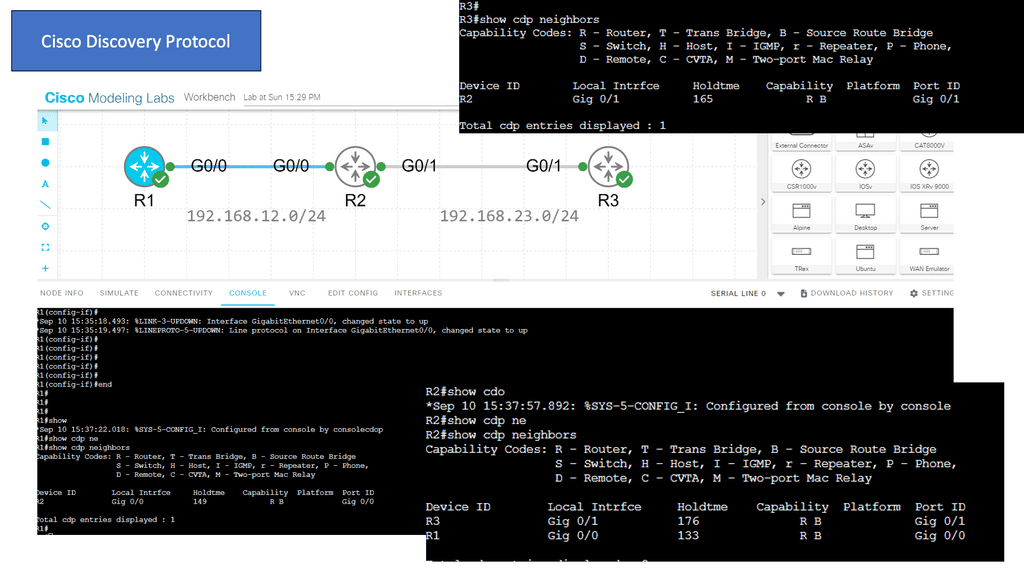
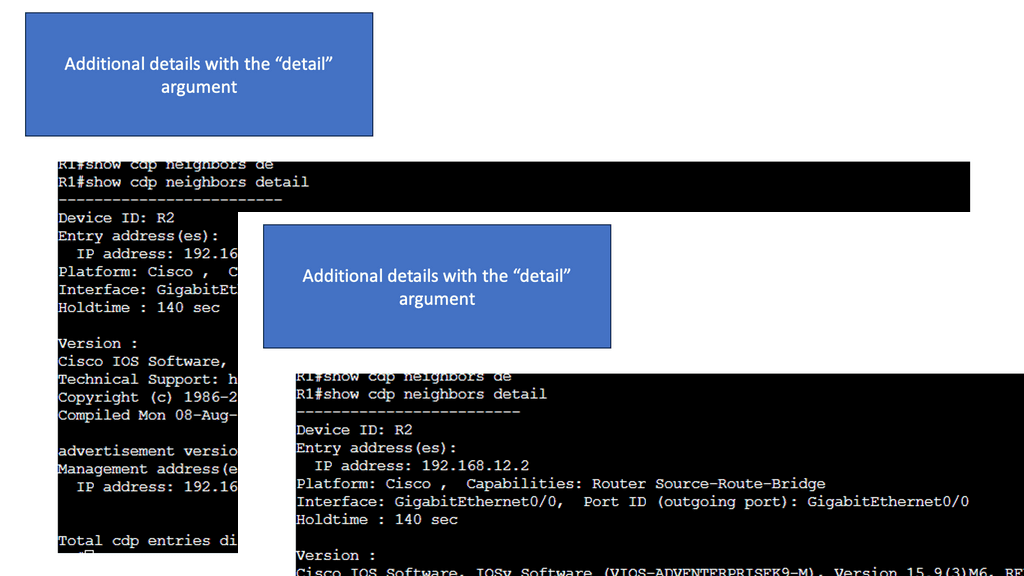
Cisco CDP is a proprietary Layer 2 network protocol developed by Cisco Systems. It operates at the Data Link Layer of the OSI model and enables network devices to discover and gather information about other directly connected devices. By exchanging CDP packets, devices can learn about their neighbors, including device types, IP addresses, and capabilities.
Starting Network Visibility
1. Data-driven visibility
Combating the constantly evolving threat actor requires good network analysis and visibility along with analytics into all areas of the infrastructure, especially the host and user behavior aligning with the traffic flowing between hosts. This is where machine learning (ML) and multiple analytical engines detect and respond to suspicious and malicious activity in the network.
This is done against machine data that multiple tools have traditionally gathered and stored in separate databases. Adding content to previously unstructured data allows you to extract valuable insights, which can be helpful for security, network performance, and user behavior monitoring.
2. System observability
The big difference between traditional network visibility and distributed systems observability is between seeing and understanding what’s happening in your network and, more importantly, understanding why it’s happening. This empowers you to get to the root cause more quickly. Be it a network or security-related incident. For all of this, we need to turn to data to find meaning, often called data-driven visibility in real-time, which is required to maximize positive outcomes while minimizing or eliminating issues before they happen.
3. Machine data and observability
Data-driven visibility is derived from machine data. So, what is machine data? Machine data is everywhere and flows from all the devices we interact with, making up around 90% of today’s data. Harnessing this data can give you powerful insights for networking and security. Furthermore, machine data can be in many formats, such as structured and unstructured.
As a result, it can be challenging to predict and process. When you find issues in machine data, you need to be able to fix them in less time. You need to pinpoint, correlate, and alert specific events so we can save time.
We need a platform that can perform network analysis and visibility instead of only using multiple tools dispersed throughout the network. A platform can take data from any device and create an intelligent, searchable index. For example, a SIEM solution can create a searchable index for you. There are several network visibility solutions, such as cloud-based or on-premise-based solutions.
4. Network Visibility Tools
Traditional, legacy, or network visibility tools are the data we collect with SNMP, network flows, and IPFIX, even from routing tables and geo-locations. To recap, IPFIX is an accounting technology that monitors traffic flows. IPFIX then interprets the client, server, protocol, and port used, counts the number of bytes and packets, and sends that data to an IPFIX collector.
Network flow or traffic is the amount of data transmitted across a network over a specific period. The flow identification is performed based on five fields in the packet header. These fields are the following: source I.P. address, destination I.P. address, protocol identifier, source port number, and destination port number.
Then, we have SNMP, a networking protocol for managing and monitoring network-connected devices. The SNMP protocol is embedded in multiple local devices. None of these technologies is going away; they must be correlated and connected.
Example Product: Cisco Cyber Vision
### The Importance of Network Visibility
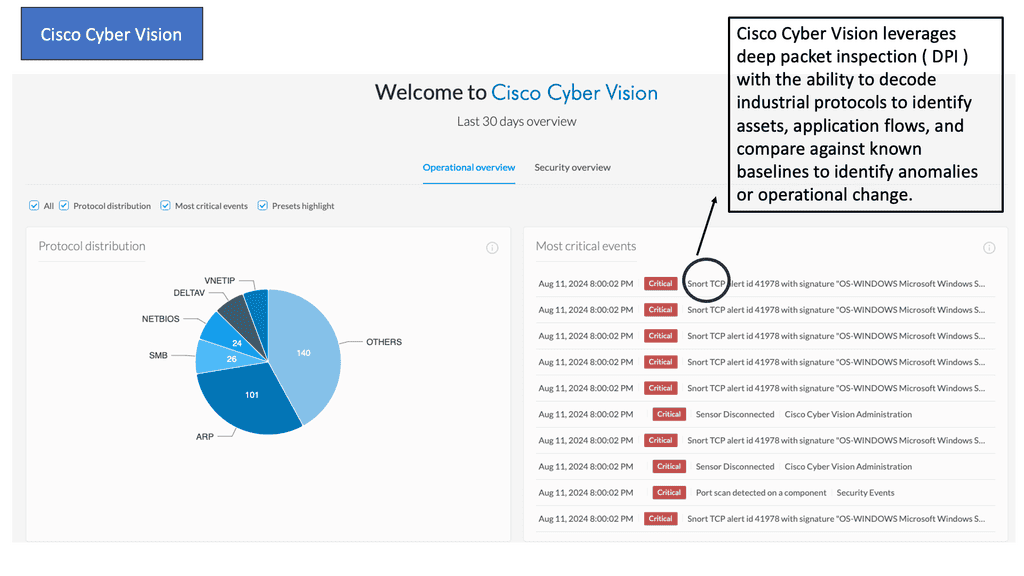
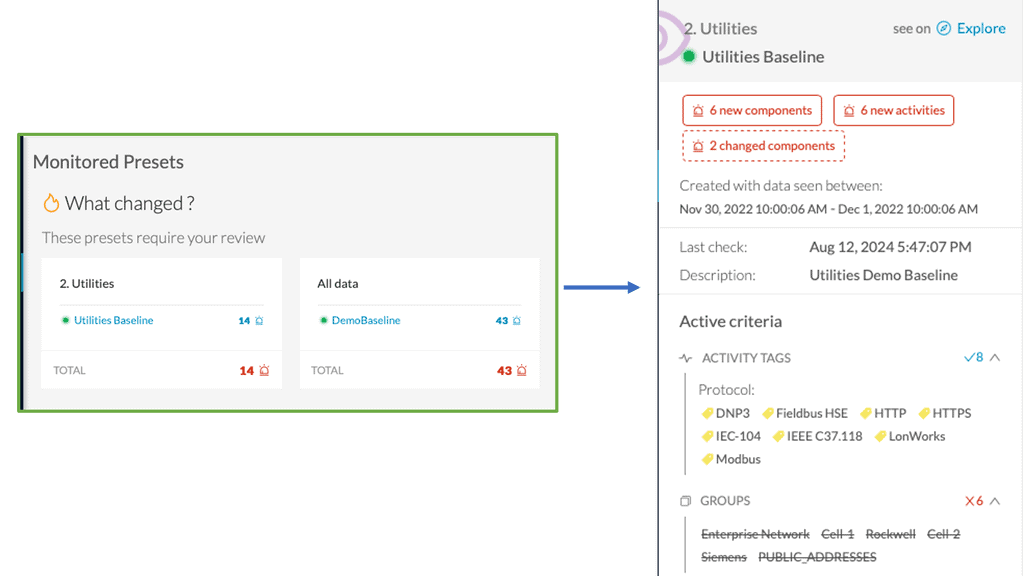
One of the primary challenges in securing industrial networks is the lack of visibility. Traditional IT security tools often fall short when applied to OT environments. Cisco Cyber Vision addresses this gap by offering unparalleled network visibility. It monitors and maps all connected devices, communications, and data flows within your ICS network, ensuring that you have a clear and comprehensive view of your entire infrastructure.
### Real-time Threat Detection
In addition to providing visibility, Cisco Cyber Vision excels in real-time threat detection. By leveraging advanced analytics and machine learning, it can identify and alert you to potential threats as they occur. This proactive approach enables you to respond swiftly to security incidents, minimizing potential damage and downtime. The system continuously updates its threat database, ensuring that you are protected against the latest cyber threats.
### Seamless Integration with Existing Systems
Cisco Cyber Vision is designed to integrate seamlessly with your existing security infrastructure. Whether you use Cisco’s own security solutions or third-party tools, Cyber Vision ensures a smooth and efficient integration process. This interoperability allows you to leverage your current investments while enhancing your overall security posture. Moreover, it provides a unified platform for managing both IT and OT security, bridging the gap between these traditionally siloed domains.
### Enhancing Compliance and Reporting
Adhering to regulatory requirements and industry standards is a crucial aspect of industrial network security. Cisco Cyber Vision simplifies the compliance process by offering detailed reporting and audit capabilities. It generates comprehensive reports that outline network activity, security incidents, and compliance status. These reports not only help in meeting regulatory obligations but also provide valuable insights for continuous improvement of your security strategies.
Traditional network visibility tools:
**Populate charts and create baselines**
From this data, we can implement network security. First, we can create baselines, identify anomalies, and start to organize network activity. Alerts are triggered when thresholds are met. So we get a warning about a router that is down or an application is not performing as expected.
**Poor Thresholds**
This can be real-time or historical. However, this is all good for the previous way of doing things. But for example, when an application is not performing well, a threshold tells you nothing; you need to be able to see the full paths and any use of each part of the transaction.
All of which were used to populate the charts and graphs. These dashboards rely on known problems that we have seen in the past. However, today’s networks fail in creative ways often referred to as unknown/unknown, calling for a new approach to distributed systems observability that Site Reliability Engineering (SRE) teams employ.
Observability Software Engineering
To start an observability project, we need diverse data and visibility to see various things happening today. We don’t just have known problems anymore. We have a mix of issues that we have yet to see before. Networks fail in creative ways, some of which have never happened before. We need to look at the network differently, using new and old network visibility tools and the practices of observability software engineering.
We need to diversify your data so we have multiple perspectives to understand better what you are looking at. This can only be done with a distributed systems observability platform. What does this platform need?
Network analysis and visibility:
Multiple data types and point solutions
So, we need to get as much data as possible from all network visibility tools such as flows, SNMP, IPFIX, routing tables, packets, telemetry logs, metrics, logs, and traces. Of course, we are familiar with and have used everything in the past, and each data type provides a different perspective. However, the main drawback of not using a platform is that it lends itself to a series of point solutions, leaving gaps in network visibility.
Now we have a database of each one. So, we could have a database for network traffic flow information for application visibility or a database for SNMP. The issue with the point solution is that you can only see some things. Each data point acts on its island of visibility, and you will have difficulty understanding what is happening. At a bare minimum, you should have some automation between all these devices.
**Automation as the starting point**
Automation could be used to glue everything together. Ansible architecture has two variants: a CLI version known as Ansible Core and a platform-based approach with Ansible Tower. Automation does not provide visibility, but it is a starting point to glue together the different point solutions to increase network visibility.
For example, you collect all logs from all firewall devices and send them to a backend for analysis. Ansible variables are recommended, and you can use the Ansible inventory variable to fine-tune how you connect to your managed assets. In addition, variables bring many benefits and modularity to Ansible playbooks.
Isolated monitoring for practical network analysis and visibility
I know what happens on my LAN, but what happens in my service provider networks.? I can see VPC flows from a single cloud provider, but what happens in my multi-cloud designs? I can see what is happening in my interface states, but what is happening in my overlay networks?
For SD-WAN monitoring, if a performance problem with one of my applications or a bad user experience is reported from a remote office, how do we map this back to tunnels? We have pieces of information that are missing end-to-end pictures. For additional information on monitoring and visibility in SD-WAN environments, check out this SDWAN tutorial.
**The issue without data correlation?**
How do we find out if there is a problem when we have to search through multiple databases and dashboards? When there is a problem, how do you correlate it to determine the root cause? What if you have tons of logs and must figure out that this interface utilization correlates with this slow DNS lookup time, which links to a change in BGP configuration?
So you can see everything with traditional or legacy visibility, but how do you go beyond that? How do you know why something has happened? This is where distributed systems observability and the practices of observability software engineering come in—having full-stack observability with network visibility solutions into all network angles.
Distributed Systems Observability
Seeing is believing
Note: The difference between seeing and understanding. Traditional network visibility solutions let you see what’s happening on your networks. On the other hand, observability helps you understand why something is happening.
With observability, we are not replacing network visibility; we are augmenting this with a distributed systems observability platform that lets us combine all the dots to form a complete picture. With a distributed systems observability platform, we still collect the same information.
Routing information, network traffic, VPC flow logs, results from synthetic tests, metrics, traces, and logs. But now we have several additional steps of normalization and correlations that the platform takes care of for you.
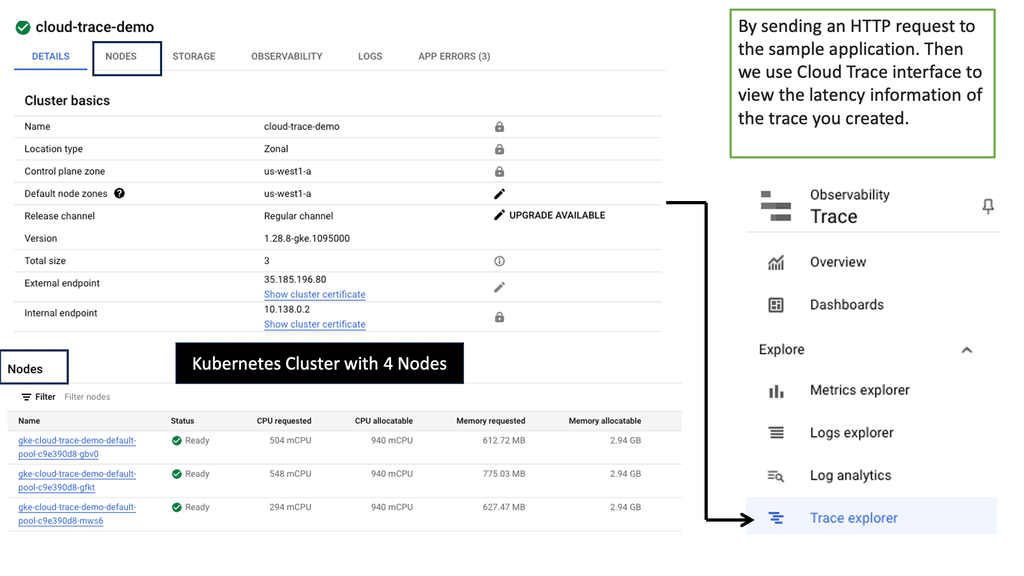
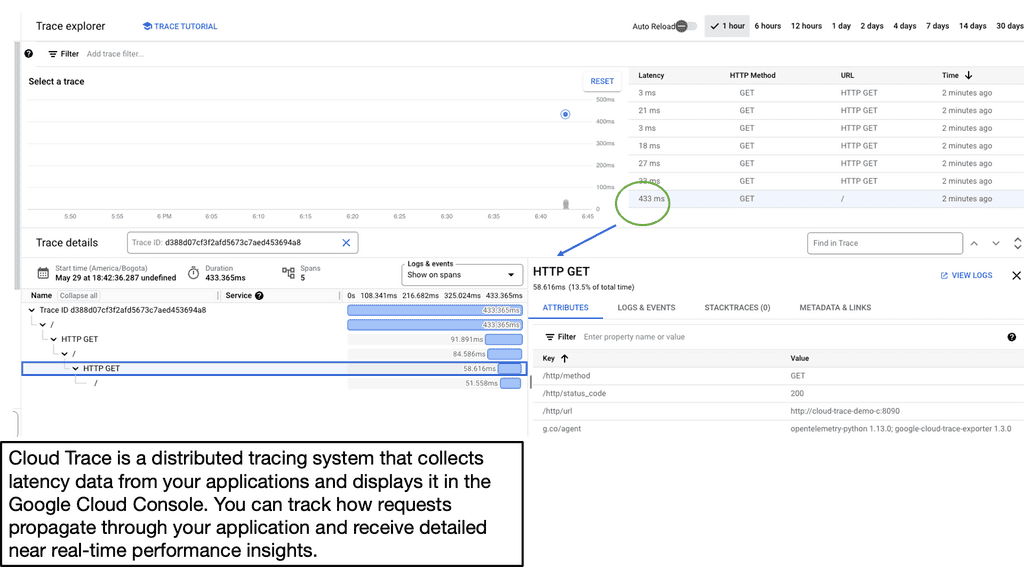
Gaining Visibility: Google Cloud Trace
Application Latency
Before we dive into Cloud Trace, let’s first grasp the concept of application latency. Application latency refers to the delay or time lag experienced by users when they interact with an application. It can be influenced by various factors such as network latency, server response time, and database query execution. Monitoring and analyzing application latency is essential for identifying bottlenecks and optimizing performance.
Trace Latency in Distributed Systems
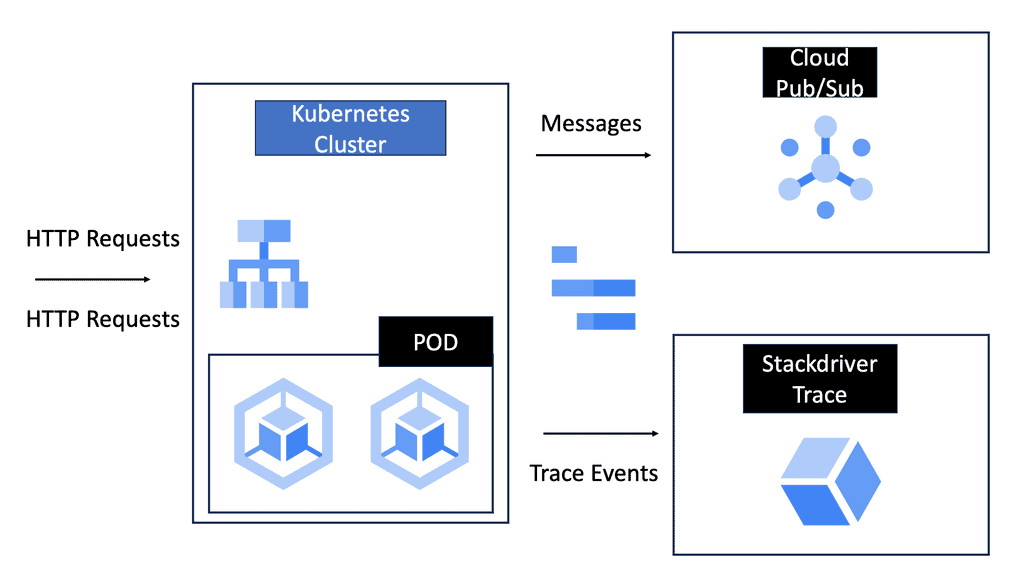
Cloud Trace is a powerful tool offered by Google Cloud that enables developers to trace and analyze latency in distributed systems. It provides detailed visibility into the flow of requests across various services and helps pinpoint performance issues. With Cloud Trace, you can track requests as they traverse through different components of your application and identify latency hotspots.
**Distributed systems observability and normalization**
Interface statistics could be packets per second; flow data might be a percentage of traffic, such as 10% being DNS traffic. Then, we have to normalize and correlate it to understand what happens for the entire business transaction. So, the first step is to ingest as much data as possible, identify or tag data, and then normalize the data. Remember that this could be short-lived data, such as interface statistics.
**Applying machine learning algorithms**
All these different types of data are ingested, normalized, and correlated, which can not be done by a human. Distributed systems observability gives you practical, actionable intelligence that automates the root cause and measures network health by applying machine learning algorithms.
Supervised and unsupervised machine learning is used heavily in the security world. So, in summary, for practical network analysis and visibility, we need to do the following:
This will give you full-stack observability for enhanced network visibility, which traditional network visibility tools cannot provide.
Full Stack Observability
A: – Landscape Transitions
We’d like to briefly describe the transitions we have gone through and why we need to address full-stack observability. First, we had a monolithic application, which is still very alive today, and this is where the mission-critical system lives.
We then moved to the cloud and started adopting containers and platforms. Then, there was a drive to re-architect the code, beginning with cloud-native and, now, with observability.
Finally, monitoring becomes more important with the move to containers and kubernetes. Why? Because the environments are dynamic, you need to embed security somehow.
B: – The traditional world of normality:
In the past, network analysis and visibility were simple. Applications ran in single private data centers, potentially two data centers for high availability. These data centers were on-premises, and all components were housed internally.
In addition, the network and infrastructure were pretty static, and there were few changes to the stack, for example, daily. However, nowadays, we are in a different environment where we have complex and distributed applications. This is with components/services located in many other places and types of places, on-premises and in the cloud, depending on local and remote services.
Containers & Visibility
**Dynamic Environments**
There has been a considerable rise in the use of containers. The container wave introduces dynamic environments with cloud-like behavior where you can scale up and down very quickly and easily. We have temporary components. These things are coming up and down inside containers and are part of services.
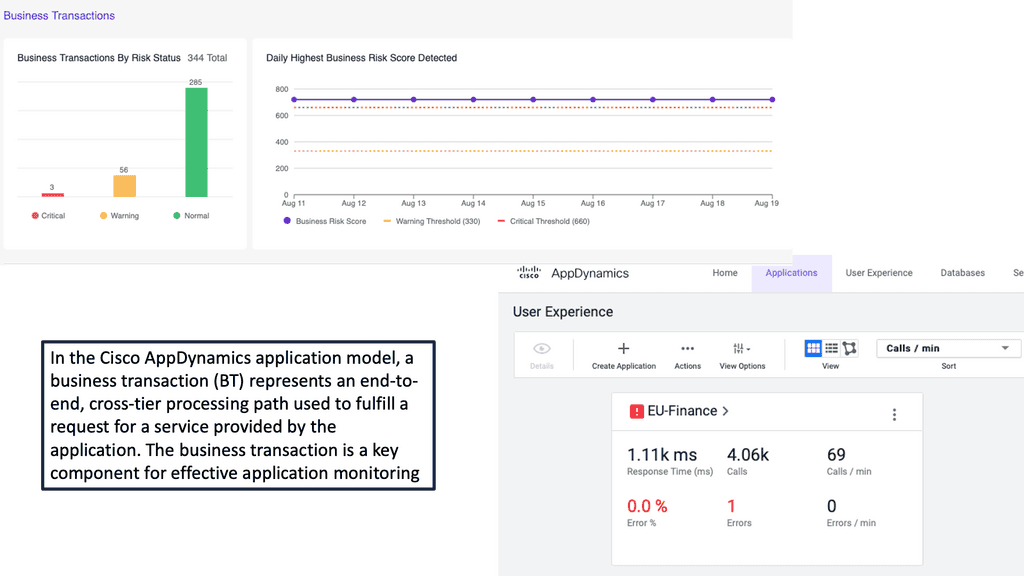
The paths and transactions are both complex but also shifting. So you have multiple steps or services for an application: A business transaction. It would be best if you strived to have the automatic discovery of business transactions and application topology maps of how the traffic flows.
**Microservices: Network analysis and visibility**
With the wave towards microservices, we get the benefits of scalability and business continuity, but managing is very complex. In addition, what used to be method calls or interprocess calls within the monolith host now go over the network and are susceptible to deviations in latency.
**The issue of silo-based monitoring**
With all these new waves of microservices and containers, we have an issue in silo monitoring with poor network analysis and visibility in a very distributed environment. Let us look at an example of isolating a problem with traditional network visibility and monitoring.
Example: Slow Checkout
The checkout for mobile or web is slow, and for the application, there could be JVM performance issues. Then, we could have a slow SQL query in the database, and on the network side, we have an interface rate of 80%. So traditional network visibility and monitoring with a silo-based approach have their tools, but something needs to be connected. How do you quickly get to the root cause of this problem?
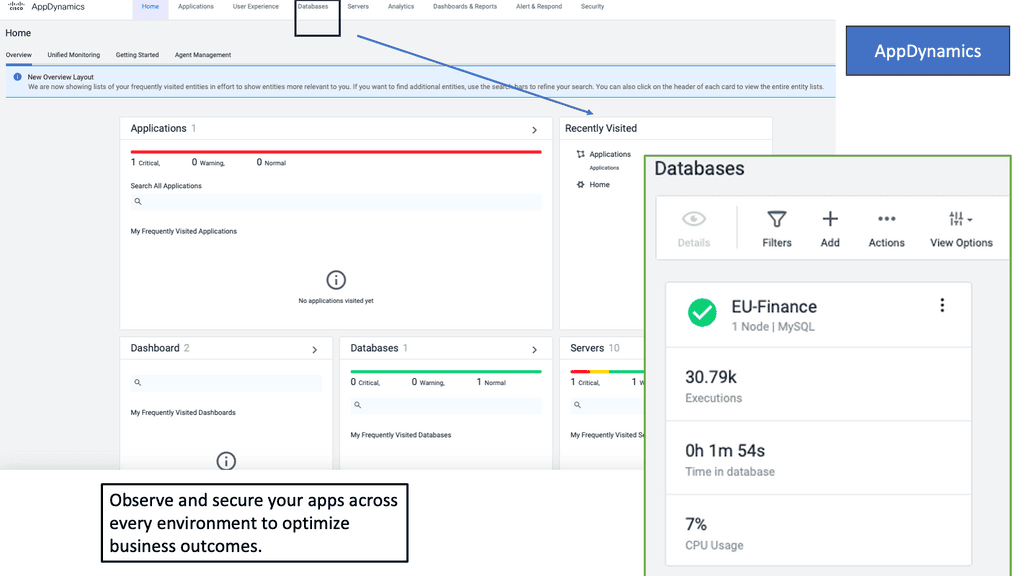
Product: Cisco AppDynamics
### What is Cisco AppDynamics?
Cisco AppDynamics is a comprehensive application performance management (APM) tool that offers real-time monitoring, analysis, and optimization of your applications. Designed to provide deep insights into application behavior, it helps businesses identify and resolve performance issues before they impact end-users. Whether you’re dealing with complex cloud-native applications or traditional on-premises systems, AppDynamics offers a unified view of your entire application ecosystem.
### Key Features and Benefits
#### Real-Time Monitoring
One of the standout features of Cisco AppDynamics is its ability to provide real-time monitoring of your applications. This means you can continuously track performance metrics, detect anomalies, and receive alerts instantly. This proactive approach enables quick resolution of issues, minimizing downtime and enhancing user satisfaction.
#### Deep Application Insights
AppDynamics goes beyond surface-level metrics, offering deep insights into the inner workings of your applications. It provides detailed transaction traces, code-level diagnostics, and end-user experience monitoring. These insights empower development and operations teams to pinpoint root causes of performance bottlenecks and optimize application performance effectively.
#### Business Performance Correlation
Understanding how application performance impacts business outcomes is crucial. Cisco AppDynamics allows you to correlate application metrics with business performance metrics. This holistic view helps in making data-driven decisions, prioritizing performance improvements that have the most significant impact on business goals.
 ### Implementation and Integration
#### Easy Deployment
Implementing Cisco AppDynamics is straightforward, with support for a wide range of environments, including cloud, on-premises, and hybrid systems. The platform offers seamless integration with various popular development and operations tools, making it easier to incorporate into your existing workflows.
#### Scalability
As your business grows, so do your application performance monitoring needs. Cisco AppDynamics is designed to scale effortlessly, accommodating increasing volumes of data and complex application architectures. This scalability ensures that you can maintain optimal performance monitoring as your business evolves.
### Use Cases
#### E-Commerce
For e-commerce platforms, ensuring a seamless shopping experience is critical. Cisco AppDynamics helps monitor and optimize website performance, reducing cart abandonment rates and increasing customer satisfaction. By tracking user behavior and transaction flows, AppDynamics provides actionable insights to enhance the online shopping experience.
#### Financial Services
In the financial services sector, where application performance directly impacts customer trust and regulatory compliance, Cisco AppDynamics plays a vital role. It helps monitor transaction processing times, detect anomalies, and ensure that financial applications perform at their best, safeguarding both customer trust and regulatory compliance.
Secure Network Analytics
We need good, secure network analytics for visibility and detection and then to respond best. We have several different types of analytical engines that can be used to detect a threat. In the last few years, we have seen an increase in the talk and drive around analytics and how it can be used in networking and security. Many vendors claim they do both supervised and unsupervised machine learning, all of which are used in the detection phase.
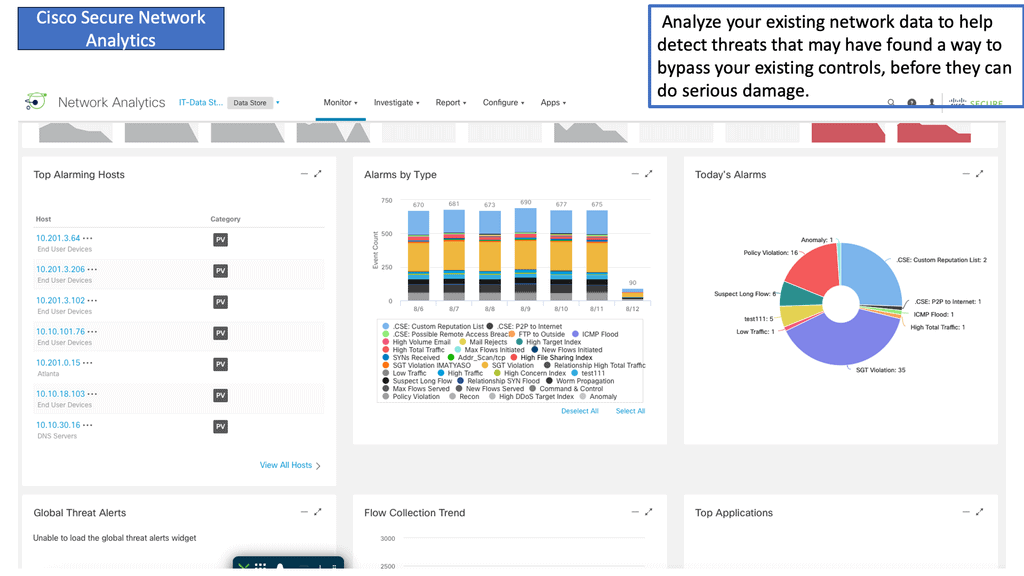
Cisco Secure Network Analytics (Cisco SNA) is a powerful network security and management tool developed by Cisco Systems. It provides a comprehensive solution for monitoring, analyzing, and securing enterprise networks.
Key Features:
1. Network-Wide Monitoring: Cisco SNA enables real-time monitoring of the entire network, including devices, applications, and traffic flows. It provides visibility into network traffic patterns and anomalies, enabling organizations to detect and respond to potential threats quickly.
2. Threat Detection and Response: Cisco SNA uses advanced machine learning algorithms to detect and prioritize potential threats. It continuously monitors the network, analyzing traffic patterns and detecting anomalies that may indicate malicious activities. Once a threat is detected, Cisco SNA provides real-time alerts and actionable remediation steps to mitigate the risk.
3. Network Traffic Analysis: Cisco SNA offers advanced network traffic analysis capabilities. It allows organizations to gain insights into network behavior, identify bandwidth hogs, and optimize network performance. By analyzing network traffic, organizations can identify bottlenecks and bottlenecks, allowing them to make informed decisions about resource allocation and application performance.
4. Security Event Correlation: Cisco SNA integrates threat intelligence from multiple sources, including Cisco Talos threat research group. It correlates security events from across the network, enabling organizations to identify patterns and relationships that may not be apparent when analyzed individually. This helps organizations identify and prioritize threats more effectively.
5. Event and Incident Management: Cisco SNA provides a comprehensive event and incident management solution. It allows organizations to define custom policies and rules to automatically trigger alerts based on specific conditions. Additionally, Cisco SNA provides a user-friendly interface for managing incidents, including tracking investigations, assigning tasks, and coordinating response efforts.
6. Cloud Integration: Cisco SNA integrates with various cloud platforms, such as Amazon Web Services (AWS) and Microsoft Azure, to provide a unified view of network security and operations. This integration enables organizations to leverage the power of the cloud for scalability, performance, and advanced analytics.
7. Analytics and Reporting: Cisco SNA offers robust analytics and reporting capabilities. It provides real-time and historical analytics, allowing users to gain insights into network performance, security incidents, and trends. Organizations can generate customizable reports, graphs, and dashboards, enabling them to make informed decisions based on data-driven insights.
1. Algorithms and statistical models
For analytics, we have algorithms and statistical models. The algorithms and statistical models aim to achieve some outcome and are extremely useful in understanding constantly evolving domains with many variations. By definition, this is precisely what the security domain is.
However, the threat landscape is growing daily, so if you want to find these threats, you need to shift through a lot of data, commonly known as machine data, that we discussed at the start of the post.
For supervised machine learning, we take a piece of Malware and build up a threat profile that can be gleaned from massive amounts of data. When you see a matching behavior profile for that, you can make an alarm. But you need a lot of data to start with.
2. Crypto mining
This can capture very evasive threats such as crypto mining. A cryptocurrency miner is a software that uses your computer resources to mine cryptocurrency. A crypto mining event of the current miner is just a long-lived flow. It would be best if you had additional ways to determine or gather more metrics to understand that this long-lived flow is malicious and is a cryptocurrency miner.
3. Multilayer Machine Learning Model
By their nature, crypto mining and even Tor will escape most security controls. To capture these, you need a multilayer machine learning model of supervised and unsupervised. So, if you are on a standard network that blocks Tor, it will stop 70% of the time; the other 30% of the entry and exit nodes are unknown.
4. Machine Learning (ML)
Supervised and unsupervised machine learning give you the additional visibility to find those unknowns—the unique situations lurking on your networks. So here we are making an observation, and these models will help you understand whether these are not normal. There are different observation triggers.
First, there is known bad behavior, such as security policy violations and communication to known C&C. Then, we have anomaly conditions, which are observed behavior different from usual. We need to make these alerts meaningful to the business.
5. Meaningful alerts
If I.P. addresses 192.168.1.1/24, upload a large amount of data. It should say that the PCI server is uploading a large amount of data to a known malicious external network, and these are the remediation options. The statement or alert needs to mean something to the business.
We need to express the algorithms in the company’s language. This host could have a behavior profile that does not expect it to download or upload anything.
6. Augment Information
When events leave the system, you can enrich it with data from other systems. You can enhance data inputs with additional telemetry to improve data with other sources that give it more meaning. To help with your alarm, you can add information to the entity. There’s a lot of telemetry in the network. Most devices support NetFlow and IPFIX; you can have Encrypted Traffic Analyses (ETA) and Deep Packet Inspection (DPI).
So you can get loads of valuable insights from these different types of, let’s say, technologies. You can get usernames, device identities, roles, pattern behavior, and locations for additional data sources here. ETA can get a lot of information just by looking at the header without performing decryption. So you can enhance your knowledge of the entity with additional telemetry data.
Network analysis and visibility with a tiered alarm system
Once an alert is received, you can create actions such as sending a Syslog message, email, SMTP trap, and webhooks. So you have a tiered alarm system with different priorities and severity on alarms. Then, you can enrich or extend the detection with data from other products. It can query other products via their API, such as Cisco Talos.
Instead of presenting all the data, they must give them the data they care about. This will add context to the investigation and help the overworked security analyst who is spending 90 mins on one Phishing email investigation.
Summary: Network Visibility
Network visibility refers to real-time monitoring, analyzing, and visualizing network traffic, data, and activities. It provides a comprehensive view of the entire network ecosystem, including physical and virtual components, devices, applications, and users. By capturing and processing network data, organizations gain valuable insights into network performance bottlenecks, security threats, and operational inefficiencies.
The Benefits of Network Visibility
Enhanced Network Performance: Organizations can proactively identify and resolve performance issues with network visibility. They can optimize network resources, ensure smooth operations, and improve user experience by monitoring network traffic patterns, bandwidth utilization, and latency.
Strengthened Security Posture: Network visibility is a powerful security tool that enables organizations to detect and mitigate potential threats in real-time. By analyzing traffic behavior, identifying anomalies, and correlating events, businesses can respond swiftly to security incidents, safeguarding their digital assets and sensitive data.
Improved Operational Efficiency: Network visibility provides valuable insights into network usage, allowing organizations to optimize resource allocation, plan capacity upgrades, and streamline network configurations. This results in improved operational efficiency, reduced downtime, and cost savings.
Implementing Network Visibility Solutions
Network Monitoring Tools: Deploying robust monitoring tools is essential for achieving comprehensive visibility. These tools collect and analyze network data, generating detailed reports and alerts. Various monitoring techniques, from packet sniffing to flow-based analysis, can suit specific organizational needs.
Traffic Analysis and Visualization: Network visibility solutions often include traffic analysis and visualization capabilities, enabling organizations to gain actionable insights from network data. These visual representations help identify traffic patterns, trends, and potential issues at a glance, simplifying troubleshooting and decision-making processes.
Real-World Use Cases
Network Performance Optimization: A multinational corporation successfully utilizes network visibility to identify bandwidth bottlenecks and optimize network resources. By monitoring traffic patterns, they could reroute traffic and implement Quality of Service (QoS) policies, enhancing network performance and improving user experience.
Security Incident Response: A financial institution leverages network visibility to swiftly detect and respond to cybersecurity threats. By analyzing network traffic in real-time, they identified suspicious activities and potential data breaches, enabling them to take immediate action and mitigate risks effectively.
Conclusion: Network visibility is no longer a luxury but a necessity for businesses operating in today’s digital landscape. It empowers organizations to proactively manage network performance, strengthen security postures, and improve operational efficiency. By implementing robust network visibility solutions and leveraging the insights they provide, businesses can unlock the full potential of their digital infrastructure.
- Fortinet’s new FortiOS 7.4 enhances SASE - April 5, 2023
- Comcast SD-WAN Expansion to SMBs - April 4, 2023
- Cisco CloudLock - April 4, 2023

