
**Understanding Microservices Observability**
Before we dive deeper, let’s establish a clear understanding of what microservices observability entails. Observability refers to gaining insights into a system’s internal state based on its external outputs. In microservices, observability involves collecting and analyzing data from various sources, such as logs, metrics, and traces, to understand the system’s behavior and performance comprehensively.
Key Points:
– Focusing on key components that enable comprehensive monitoring and troubleshooting is crucial to achieving effective observability. These components include logging, metrics, and distributed tracing. Logging provides a detailed record of events and system activities, while metrics measure quantitative system performance. Distributed tracing allows tracking requests propagating through multiple microservices, giving valuable insights into the latency and dependencies between services.
– Numerous tools and technologies have emerged to support the observability of microservices. Prominent examples include popular open-source solutions like Prometheus, Grafana, and Jaeger. These tools provide capabilities for collecting, storing, visualizing, and analyzing observability data. Additionally, cloud-based platforms like AWS CloudWatch and Azure Monitor offer managed services that simplify the setup and management of observability infrastructure.
– Microservices monitoring is suitable for known patterns that can be automated, while microservices observability is suitable for detecting unknown and creative failures. Microservices monitoring is a critical part of successfully managing a microservices architecture. It involves tracking each microservice’s performance to ensure there are no bottlenecks in the system and that the microservices are running optimally.
The Need for Microservices Observability:
1. Obfuscation: When creating microservices, your application becomes more distributed, the coherence of failures decreases, and we live in a world of unpredictable failure mode—also, the distance between cause and effect increases. For example, an outage at your cloud provider’s blob storage could cause huge cascading latency for everyone. In today’s environment, we have new cascading problems.
2. Inconsistency and highly independent: Distributed applications might be reliable, but the state of individual components can be much less consistent than in monolithic or non-distributed applications, which have elementary and well-known failure modes. In addition, each element of a distributed application is designed to be highly independent, and each component can be affected by different upstream and downstream components.
3. Decentralization: How do you look for service failures when a thousand copies of a service may run on hundreds of hosts? How do you correlate those failures so you can understand what’s going on?
Microservices Observability — Analytics for Distributed Systems
Microservices observability is the practice of instrumenting distributed systems so engineers can infer internal state from external outputs. As architectures scale across Kubernetes clusters and cloud regions, traditional monitoring fails because no single log or metric reveals the full story. Observability requires metrics, logs, and traces working together, unified by shared correlation IDs. This aligns with industry guidance that debugging microservices without observability is “effectively guessing” because failures propagate across multiple services and dependencies.
Metrics — High‑Level Health Signals
Metrics provide aggregated numeric measurements over time such as request rate, error rate, and latency percentiles. They serve as the first line of defense for alerting and dashboards. Metrics are ideal for identifying symptoms like p99 latency spikes or rising error rates. Tools such as Prometheus, Grafana, and Datadog are commonly used to scrape and visualize these metrics. Metrics alone cannot explain why a request failed, but they reveal where to start investigating.
Logs — Detailed Forensic Records
Logs capture discrete events such as errors, state changes, and important actions. In microservices, structured logging (JSON with consistent fields) is mandatory because plain text logs become unusable at scale. Logs should include timestamps, service names, trace IDs, and contextual metadata. Centralized log aggregation platforms like ELK, Loki, or cloud‑native logging systems allow engineers to pivot quickly during incident response. Logs help answer “what happened,” but without traces, they cannot reconstruct cross‑service request flows.
Traces — End‑to‑End Request Journey
Distributed tracing is the cornerstone of microservices observability. A unique trace ID is attached to each incoming request, and every service creates spans that record timing, operations, and status. These spans form a tree that reconstructs the full lifecycle of the request across all service boundaries. The W3C Trace Context standard defines how trace IDs propagate via traceparent and tracestate headers, enabling consistent correlation across services. Tools such as Jaeger, Zipkin, and Tempo visualize these traces, revealing bottlenecks, cascading failures, and dependency issues that metrics and logs alone cannot expose.
Unified Observability — Correlation Across All Signals
True observability emerges only when metrics, logs, and traces are correlated using shared context identifiers. Metrics show that latency spiked, logs show the error messages, and traces reveal which service caused the slowdown and how it propagated. This unified approach is essential because microservices failures are often subtle—partial degradation, retry storms, queue buildup, or downstream dependency issues. Observability allows teams to debug unknown failures, optimize performance, and maintain reliability across distributed systems.
Cloud Monitoring: Compute Engine & Ops Agent
What is an Ops Agent?
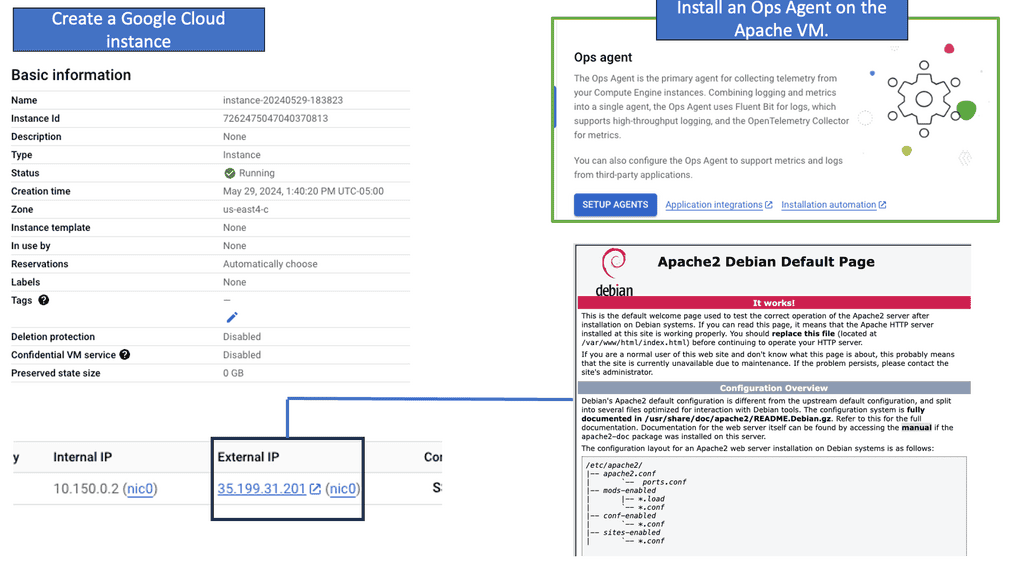
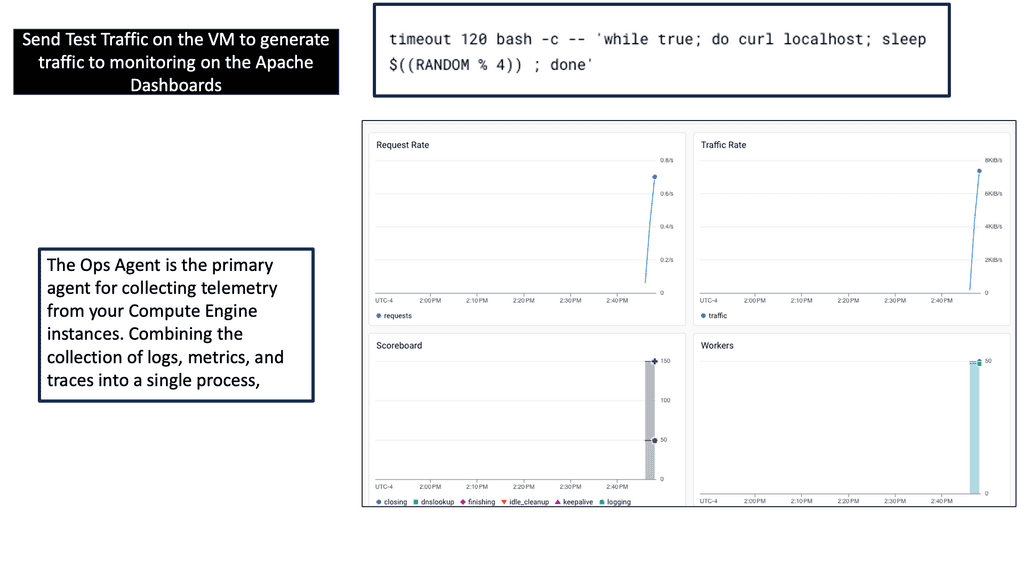
Ops Agent is a monitoring agent provided by Google Cloud that allows users to collect and export monitoring data from their Compute Engine instances. It acts as a bridge between your virtual machines and the Google Cloud Monitoring service, enabling real-time visibility into the health and performance of your infrastructure.
Ops Agent Advantages:
Ops Agent offers several advantages when it comes to monitoring a Compute Engine. Firstly, it provides a unified solution for collecting metrics, logs, and events from your instances. This means you can easily access and analyze all the necessary data in one centralized location. Additionally, Ops Agent offers resource-efficient monitoring, minimizing the impact on your instances’ performance while providing accurate and timely information.
Implementing Ops Agent:
To start monitoring your Compute Engine instances with Ops Agent, you need to follow a few simple steps. First, ensure that you have the necessary permissions and enable the necessary APIs in your Google Cloud project. Then, install Ops Agent on your instances using the provided installation script or by creating a custom image with Ops Agent pre-installed. Finally, configure the agent to collect the desired metrics, logs, and events based on your monitoring requirements.
 **Tools of the past: Log data and series statistics**
Traditionally, microservices monitoring has boiled down to two types of telemetry data: log data and time series statistics. Time series data is also known as metrics, as to make sense of a metric, you need to view a period. However, as we broke the software into tiny, independently operated services and distributed those fragmented services, the logs, and metrics we captured told you very little of what was happening to the critical path.
Understanding the critical path is the most important thing, as this is what the customer is experiencing. Looking at a single stack trace or watching CPU and memory utilization on predefined graphs and dashboards is insufficient. As software scales in-depth but breadth, telemetry data like logs and metrics alone don’t provide clarity; you must quickly identify production problems.
Components – Microservices Monitoring
Metrics
A. Metrics: This includes tracking metrics such as response time, throughput, and error rate. This information can be used to identify performance issues or bottlenecks. By collecting and interpreting metrics, organizations gain valuable insights into their microservices-based applications, enabling them to make informed decisions and proactively address potential problems.
Logs
B. Logs: Logging allows administrators to track requests, errors, and exceptions, which can provide deeper insight into the performance of microservices architecture. Logs provide a unique perspective by capturing valuable information about system events and activities. Logs act as a breadcrumb trail, documenting the inner workings of microservices.
One can detect anomalies, identify bottlenecks, and troubleshoot errors effectively by analyzing logs. Capturing log data from each microservice and centralizing it in a log management system allows comprehensive monitoring across the entire architecture. Logs can reveal valuable insights such as response times, error rates, and resource usage, empowering teams to make data-driven decisions.
Tracing
C. Tracing: Tracing provides a timeline of events within the system. This can be used to identify the source of issues or to track down errors. In microservices, tracing refers to capturing and analyzing the flow of requests as they traverse through different services. By tracing requests, we can gain valuable insights into the performance and behavior of our microservices architecture. From identifying latency issues to detecting errors and bottlenecks, tracing provides a holistic view of the entire request journey.
Alerts
D. Alerts: Alerts notify administrators when certain conditions are met. For example, administrators can be alerted if a service is down or performance is degrading . Configuring alerting rules is a critical step in microservices monitoring. It involves defining thresholds or conditions that, when breached, trigger alerts. These rules should be set based on the specific requirements of each microservice, considering factors like expected response time, error rates, or resource thresholds. Additionally, it’s essential to determine the appropriate severity levels for different alerts.
Finally, it is essential to note that microservices monitoring is not just limited to tracking performance. It can also detect security vulnerabilities and provide insights into the architecture.
By leveraging microservices monitoring, organizations can ensure that their microservices architecture runs smoothly and that any issues are quickly identified and resolved. This can help ensure the organization’s applications remain reliable and secure.
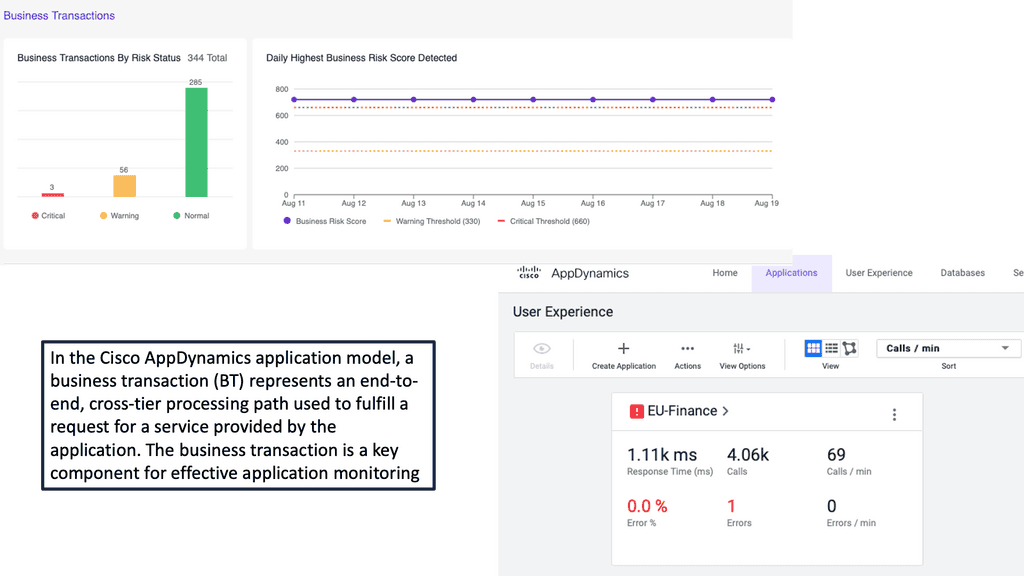
Example Product: Cisco AppDynamics
### Why Choose Cisco AppDynamics?
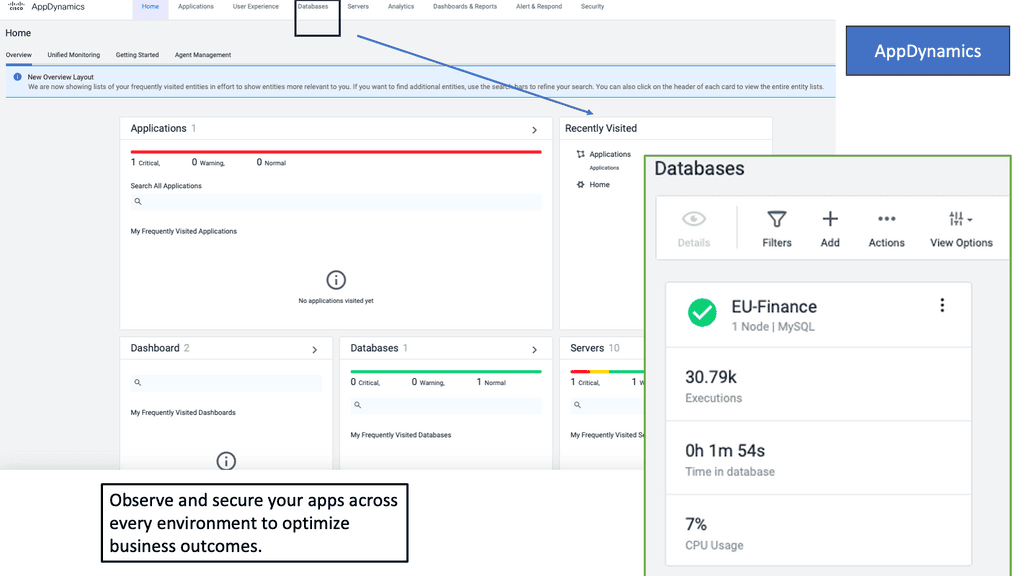
Cisco AppDynamics stands out in the crowded APM market for several compelling reasons. First, it offers end-to-end visibility into your application’s performance, from the end-user experience down to the underlying infrastructure. This comprehensive view allows you to pinpoint issues quickly and resolve them before they impact your users. Additionally, AppDynamics employs machine learning algorithms to detect anomalies and provide actionable insights, enabling proactive problem-solving.
### Key Features of Cisco AppDynamics
One of the standout features of AppDynamics is its ability to automatically map your application’s topology, giving you a clear picture of how different components interact. This dynamic mapping is invaluable for troubleshooting and optimizing your application. Another key feature is its robust alerting system, which notifies you of performance issues in real-time, allowing for immediate intervention. Furthermore, AppDynamics offers detailed analytics and reporting capabilities, helping you make data-driven decisions to improve your application’s performance.
### Integrations and Extensibility
Cisco AppDynamics is designed to integrate seamlessly with a wide range of technologies and platforms, making it a versatile tool for any IT environment. Whether you’re using cloud services like AWS or Azure, container orchestration platforms like Kubernetes, or traditional on-premise infrastructure, AppDynamics has you covered. The platform also supports custom extensions, allowing you to tailor it to your specific needs and workflows.
### Real-World Use Cases
Many organizations have successfully leveraged Cisco AppDynamics to achieve significant improvements in their application performance and user experience. For instance, a leading e-commerce company used AppDynamics to identify and resolve a critical bottleneck in their checkout process, resulting in a 20% increase in conversion rates. Similarly, a financial services firm utilized AppDynamics’ machine learning capabilities to predict and prevent potential outages, ensuring uninterrupted service for their customers.
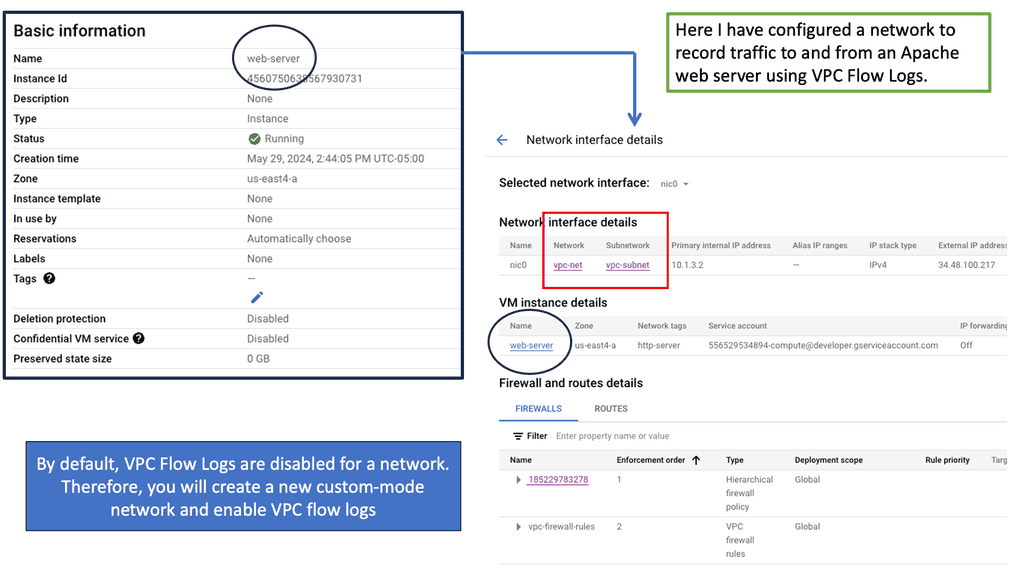
 Example: What are VPC Flow Logs?
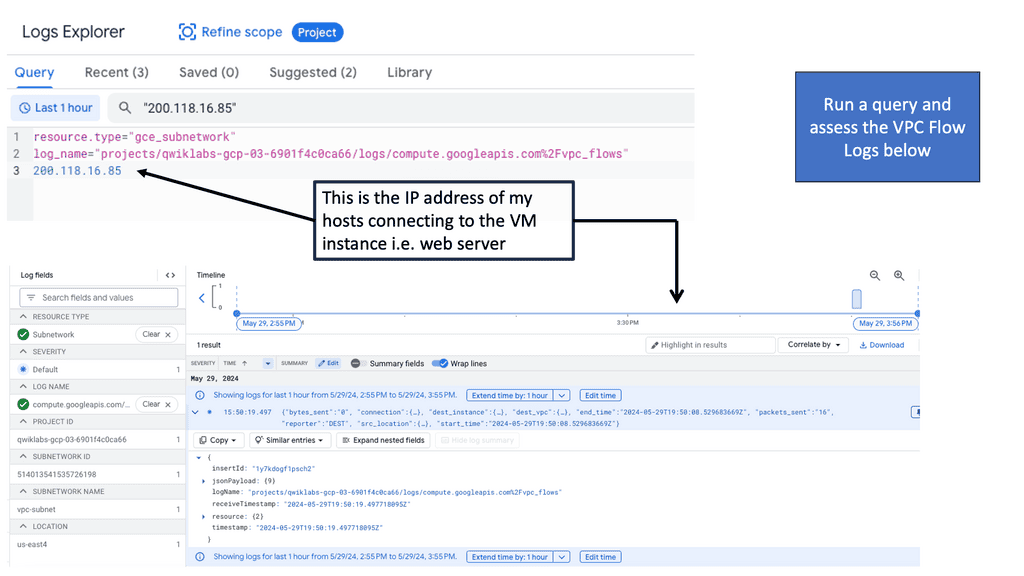
VPC Flow Logs provide detailed information about the IP traffic flowing through your Virtual Private Cloud (VPC). They capture metadata about each network flow, including source and destination IP addresses, ports, protocol, packet and byte counts, and more. Enabling VPC Flow Logs allows you to gain visibility into the traffic patterns within your VPC, allowing you to monitor, troubleshoot, and analyze network activity.
VPC Logs & Cloud Monitoring
Google Cloud offers a variety of powerful tools for analyzing VPC Flow Logs and extracting meaningful insights. One such tool is Cloud Logging, which allows you to view and search flow logs in real-time, set up alerts and notifications, and create custom dashboards for visualization. Additionally, you can leverage BigQuery, Google Cloud’s data warehouse solution, to store and analyze large volumes of flow log data using SQL queries and advanced analytics techniques.
Microservices Monitoring and Observability
– Containers, cloud platforms, scalable microservices, and the complexity of monitoring distributed systems have highlighted significant gaps in the microservices monitoring space that have been static for some time. As a result, you must fully understand performance across the entire distributed and complex stack, including distributed traces across all microservices.
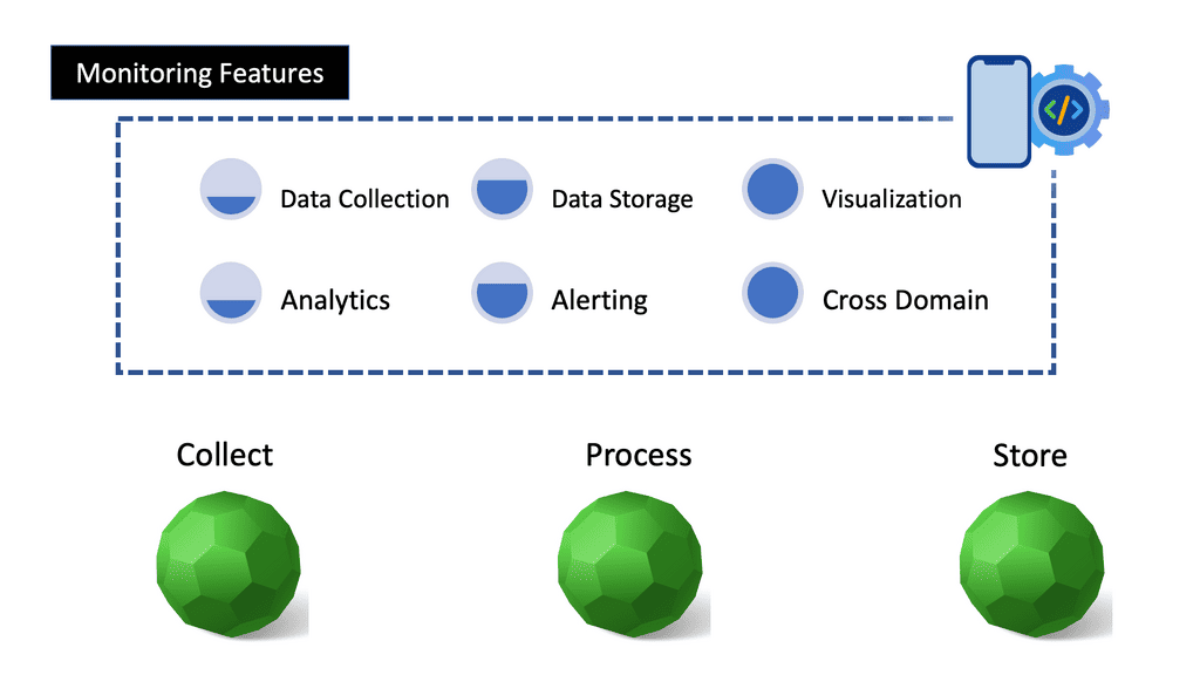
– So, to do this, you need a solution that can collect, process, and store data used for monitoring. And the data needs to cover several domains and then be combined and centralized for analysts.
– This can be an all-in-one solution that represents or bundles different components for application observability. The bundled solutions would be, for example, an Application Performance Monitoring (APM) that consists of application performance monitoring tools or a single platform, such as Prometheus, which lives in a world of metrics only.
Application Performance Monitoring:
Application performance monitoring typically involves tracking an application’s response time, the number of requests it can handle, and the amount of memory or other system resources it uses. This data can be used to identify any issues with application performance or scalability. Organizations can take corrective action by monitoring application performance to improve the user experience and ensure their applications run as efficiently as possible.
Identify Trends & Patterns:
Application performance monitoring also helps organizations better understand their users by providing insight into how applications are used and how well they are performing. In addition, this data can be used to identify trends and patterns in user behavior, helping organizations decide how to optimize their applications for better user engagement and experience.
**Microservices Monitoring Categories**
We have several different categories to consider. For microservices monitoring and Observability, you must first address your infrastructures, such as your network devices, hypervisors, servers, and storage. Then, you should manage your application performance and health.
Then, you need to monitor how to manage network quality and optimize when possible. For each category, you must consider white box and black box monitoring and potentially introduce new tools such as Artificial Intelligence (AI) for IT operations (AIOps).
Prevented approach to Microservice monitoring: AI and ML.
When choosing microservices observability software, consider a more preventive approach than a reactive one that is better suited for traditional environments. Prevented approaches to monitoring can use historical health and performance telemetry as an early warning with the use of Artificial Intelligence (AI) and Machine Learning (ML) techniques.
Whitebox Monitoring
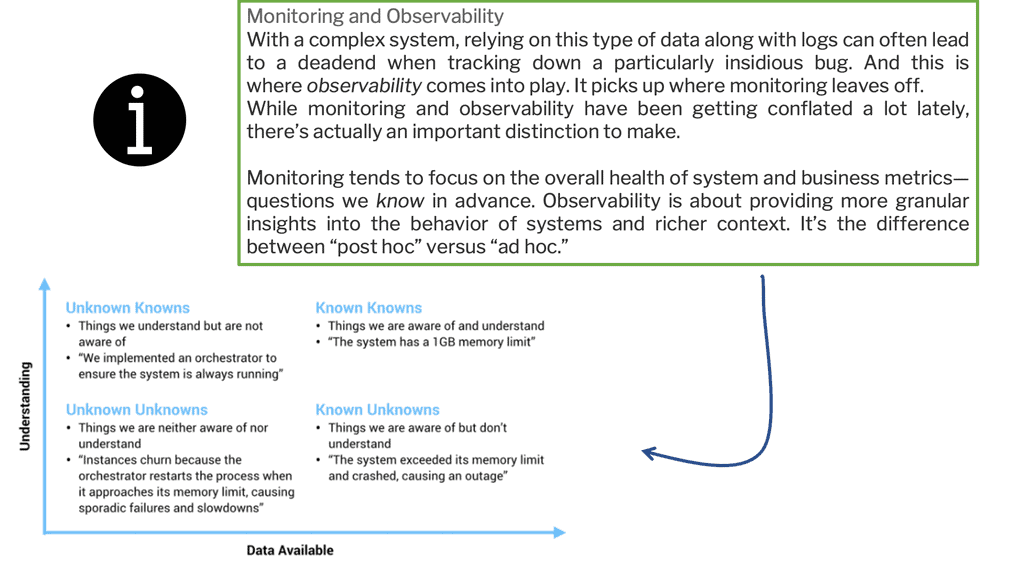
White box monitoring offers more details than a black box, which tells you something is broken without telling you why. White box monitoring details the why, but you must ensure the data is easily consumable. Black box microservices monitoring can help with predictable failures and known failure modes. Still, given the creative ways that applications and systems fail today, we must examine the details of white-box microservices monitoring. Complex applications fail in unpredictable ways, often termed black holes.
New failures & failure modes
Distributing your software presents new types of failure, and these systems can fail in creative ways and become more challenging to pin down. For example, the service you’re responsible for may be receiving malformed or unexpected data from a source you don’t control because a team manages that service halfway across the globe.
White box monitoring takes a different approach from black box monitoring. It uses Instrumentation, which exposes details about the system’s internals to help you explore these black holes and better understand the creative mode in which applications fail today.
Example: Application Latency
Application latency refers to the time it takes for an application to respond to a user’s request. It is influenced by various factors such as network latency, processing time, and database queries. Monitoring and analyzing application latency can help identify bottlenecks and optimize performance.
Google Cloud Service Mesh
**What is a Cloud Service Mesh?**
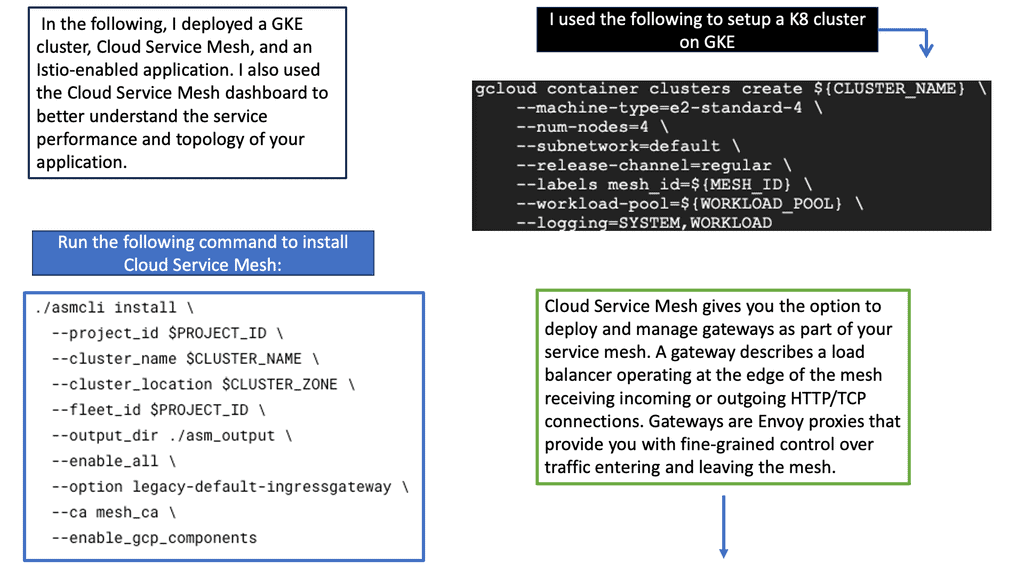
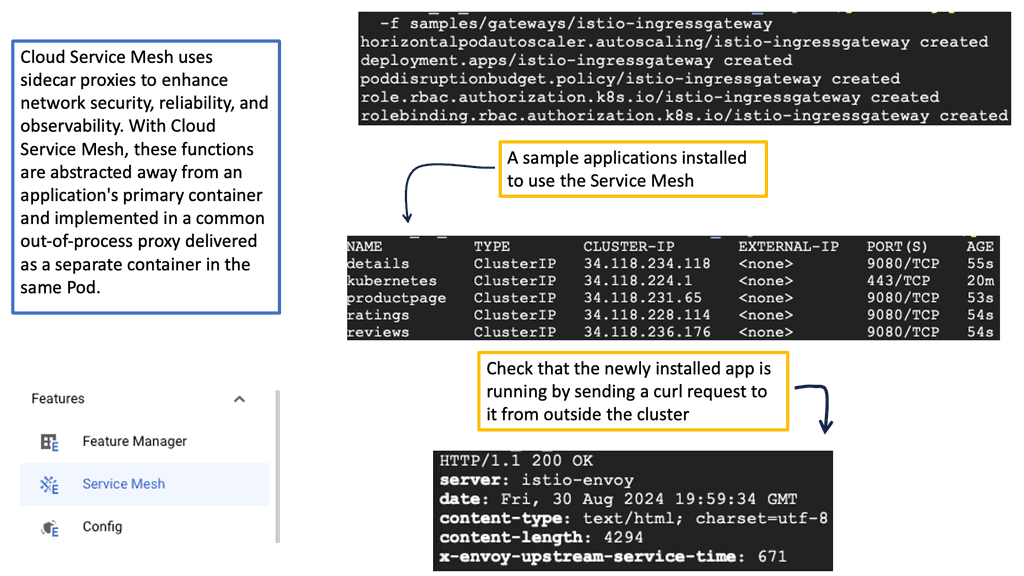
A cloud service mesh is a configurable infrastructure layer for microservices applications that makes communication between service instances flexible, reliable, and fast. It typically includes a set of network proxies deployed alongside application code, which handle tasks such as load balancing, service discovery, and authentication. The service mesh enables developers to focus on the business logic while the mesh handles communication concerns.
**Key Features and Benefits**
1. **Improved Security**: One of the main advantages of a service mesh is its ability to enhance security. By managing service-to-service authentication, authorization, and encryption, it ensures that data is protected during transit.
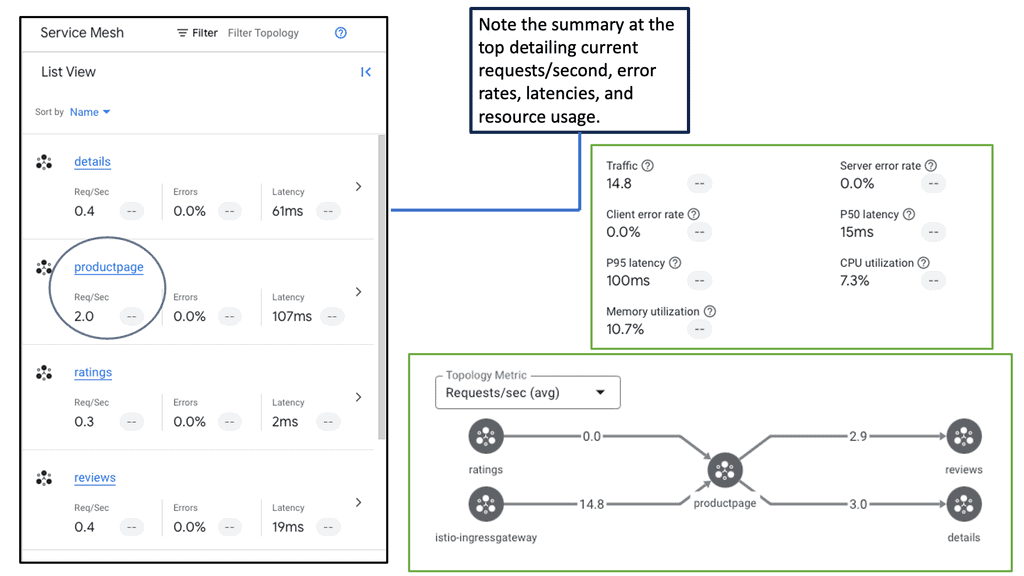
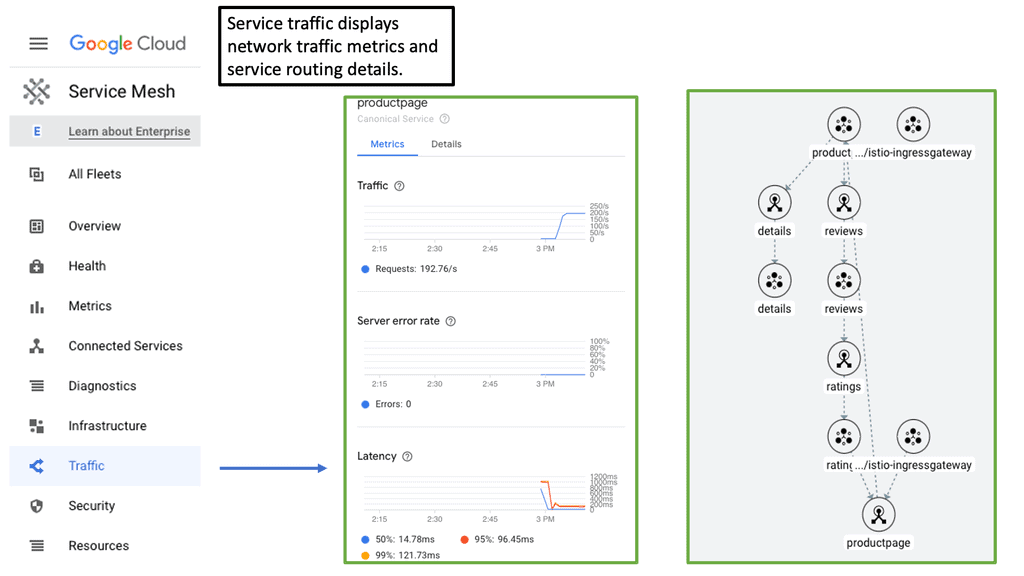
2. **Observability**: A service mesh provides comprehensive observability through metrics, logs, and traces. This enables better monitoring and troubleshooting, helping teams identify and resolve issues quickly.
3. **Traffic Management**: Service meshes allow for sophisticated traffic management capabilities, such as load balancing, traffic splitting, and fault injection. This ensures high availability and resilience of applications.
**Google’s Approach to Service Mesh**
Google has been a pioneer in developing service mesh technology, with its flagship product, Istio. Istio is an open-source service mesh that provides a uniform way to secure, connect, and monitor microservices. Google Cloud Platform (GCP) integrates Istio to offer these capabilities as part of its suite of managed services. This integration allows developers to leverage the power of service mesh without the operational overhead of managing it themselves.
**Case Studies and Real-World Applications**
Several organizations have successfully implemented Google’s service mesh solutions to optimize their operations. For instance, e-commerce giants and financial institutions have seen significant improvements in their system reliability and security by using Istio on GCP. These real-world applications highlight the practical benefits and transformative potential of adopting a service mesh.
Introducing Cloud Trace
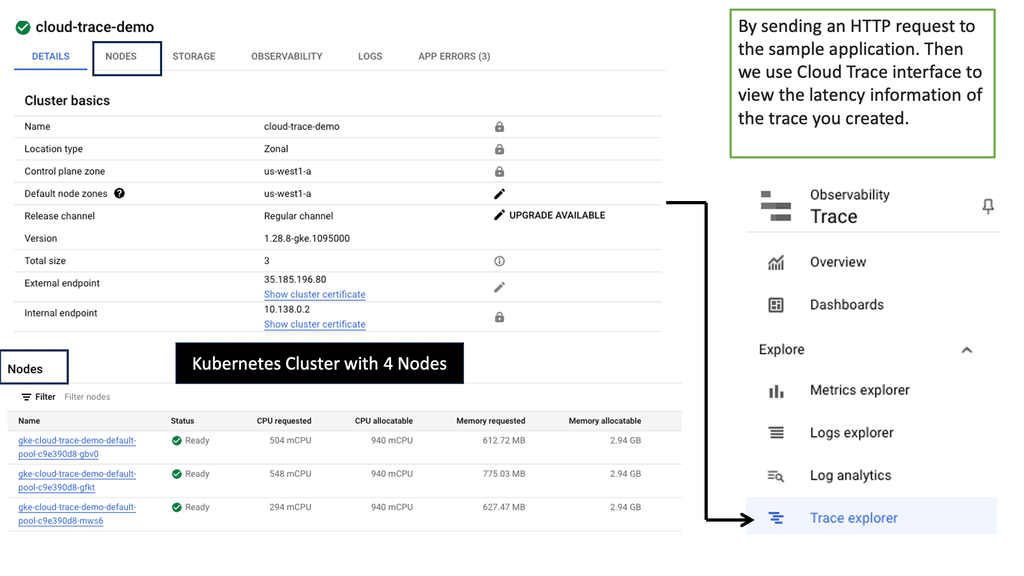
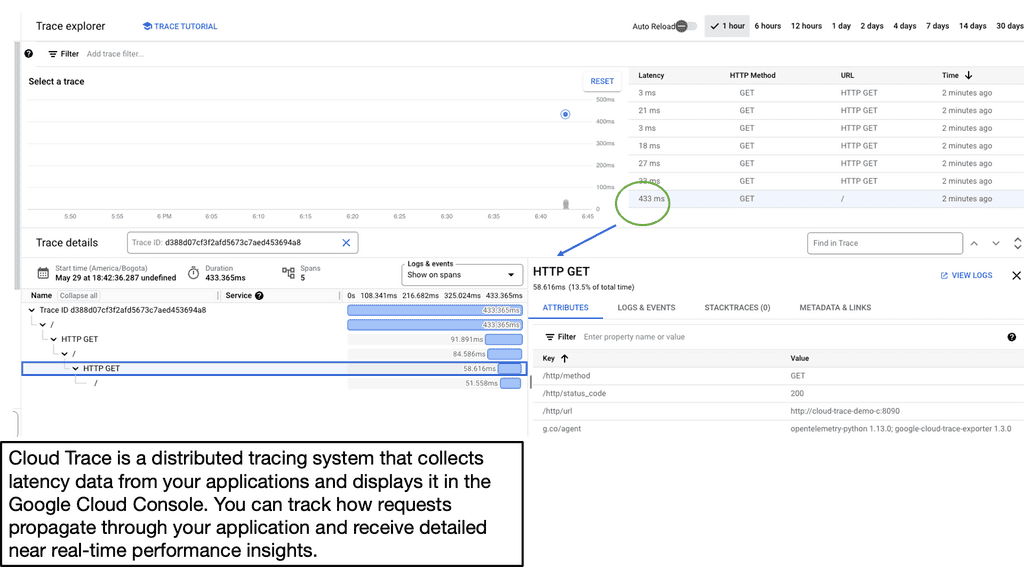
Cloud Trace is a comprehensive performance analysis tool provided by Google Cloud. It allows developers to trace and visualize the latency of requests across their applications. By collecting detailed information about each request, including timing data and associated events, Cloud Trace offers valuable insights into application performance.
Microservices Observability: Techniques
Collection, storage, and analytics: Regardless of what you are monitoring, the infrastructure, or the application service, monitoring requires 3 three inputs, more than likely across three domains. We require:
- Data collection,
- Storage, and
- Analysis.
We need to look at metrics, traces, and logs for these three domains or, let’s say, components. Out of these three domains, trace data is the most beneficial and excellent way to isolate performance anomalies for distributed applications. Trace data falls into distributed tracing brackets, enabling flexible consumption of capture traces.
First, you must establish a baseline comprising the four golden signals – latency, traffic, errors, and saturation. The golden signals are good indicators of health and performance and apply to most components of your environment, such as the infrastructure, applications, microservices, and orchestration systems.
I recommend automating this baseline and the automation alerts for deviations from baselines. However, if you collect too much data, you may be alerted to too much. Service Level Indicators (SLI) can help you determine what to alert about and what matters to the user experience.
The Effect on Microservices: Microservices Monitoring
When considering a microservice application, many believe this independent microservice is independent, but this is nothing more than an illusion. These microservices are highly interdependent, and a failure or slowdown in one service propagates across the stack of microservices.
A typical architecture may include a backend service, a front-end service, or maybe even a docker-compose file. So, several containers must communicate to carry out operations.
For a simple microservice architecture, we would have a simple front end minimizing a distributed application setup, where microservices serving static contents are at the front end. At the same time, the heavy lifting is done with the other service.
**Monolith and microservices monitoring**
We have more components to monitor than we had in the monolithic world. With their traditional monolithic, there are only two components to monitor. Then, we had the applications and the hosts.
Compared to the cloud-native world, we have containerized applications orchestrated by Kubernetes with multiple components requiring monitoring. These components include the hosts, Kubernetes platform, Docker containers, and containerized microservices.
**Distributed systems have different demands**
Today, distributed systems are the norm, placing different demands on your infrastructure than the classic, three-tier application. Pinpointing issues in a microservices environment is more challenging than with a monolithic one, as requests traverse both between different layers of the stack and across multiple services.
**The Challenges: Microservices**
The things we love about microservices are independence and idempotence, which make them difficult to understand, especially when things go wrong. As a result, these systems are often referred to as deep systems, not due to their width but their complexity.
We can no longer monitor their application by using a script to access the application over the network every few seconds, report any failures, or use a custom script to check the operating system to understand when a disk is running out of space.
Understanding saturation is an implemented signal, but it’s just one of them. It quickly becomes unrealistic for a single human, or even a group, to understand enough of the services in the critical path of even a single request and continue maintaining it.
**Node Affinity or Taints**
Microservices-based applications are typically deployed on dynamic and transient containers. This leaves an unpredictable environment where the pods get deployed and run unless specific intent is expressed using affinity or taints. However, pod placement can still be unpredictable. The unpredictable nature of pod deployment and depth of configuration can lead to complex troubleshooting.
Understanding GKE-Native Monitoring
Prometheus Integration
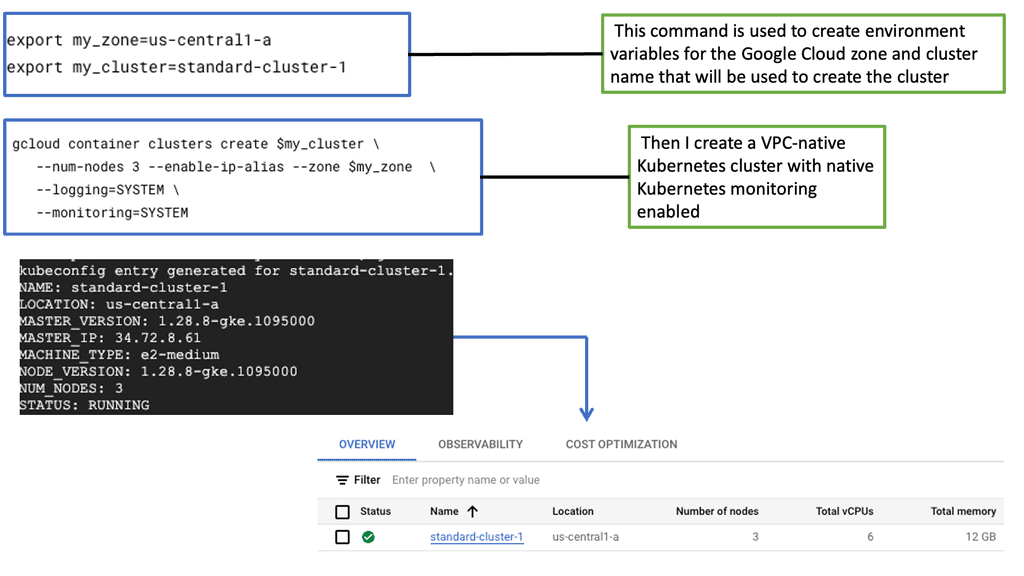
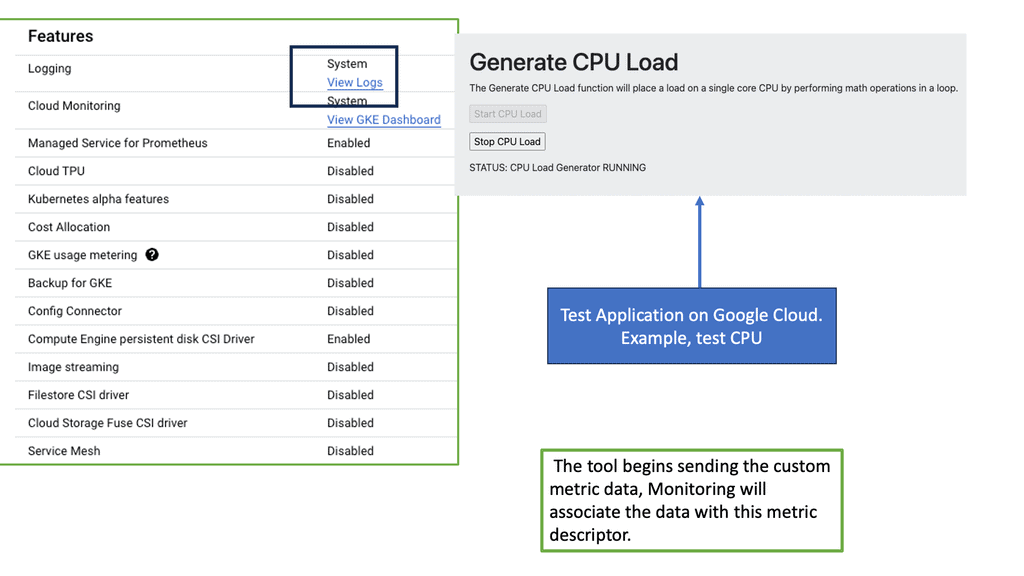
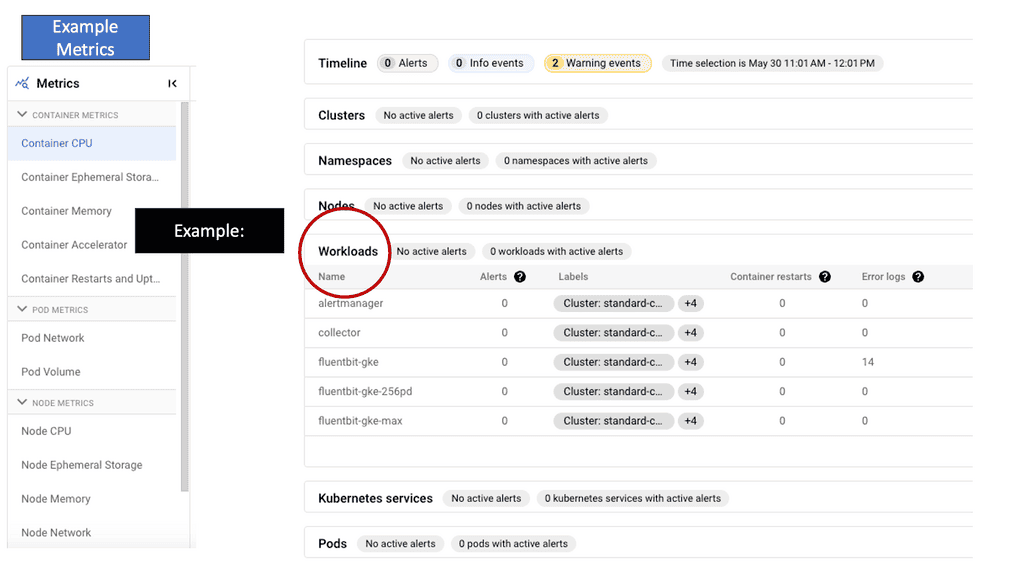
GKE-Native Monitoring provides a comprehensive and real-time view of the health and performance of your Kubernetes workloads. Leveraging built-in Prometheus integration enables automatic metrics collection and aggregation, offering deep insights into resource utilization, latency, errors, and more. With GKE-Native Monitoring, developers can quickly identify bottlenecks, optimize resource allocation, and proactively detect and troubleshoot issues before they impact users.
Stackdriver Logging
GKE-Native Monitoring integrates with Stackdriver Logging, Google Cloud’s powerful log management and analysis tool. By combining metrics and logs in a unified platform, developers and operators gain complete application observability. Stackdriver Logging provides advanced filtering and querying capabilities, allowing users to search and analyze logs across multiple Kubernetes clusters quickly. With log-based metrics and alerts, teams can set up proactive monitoring to detect anomalies or specific events, ensuring the reliability and performance of their applications.
The Beginnings of Distributed Tracing
Introducing Distributed Tracing
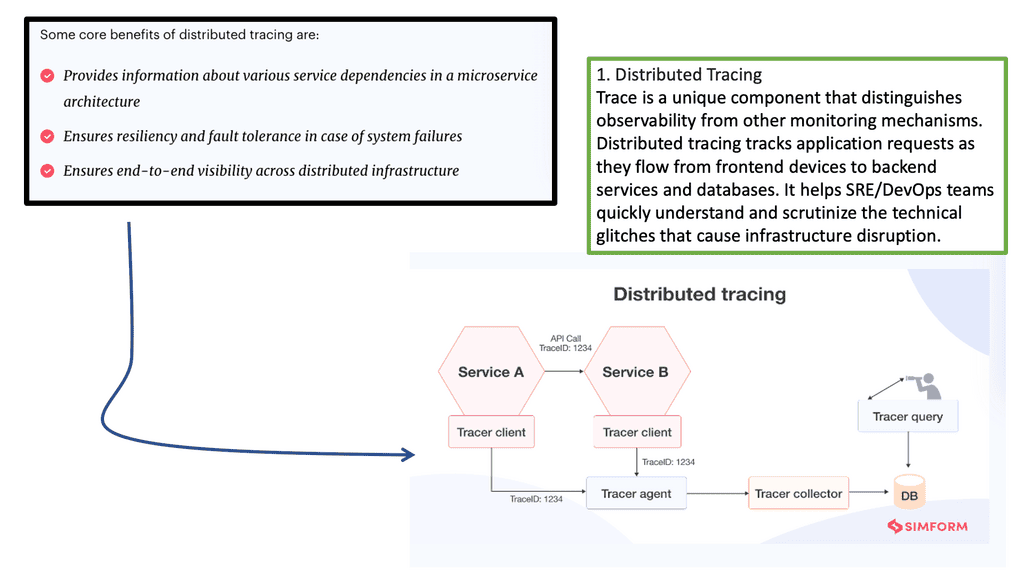
Distributed tracing is used in microservices and other distributed applications because a single operation touches many services. It is a type of correlated logging that helps you gain visibility into the process of a distributed software system. Distributed tracing consists of collecting request data from the application and then analyzing and visualizing this data as traces.
Tracing data, in the form of spans, must be collected from the application, transmitted, and stored to reconstruct complete requests. This can be useful for performance profiling, debugging in production, and root causes analysis of failures or other incidents.
A key point: The value of distributed tracing
Distributed tracing allows you to understand what a particular service is doing as part of the whole. Thus providing visibility into the operation of your microservice architecture. The trace data you generate can display the overall shape of your distributed system and view individual service performance inside a single request.
**Distributed Tracing Components**
- What is a trace?
Consider your software in terms of requests. Each component of your software stack works in response to a request or a remote procedure call from another service. So, we have a trace encapsulating a single operation within the application, end to end, and represented as a series of spans.
Each traceable unit of work within the operations generates a span. You can get trace data in two ways: through the Instrumentation of your service processes or by transforming existing telemetry data into trace data.
- Introducing a SPAN
We call each service’s work a span, as in the period it takes for the work to occur. These spans can be annotated with additional information, such as attributes, tags, or logs. So, we can have a combination of metadata and events that can be added to spans—creating effective spans that unlock insights into the behavior of your service. The span data produced by each service is then forwarded to some external process, where it can be aggregated into a trace, analyzed, and stored for further insights.
**Example: Open Tracing**
When you are ready to get started with distributed tracing, you will come across OpenTracing. OpenTracing is a set of standards exposed as frameworks. It’s a vendor-neutral API and Instrumentation for distributed tracing.
Open tracing does not give you the library but rather a set of rules and extensions that another library can adopt. Thus, you can use and swap around different libraries and expect the same things.
Microservices Architecture Example
Let’s examine an example of the request library for Python. So we have Requests, an elegant and simple HTTP library for Python. The request library talks to HTTP and will rely on specific standards; the standard here will be HTTP. So in Python, when making a “requests.get”.
The underlying library implementation will make a formal HTTP request using the GET method. Thus, the HTTP standards and specs lay the ground rules for what is expected from the client and the server.
The OpenTracing projects do the same thing. They set out the ground rules for distributed tracing, regardless of the implementation and the language used. They have several liabilities available in nine languages: Go, JavaScript, Java, Python, Ruby, PHP, Objective-C, and C++.
For example, the OpenTracing API for Python implements open tracing. This set of standards for tracing with Python provides examples of what Instrumentation should look like and common ways to start a trace.
Connect the dots with distributed tracing.
And this is a big difference in why you would use tracing and logging. Tracing allows you to connect the dots from one end of the application to the other end of the application. So, if you are starting a request on the front end and want to see how that works on the backend, that works. A trace and child traces connected will have a representation.
Visual Representation with Jaeger: You may need to use Jaeger for the visual representation. Jaeger is an open-source end-to-end visual representation of tracing that allows you to monitor and troubleshoot transactions in complex distributed systems.
So, we have a dashboard where we can interact and search for traces. Jaeger addresses problems such as monitoring distributed tracing, performance and latency optimizations, root cause analysis, service dependency analysis, and distributed content propagation. It has clients in different languages.
So, for example, if you are using Python, there will be client library features for Python.
The Role of OpenTelementry
OpenTelementry: We also have OpenTelementry, which is similar. It is described as an observability framework for cloud-native software and is in beta across several languages. It is geared towards traces, metrics, and logs, so it does more than OpenTracing.
Observability means a system’s internal states can be inferred from its external outputs. Therefore, the tools used to complete an Observability system help understand the relationships between causes and effects in distributed systems.
The term Observability is borrowed from the control theory. It suggests a holistic, data-centric view of microservices monitoring that enables exploration capabilities and identifying unknown failures with the more traditional anomaly detection and notification mechanisms.
Goal: The ultimate goal of Observability is to :
- Improving baseline performance
- Restoring baseline performance (after a regression)
By improving the baseline, you improve the user experience. This could be because performance often means request latency for user-facing applications. Then, we have performance regressions, including application outages, which can result in a loss of revenue and negatively impact the brand. The regressions’ time accepted comes down to user expectations. What is accessible, and what is in the SLA?
With chaos engineering tests, you understand your limits and the new places where your system and applications can be made. Chaos Engineering helps you know your system by introducing controlled experiments when debugging microservices.
A key point: Massive amount of data
Remember that instrumenting potentially generates massive amounts of data, which can cause challenges in storing and analyzing. You must collect, store, and analyze data across the metrics, traces, and logs domains. Then, you need to alert me to these domains and what matters most, not just when an arbitrary threshold is met.
The role of metrics: Most people know a metric comprising a value, timestamp, and metadata. Metrics are collections of statistics that need to be analyzed over time. A single instance of a metric is of limited value. Examples include request rate, average duration, and queue size. These values are usually captured as time series so that operators can see and understand changes to metrics over time.
Add labels to metric: We can add labels as key-value pairs to better understand metrics. The labels add additional context to this data point. So, the label is a key-value pair indexed with the metrics as part of the injection process. In addition, metrics can now be broken down into sub-metrics.
As we enter the world of labels and tags for metrics, we need to understand the effects this may have on Cardinality. While each indexed label value adds time series, this will come at storage and processing costs. Therefore, we use Cardinality to understand the impact of labels on a metric store.
Aggregated metrics: I continue to see the issue that metrics are typically aggregated every minute or even six to twelve times per minute. However, metrics must be aggregated and visualized within at most one minute but ideally even more quickly. Key questions are: What is the window across which values are aggregated? How are the windows from different sources aligned?
A key point: The issues of Cardinality
Aggregated Metrics allow you to get an aggregate understanding of what’s happening to all instances of a given service and even narrow your query to specific groups of services but fail to account for infinite Cardinality. Due to issues with “high-cardinality” within a time series storage engine, it is recommended to use labels rather than hierarchical naming for metrics.
Prometheus Monitoring
Examples: Push and Pull
So, to get metric, you need to have a push or pull approach. A push agent transmits data upstream and, more than likely, on a scheduled basis. A pull agent expects to be polled. Then, we have Prometheus and several Prometheus metric types. We have a Prometheus server with a pull approach that fits better into larger environments.
Prometheus does not use the term agent and has what is known as exporters. They allow the Prometheus server to pull metrics back from software that cannot be instrumented using the Prometheus client libraries.
a) Prometheus Kuberentes
Prometheus Kubernetes is an open-source monitoring platform that originated at SoundCloud and was released in 2012. Its capabilities include metric collection, storage, data analyses, and visualizations. For visualizations, we can use Prometheus and Grafana.
b) Storing Metrics
You can sort metrics that are time-series data in a general-purpose relational database. However, they should be stored in an optimized repository for storing and retrieving time-series data. We have several time-series storage options, such as Altas, InfluxDB, and Prometheus. Prometheus stands out, but keep in mind that, as far as I’m aware, there is no commercial support and limited professional services for Prometheus.
c) The Role of Logs
Then, we have highly detailed logs. Logs can be anything, unlike metrics, which have a daily uniform format. However, logs do provide you with why something is broken. Logs capture activity that can be printed to the screen or sent to a backend to be centrally stored and viewed.
There is very little standard structure to logs apart from a timestamp indicating when the event occurred. There is minimal log schema, and log structure will depend on how the application uses it and how developers create logs.
d) Emitting Logs
Logs are emitted by almost every entity, such as the basic infrastructure, network and storage, servers and computer notes, operating system nodes, and application software. So, there are various log sources and several tools involved in transport and interpretation, making log collection a complex task. However, remember that you may assume a large amount of log data must be stored.
Search engines such as Google have developed several techniques for searching extensive datasets using arbitrary queries, which have proved very efficient. All of these techniques can be applied to log data.
e) Logstash, Beats, and FluentD
Logstash is a cloud-scale ingestion tool and is part of the Elasticsearch suit. However, there have been concerns with the performance and scalability of Logstash, which brings us to the lightweight version of Beats. So, if you don’t need the sophisticated data manipulation and filtering of Logstash, you can use Beasts. FluentD provides a unified logging layer or a way to aggregate logs from many different sources and distribute them to many destinations with the ability to transform data.
f) Storing Logs
Structure data such as logs and events are made of key-value pairs, any of which may be searched. This leads us to repositories called nonrelational or no SQL databases. So, storing logs represents a different storage problem from that of metrics. Examples of KV databases include Memcache and Redis.
However, they are not a good choice for log storage due to the inefficiency of indexing and searching. The ELK stack has an indexing and searching engine, a collector, a Logstash, a visualization tool, and the dominant storage mechanism for soft log and event data.
A key point: Analyze logs with AI
So, once you store the logs, they need to be analyzed and viewed. Here, you could, for example, use Splunk. Its data analysis capabilities range from security to AI for IT operations (AIOps). Kibana, part of the Elastic Stack, can also be used.

- Fortinet’s new FortiOS 7.4 enhances SASE - April 5, 2023
- Comcast SD-WAN Expansion to SMBs - April 4, 2023
- Cisco CloudLock - April 4, 2023