
WAN Monitoring — From Link Health to Application Experience
WAN monitoring is no longer simply a question of whether a circuit or interface is up or down. Modern WANs combine Internet, MPLS, broadband, cellular, cloud connectivity and SD-WAN overlays, creating multiple paths that can change according to policy and real-time network conditions. Effective monitoring therefore needs to explain not only whether connectivity exists, but whether the path is delivering the expected application experience.
Collect telemetry from links, tunnels, routers, applications and cloud paths.
Quantify latency, jitter, packet loss, utilisation and availability against a baseline.
Connect path conditions with routing, application behaviour and policy decisions.
Identify degradation, investigate the cause and determine whether traffic should move.
Monitor the path, not just the device
A router can be healthy while the service delivered through it is degraded. WAN monitoring must therefore combine infrastructure state with path-quality telemetry and application context. This becomes especially important with SD-WAN, where application traffic may be dynamically steered across several transports.
Is the WAN actually healthy — or is it simply still reachable?
This distinction separates basic availability monitoring from engineering-grade observability. A healthy monitoring system should expose the evidence required to explain why application performance changes.
From telemetry collection to WAN decision-making
The sections that follow examine WAN monitoring as an engineering workflow: how telemetry is collected, how performance signals are interpreted, how overlay and underlay conditions are correlated, and how brownouts can be investigated before they become complete outages. The goal is not simply to display more metrics, but to turn those metrics into operational evidence.
WAN Monitoring Explorer
WAN health is not a single number. Engineers correlate latency, jitter, packet loss and utilisation to understand the quality of a WAN path.
WAN Path
TELEMETRY LIVESignal Analysis
Latency measures path response time
Latency shows how long it takes traffic to travel across the monitored path and return. It is one of the fundamental indicators of WAN path quality.
Example signal
RTT remains at 42 ms and is within the normal baseline.
Move from visibility and measurement through correlation, underlay analysis, brownout investigation and performance-based path decisions.
SEE — WAN Observability Architecture
Modern WAN monitoring is an observability chain rather than a single dashboard. A useful view must connect the physical and logical network to the path being used, the application consuming that path, and the policy controlling the decision. Without that relationship, engineers can see individual metrics without understanding what the metrics mean operationally.
A latency measurement becomes significantly more useful when it is associated with a source, destination, path, interface, tunnel, application and expected baseline. The objective is not to collect the most telemetry — it is to build enough evidence to explain the behaviour of the WAN.
The WAN Observability Pipeline
Four Views Must Agree
WAN visibility becomes much more powerful when multiple layers describe the same service path. A tunnel can remain established while its underlying transport is congested. A router can report healthy interfaces while an application experiences unacceptable delay. The monitoring architecture therefore needs to preserve the relationship between these layers.
Circuits, Internet links, MPLS, broadband, cellular and provider paths. This layer exposes availability, capacity and transport quality.
SD-WAN tunnels, VPNs and virtual paths. Overlay state explains which logical path is carrying traffic and which policy is controlling it.
Application reachability and performance provide the user-facing outcome that infrastructure metrics alone cannot fully describe.
Routing protocols, SD-WAN policy and path-selection logic determine how available paths are actually used.
Questions an Engineer Should Be Able to Answer
Evidence Sources
Different telemetry mechanisms answer different questions. They should be treated as complementary evidence rather than interchangeable data sources.
show interfaces
show ip route
show ip sla statistics
show flow monitor
SD-WAN telemetry / API
SNMP polling can expose device and interface state. Streaming telemetry can provide higher-frequency operational data. Flow telemetry describes traffic behaviour, while active probes measure the quality of a path between defined endpoints. The strongest WAN monitoring model combines these sources so that an apparently healthy link can still be investigated when application performance has degraded.
Trace the Evidence Pipeline
Select each stage to see what evidence is produced, how it gains context, and where an engineer can determine whether the WAN is actually healthy.
WAN observability begins at the points where evidence can be generated. Device counters describe infrastructure state, flow records describe traffic behaviour, active probes measure path quality and application telemetry exposes service experience.
Availability tells us whether traffic can reach its destination. Performance telemetry tells us whether the path is actually healthy.
MEASURE — WAN Performance Signals
Once telemetry is available, the next engineering task is measurement. WAN health cannot be represented by a single UP or DOWN state because a path can remain reachable while latency, jitter, packet loss or congestion progressively degrade application performance. Effective monitoring therefore measures both availability and quality against an expected baseline.
A latency value of 50 ms may be perfectly normal for one path and highly abnormal for another. Monitoring becomes operationally useful when current behaviour is compared with the normal performance of that specific path, service and time period.
The Core WAN Signals
Measures how long traffic takes to travel between defined endpoints. Increasing delay can indicate congestion, path changes or transport conditions even when reachability remains intact.
Measures variation in packet delay. High or unstable jitter can affect real-time services such as voice, video and interactive applications.
Shows packets that fail to reach the destination. Even relatively small amounts of sustained loss can significantly affect application performance.
Indicates how much available capacity is being consumed. High utilisation becomes especially important when it correlates with rising latency, queueing or packet loss.
Availability vs Performance
Availability answers whether the path is reachable. Performance asks whether the path is delivering the expected service quality. These are related but fundamentally different measurements.
Build a Useful Baseline
A baseline represents normal behaviour for a path or service. It should account for recurring traffic patterns, business hours, application demand and known network conditions rather than treating every measurement as an independent event.
From Signal to Operational Meaning
Individual metrics rarely provide the complete diagnosis. The engineering value comes from combining them and asking whether several signals changed together.
The more useful question is: “Is this path performing within the range expected for the service it carries?” That distinction is central to detecting WAN brownouts before they become complete outages.
Measure the Path — Not Just the Link
Adjust the live performance signals and see how latency, jitter, packet loss and utilisation combine to describe the condition of the WAN path.
CORRELATE — Telemetry and Application Behaviour
Individual telemetry sources describe different parts of the WAN. Correlation connects those observations so that engineers can determine whether a change in network behaviour is actually affecting the service. This is the point where interface counters, flow records, path measurements, routing state and application experience become one operational picture.
Rising utilisation alone does not prove that congestion is affecting an application. Rising utilisation combined with increased latency, packet loss and application response time creates a much stronger causal relationship.
The Correlation Chain
Interfaces, queues, routing state and device health establish what the network is doing.
Active probes and telemetry expose latency, jitter, loss and path changes between defined endpoints.
Flow data shows which applications, destinations and traffic classes are consuming the available path.
Application response, transaction success and user-facing performance establish whether the network condition matters to the service.
What Each Telemetry Source Tells You
Telemetry types should not be treated as interchangeable. Each provides evidence at a different layer of the system.
Application Context Completes the Picture
Network telemetry can show that a path changed. Application telemetry helps determine whether that change translated into a service impact.
Correlation Turns Metrics into a Diagnosis
Consider a branch accessing a cloud application. A single metric may be ambiguous. The relationship between several measurements can make the operational condition much clearer.
Correlated Observation
Engineering Interpretation
Engineers should still validate the path, routing state, transport conditions and application behaviour before declaring a root cause. The objective is to move from isolated metrics toward a defensible explanation of what changed, where it changed and what service was affected.
Build the Evidence — One Signal at a Time
Select the observations available to the engineer. The correlation engine shows how confidence changes as network, path, traffic and application evidence are combined.
COMPARE — Overlay vs Underlay
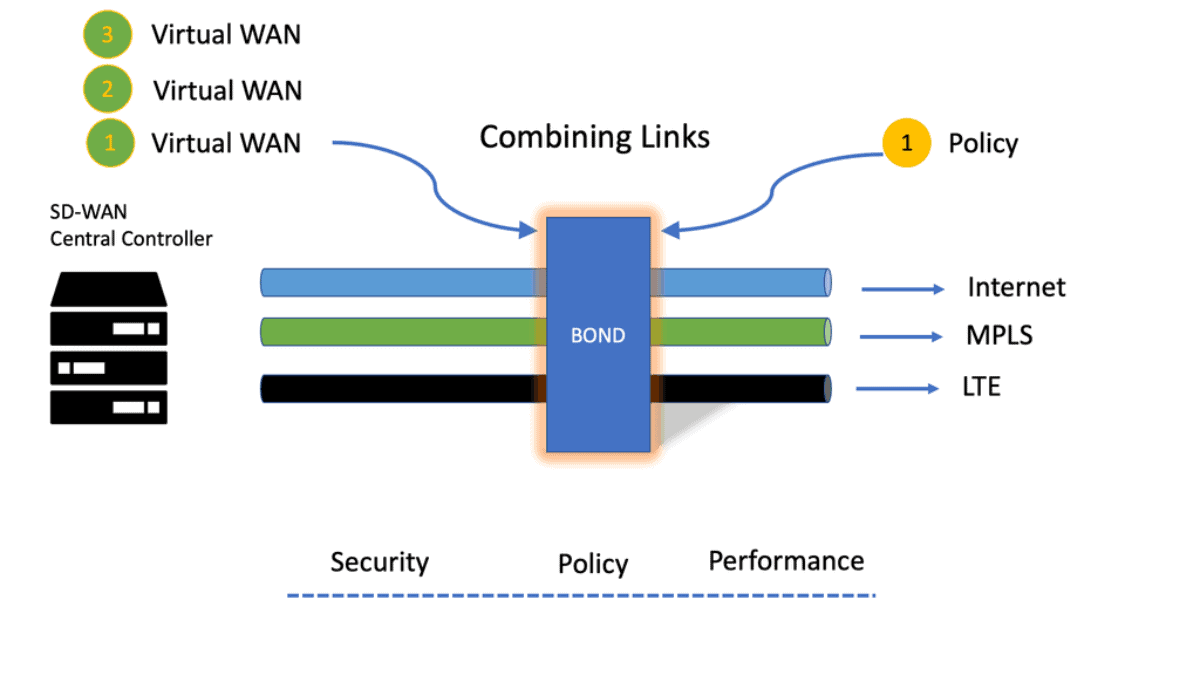
WAN monitoring becomes more useful when engineers separate the logical path from the physical or transport path underneath it. An SD-WAN tunnel can remain established while the Internet, MPLS, broadband or cellular transport carrying that tunnel is experiencing degradation.
Internet, MPLS, broadband, LTE/5G or other transport connectivity. Engineers monitor reachability, latency, jitter, packet loss, utilisation and interface health.
IPsec tunnels, SD-WAN paths, VPNs and policy-controlled logical connections. The overlay provides the service abstraction used to carry application traffic across the available transports.
When an overlay tunnel reports UP but users report poor performance, do not treat the tunnel state as proof that the WAN is healthy. Compare overlay state, underlay path measurements and application behaviour. The objective is to identify the first layer where the expected performance relationship breaks down.
Overlay vs Underlay — Find the Hidden Degradation
Switch monitoring views to see why tunnel state alone is not enough. The overlay can remain established while the transport path underneath it develops latency, jitter or packet loss.
INVESTIGATE — WAN Brownout
A WAN brownout occurs when connectivity remains available but the quality of service has deteriorated enough to affect applications. Unlike a hard outage, the interface, tunnel and routing system may continue to report healthy states while users experience slower or unreliable service.
Interface or path becomes unavailable, sessions fail and routing may reconverge. The failure is usually visible through availability monitoring.
The path remains reachable while latency, jitter, packet loss or congestion increases. Application performance becomes the critical evidence.
Verify interfaces, tunnels and routing remain operational.
Compare current latency, jitter, loss and utilisation with normal operating behaviour.
Determine whether degraded path conditions coincide with application or traffic-performance changes.
Check routing, queues, capacity and alternate paths before declaring the root cause.
The evidence indicates that connectivity remains available but path quality has moved significantly away from its baseline. Elevated latency, jitter and packet loss provide stronger evidence of degradation than interface state alone.
The final application symptom may be several steps removed from the original network condition. Start with the earliest measurable deviation from baseline, then correlate forward through the path, overlay, routing and application layers. This produces a defensible diagnosis rather than simply identifying the last visible symptom.
WAN Brownout Investigation Lab
A simulated WAN incident is degrading application performance while connectivity remains available. Collect the right evidence, correlate the signals and identify the condition before declaring the root cause.
Collect availability, path-quality and application evidence before reaching a conclusion.
A reachable path can still violate application performance expectations.
OPTIMIZE — Performance-Based Path Selection
Monitoring becomes operationally valuable when the collected evidence can influence path selection. Modern WANs may provide multiple transports, allowing traffic to be steered according to application requirements, policy and measured path quality rather than simply selecting the path that is administratively preferred.
Collect latency, jitter, packet loss, utilisation and availability measurements for each candidate transport.
Voice, interactive SaaS, bulk transfer and general web traffic can have very different performance requirements.
Select or steer traffic toward a path that satisfies the relevant SLA while respecting operational policy and available capacity.
Establish acceptable latency, jitter, loss and availability for the application or traffic class.
Compare live path telemetry rather than relying only on static circuit characteristics.
Combine path quality with business, security and routing policy before selecting a path.
Move eligible traffic toward a suitable path when the platform supports policy-based performance steering.
The progression is straightforward: observe the paths, measure their behaviour, understand the application's requirements, evaluate policy and then make a path-selection decision. Monitoring therefore becomes more than a dashboard function — it becomes an input into how the WAN operates.
Performance-Based Path Selection
Select an application profile and compare the available WAN paths. The decision engine evaluates measured path quality against the application's performance requirements rather than choosing purely from static administrative preference.
Overlay vs Underlay Visibility
An SD-WAN tunnel can remain healthy while the physical network underneath it is experiencing congestion, loss or delay. Effective WAN monitoring needs visibility into both layers.
WAN Path Model
BOTH LAYERS VISIBLEMonitoring View
Monitor both the tunnel and the transport
Overlay telemetry tells you whether the SD-WAN service is established and forwarding traffic. Underlay telemetry helps explain the quality of the physical or provider path carrying that traffic.
WAN Monitoring Principle
A healthy overlay does not automatically mean the underlying transport is healthy. Monitoring both layers helps distinguish tunnel problems from transport problems.
WAN Brownout Investigation
A WAN can be technically "up" while application performance is degrading. Investigate the evidence and determine what is happening to the path.
Application performance has degraded, but both WAN links are UP.
No interface is down and the SD-WAN tunnel remains established. Examine the telemetry before deciding what is causing the problem.
Investigation Evidence
INVESTIGATECompare the current measurements with the established baseline. Look for correlated changes rather than relying on link state alone.
Physical interface remains operational.
Round-trip delay has increased significantly.
Packet delay has become significantly less stable.
Packet delivery has deteriorated.
Link consumption has increased substantially.
Logical overlay remains established.
Performance timeline
42 ms / 0.2% Degradation begins
RTT rises Current
168 ms / 3.4%
Engineer's Diagnosis
What is the most likely network condition?
The links and overlay tunnel remain operational. Focus on the combination of performance signals rather than the binary UP/DOWN state.
Investigation result
Select an answer and check the evidence.
The Correlation Chain

- Fortinet’s new FortiOS 7.4 enhances SASE - April 5, 2023
- Comcast SD-WAN Expansion to SMBs - April 4, 2023
- Cisco CloudLock - April 4, 2023