
The Role of Distributed Systems
A – Several decades ago, only a handful of mission-critical services worldwide were required to meet the availability and reliability requirements of today’s always-on applications and APIs. In response to user demand, every application must be built to scale nearly instantly to accommodate the potential for rapid, viral growth. Almost every app built today—whether a mobile app for consumers or a backend payment system—must meet these constraints and requirements.
B – Inherently, distributed systems are more reliable due to their distributed nature. When appropriately designed software engineers build these systems, they can benefit from more scalable organizational models. There is, however, a price to pay for these advantages.
C – Designing, building, and debugging these distributed systems can be challenging. A reliable distributed system requires significantly more engineering skills than a single-machine application, such as a mobile app or a web frontend. Regardless, distributed systems are becoming increasingly important. There is a corresponding need for tools, patterns, and practices to build them.
D – As digital transformation accelerates, organizations adopt multicloud environments to drive secure innovation and achieve speed, scale, and agility. As a result, technology stacks are becoming increasingly complex and scalable. Today, even the most straightforward digital transaction is supported by an array of cloud-native services and platforms delivered by various providers. To improve user experience and resilience, IT and security teams must monitor and manage their applications.
**Key Components of Observability**
Observability in distributed systems typically relies on three pillars: logs, metrics, and traces. Logs provide detailed records of events within the system, offering context for debugging issues. Metrics offer quantitative data, such as CPU usage and request rates, allowing teams to monitor system health and performance over time. Traces enable the tracking of requests as they move through the system, helping to pinpoint where latency or failures occur. Together, these components create a comprehensive picture of the system’s state and behavior.
**Challenges in Achieving Observability**
While observability is essential, achieving it in distributed systems is not without its challenges. The sheer volume of data generated by these systems can be overwhelming. Additionally, correlating data from disparate sources to form a cohesive narrative requires sophisticated tools and techniques. Moreover, ensuring that observability doesn’t introduce too much overhead or affect system performance is a delicate balancing act. Organizations must invest in the right infrastructure and expertise to tackle these challenges effectively.
**Best Practices for Enhancing Observability**
To maximize observability in distributed systems, organizations should adopt several best practices. Firstly, they should implement centralized logging and monitoring solutions that can aggregate data from all system components. Secondly, leveraging open standards like OpenTelemetry can facilitate consistent data collection and integration with various tools. Thirdly, incorporating automated alerting and anomaly detection can help teams proactively address issues before they impact users. Lastly, fostering a culture of collaboration between development and operations teams can ensure that observability is an ongoing, shared responsibility.
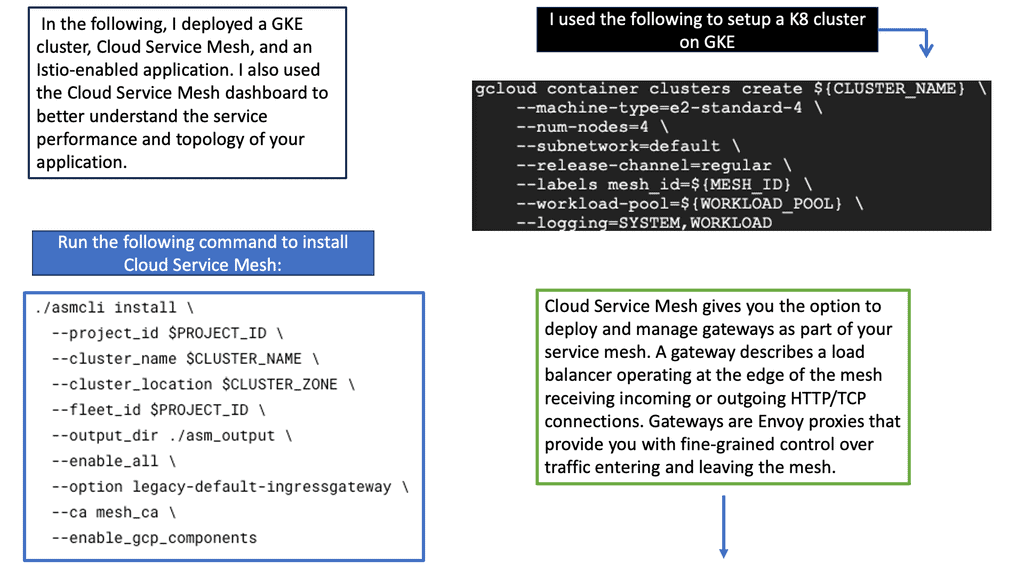
Cloud Service Mesh
### What is a Cloud Service Mesh?
A Cloud Service Mesh is a dedicated infrastructure layer that facilitates service-to-service communication in a microservices architecture. It abstracts the complex communication patterns between services into a manageable, secure, and observable framework. By deploying a service mesh, organizations can effectively manage the interactions of their microservices, ensuring seamless connectivity, security, and resilience.
### Key Benefits of Implementing a Cloud Service Mesh
1. **Enhanced Security**: A service mesh provides robust security features such as mutual TLS authentication, which encrypts communications between services. This ensures that data remains secure and tamper-proof as it travels across the network.
2. **Traffic Management**: With a service mesh, you can implement sophisticated traffic management policies, including load balancing, circuit breaking, and retries. This leads to improved performance and reliability of your distributed systems.
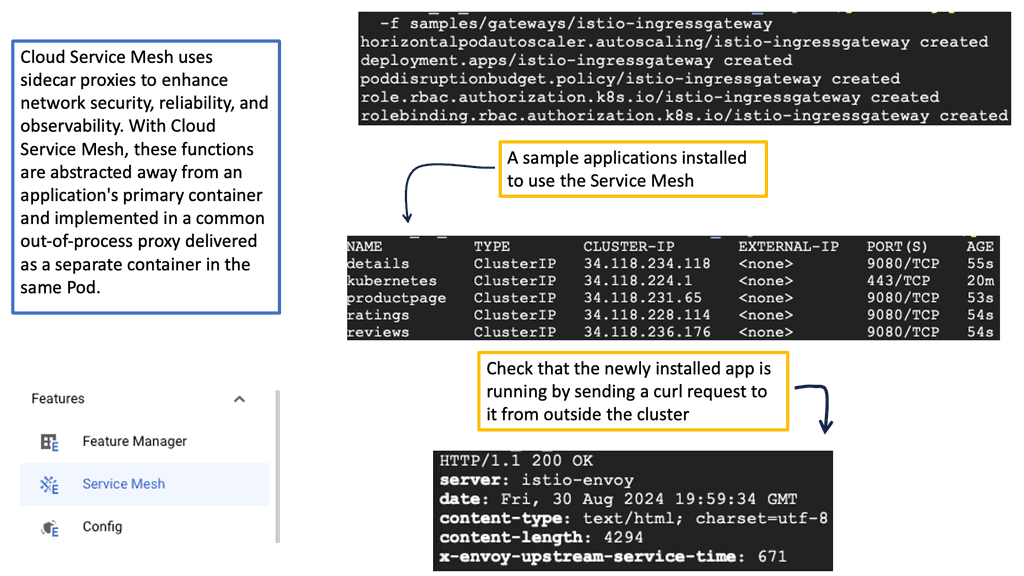
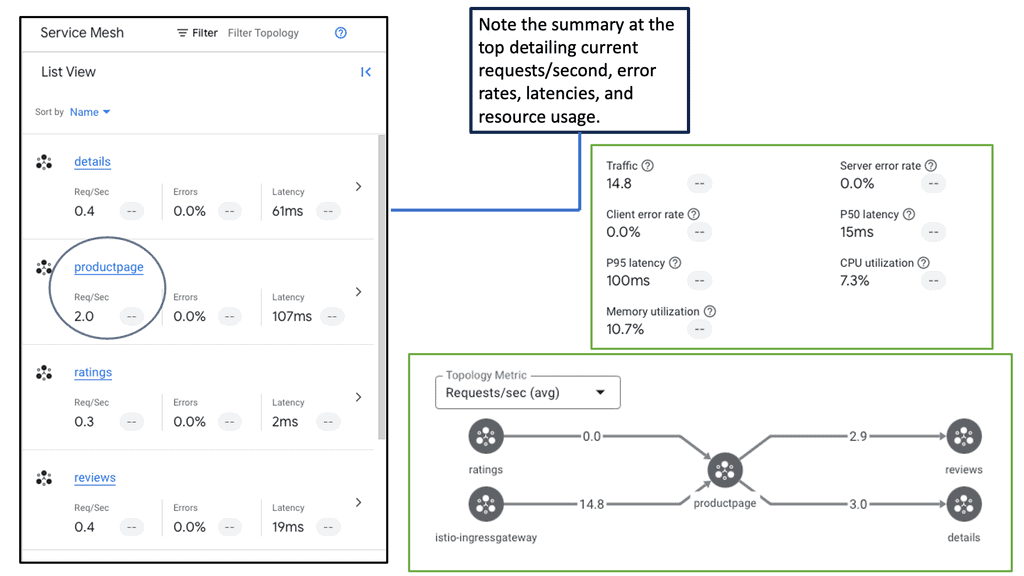
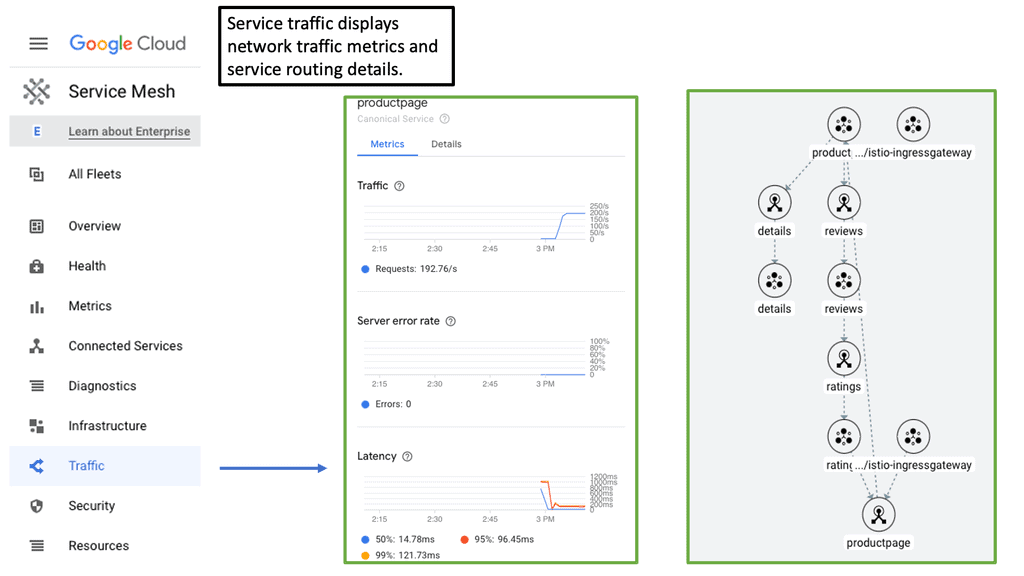
3. **Observability**: One of the standout features of a service mesh is its ability to provide deep observability into the interactions between services. Metrics, logs, and traces are collected and analyzed, offering invaluable insights into system health and performance.
### Enhancing Observability in Distributed Systems
Observability is a key concern in managing distributed systems. With the proliferation of microservices, tracking and understanding service interactions can become overwhelmingly complex. A Cloud Service Mesh addresses this challenge by offering comprehensive observability features:
– **Metrics Collection**: Collects real-time metrics on service performance, latency, error rates, and more.
– **Distributed Tracing**: Enables tracing of requests as they propagate through multiple services, helping identify bottlenecks and performance issues.
– **Centralized Logging**: Aggregates logs from various services, providing a unified view for easier troubleshooting and analysis.
These capabilities empower teams to detect issues early, optimize performance, and ensure the reliability of their applications.
### Real-World Applications and Use Cases
Several organizations have successfully implemented Cloud Service Meshes to transform their operations. For instance, financial institutions use service meshes to secure sensitive transactions, while e-commerce platforms leverage them to manage high traffic volumes during peak shopping seasons. By providing a robust framework for service communication, a service mesh enhances scalability, reliability, and security across industries.
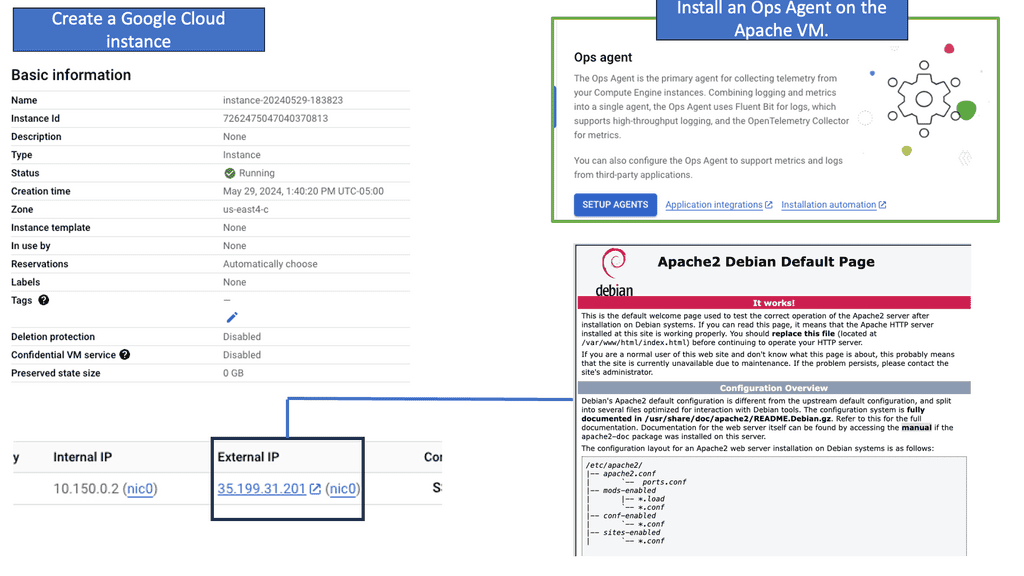
Googles Ops Agent
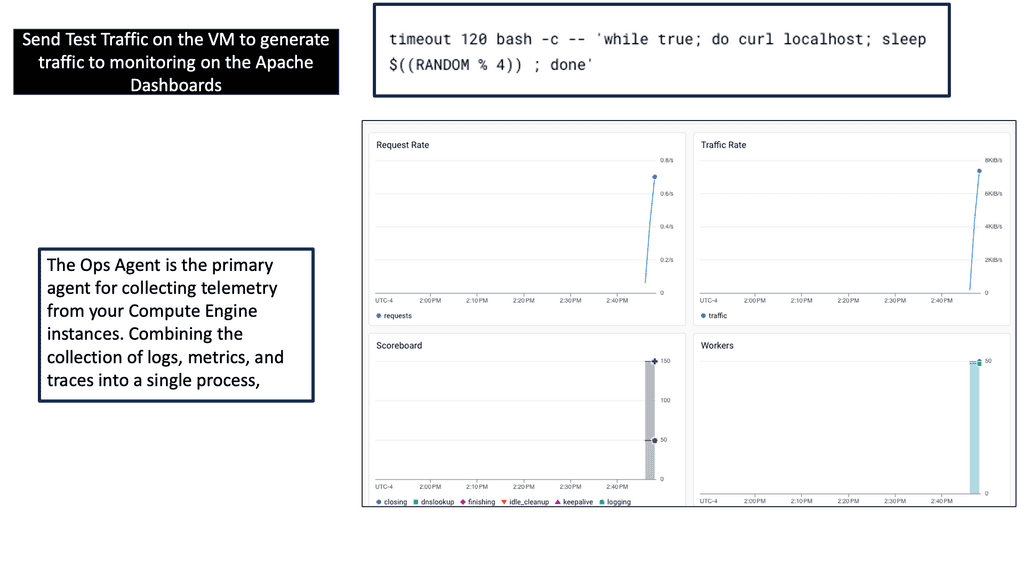
Ops Agent is a lightweight agent that runs on your Compute Engine instances, collecting and forwarding metrics and logs to Google Cloud Monitoring and Logging. By installing Ops Agent on your instances, you gain real-time visibility into your Compute Engine’s performance and behavior.
To start monitoring your Compute Engine, you must install Ops Agent on your instances. The installation process is straightforward and can be done manually or through automation tools like Cloud Deployment Manager or Terraform. Once installed, the Ops Agent will automatically begin collecting metrics and logs from your Compute Engine.
Ops Agent allows you to customize the metrics and logs you want to monitor for your Compute Engine. Various options are available, allowing you to choose specific metrics and logs relevant to your application or system. By configuring metrics and logs, you can gain deeper insights and track the performance of critical components.
 **Challenge: Fragmented Monitoring Tools**
Fragmented monitoring tools and manual analytics strategies challenge IT and security teams. The lack of a single source of truth and real-time insight makes it increasingly difficult for these teams to access the answers they need to accelerate innovation and optimize digital services. To gain insight, they must manually query data from various monitoring tools and piece together different sources of information.
This complex and time-consuming process distracts Team members from driving innovation and creating new value for the business and customers. In addition, many teams monitor only their mission-critical applications due to the effort involved in managing all these tools, platforms, and dashboards. The result is a multitude of blind spots across the technology stack, which makes it harder for teams to gain insights.
**Challenge: Kubernetes is Complex**
Understanding how Kubernetes adds to the complexity of technology stacks is imperative. In the drive toward modern technology stacks, it is the platform of choice for organizations refactoring their applications for the cloud-native world. Through dynamic resource provisioning, Kubernetes architectures can quickly scale services to new users and increase efficiency.
However, the constant changes in cloud environments make it difficult for IT and security teams to maintain visibility into them. To provide observability in their Kubernetes environments, these teams cannot manually configure various traditional monitoring tools. The result is that they are often unable to gain real-time insights to improve user experience, optimize costs, and strengthen security. Due to this visibility challenge, many organizations are delaying moving more mission-critical services to Kubernetes.
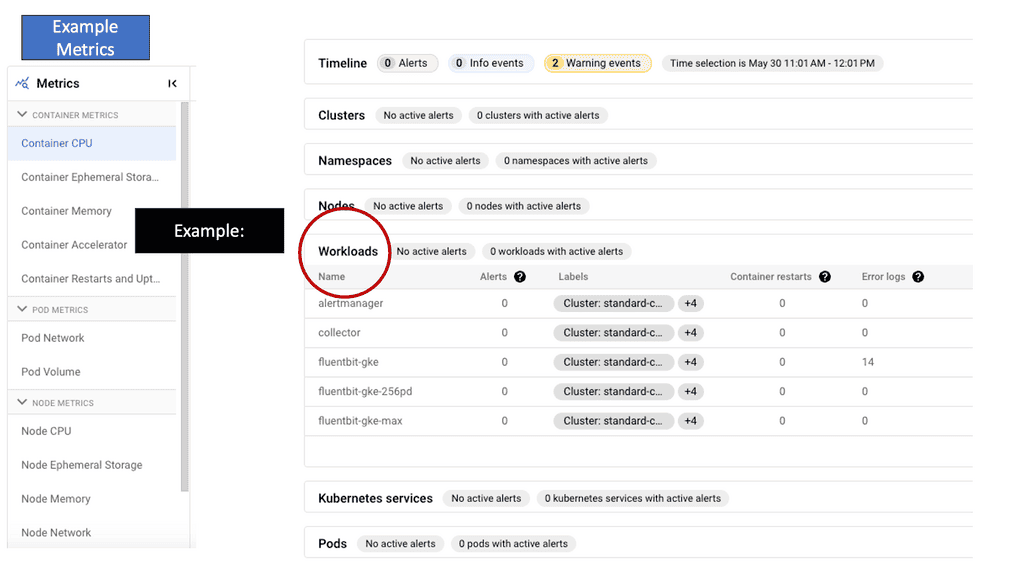
GKE-Native Monitoring
The Basics of GKE-Native Monitoring
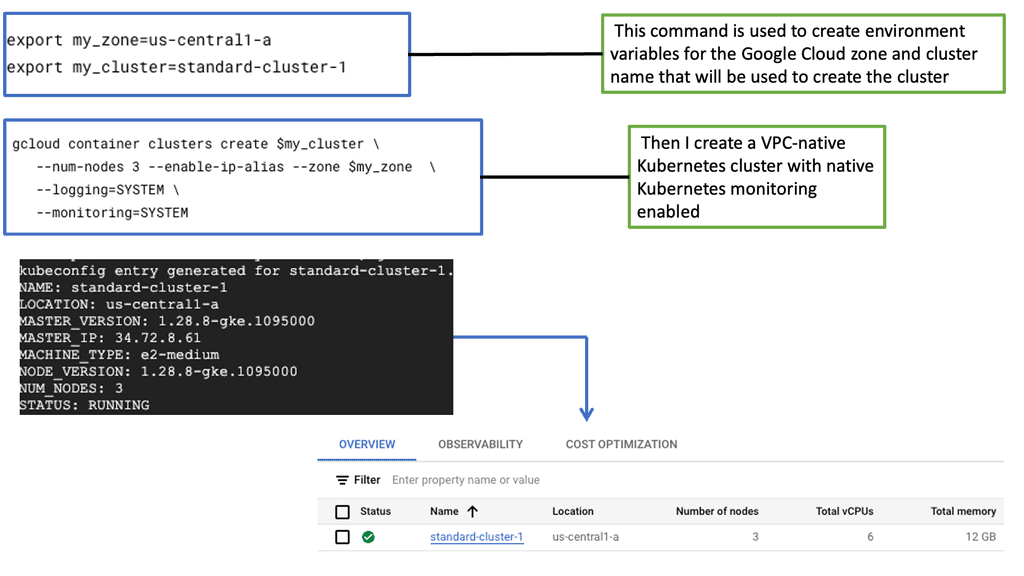
GKE-Native Monitoring is a comprehensive monitoring solution provided by Google Cloud Platform (GCP) designed explicitly for GKE clusters. It offers deep insights into your applications’ performance and behavior, allowing you to proactively detect and resolve issues. With GKE-Native Monitoring, you can easily collect and analyze metrics, monitor logs, and set up alerts to ensure the reliability and availability of your applications.
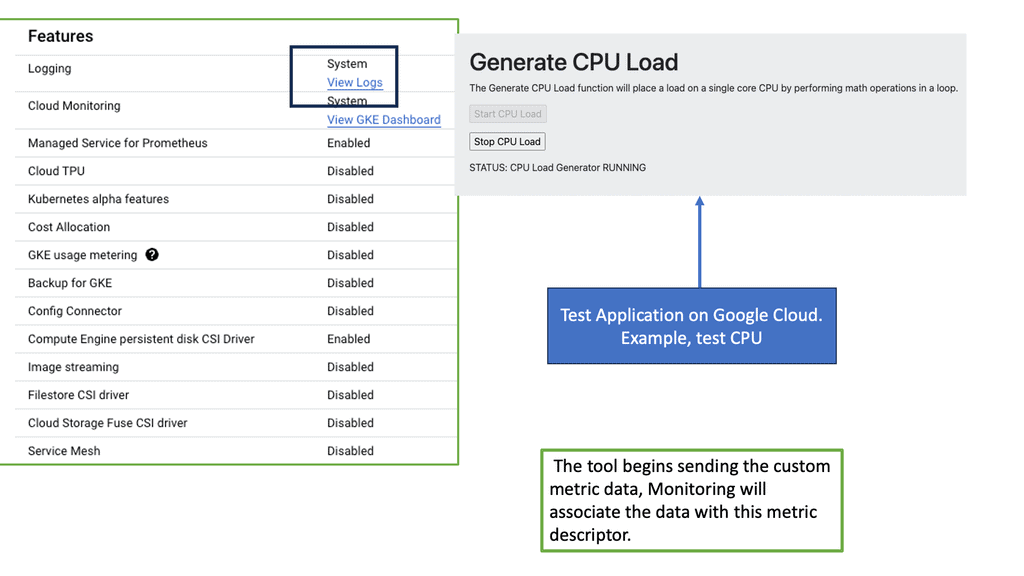
One of the critical features of GKE-Native Monitoring is its ability to collect and analyze metrics from your GKE clusters. It provides preconfigured dashboards that display essential metrics such as CPU usage, memory utilization, and network traffic. Additionally, you can create custom dashboards tailored to your specific requirements, allowing you better to understand your application’s performance and resource consumption.
The Role of Megatrends
We have had a considerable drive with innovation that has spawned several megatrends that have affected how we manage and view our network infrastructure and the need for distributed systems observability. We have seen the decomposition of everything from one to many.
Many services and dependencies in multiple locations, aka microservices observability, must be managed and operated instead of the monolithic where everything is generally housed internally. The megatrends have resulted in a dynamic infrastructure with new failure modes not seen in the monolithic, forcing us to look at different systems observability tools and network visibility practices.
Shift in Control
There has also been a shift in the point of control. As we move towards new technologies, many of these loosely coupled services or infrastructures your services depend on are not under your control. The edge of control has been pushed, creating different network and security perimeters. These parameters are now closer to the workload than a central security stack. Therefore, the workloads themselves are concerned with security.
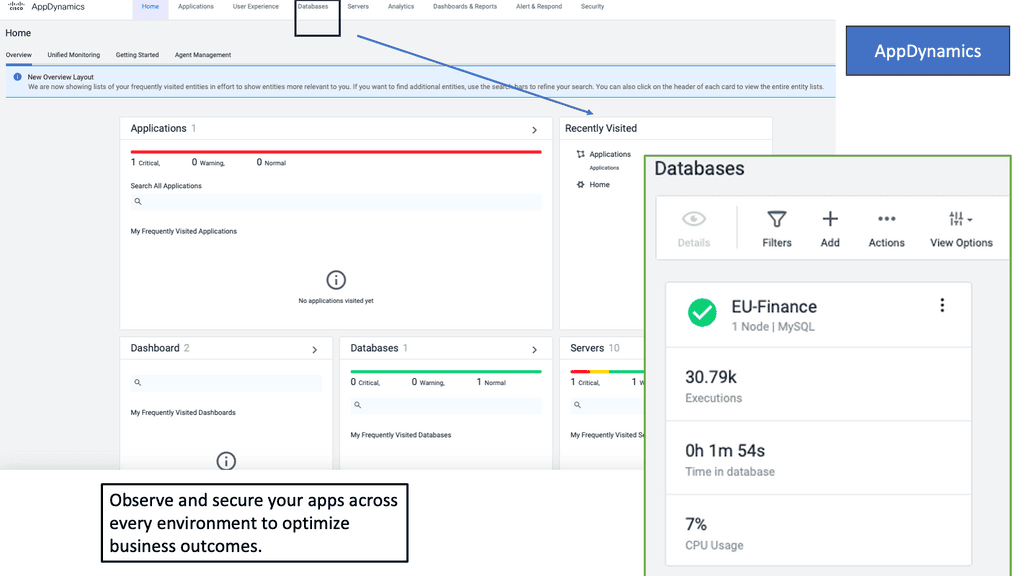
Example Product: Cisco AppDynamics
### What is Cisco AppDynamics?
Cisco AppDynamics is an application performance management (APM) solution designed to provide real-time visibility into the performance of your applications. It helps IT professionals identify bottlenecks, diagnose issues, and optimize performance, ensuring a seamless user experience. With its powerful analytics, you can gain deep insights into your application stack, from the user interface to the backend infrastructure.
### Key Features and Capabilities
#### Real-Time Monitoring
One of the standout features of Cisco AppDynamics is its ability to monitor applications in real-time. This allows IT teams to detect and resolve issues as they occur, minimizing downtime and ensuring a smooth user experience. Real-time monitoring covers everything from user interactions to server performance, providing a comprehensive view of your application’s health.
#### End-User Experience Monitoring
Understanding how users interact with your application is crucial for delivering a high-quality experience. Cisco AppDynamics offers end-user experience monitoring, which tracks user sessions and interactions. This data helps you identify any pain points or performance issues that may be affecting user satisfaction.
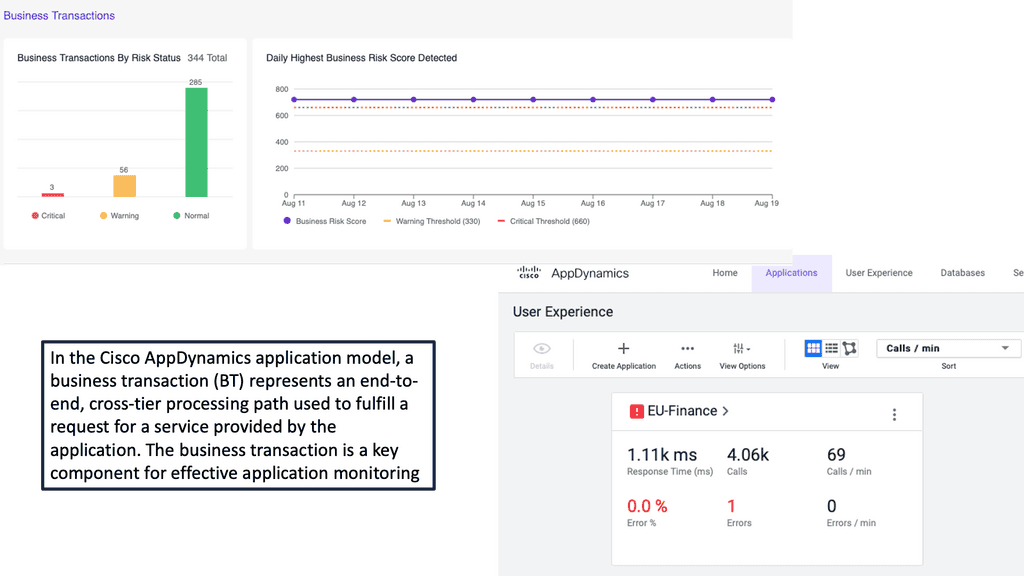
#### Business Transaction Monitoring
Cisco AppDynamics takes a unique approach to monitoring by focusing on business transactions. By tracking the performance of individual transactions, you can gain a clearer understanding of how different parts of your application are performing. This level of granularity allows for more targeted optimizations and quicker issue resolution.
### Benefits of Using Cisco AppDynamics
#### Improved Application Performance
With its comprehensive monitoring and diagnostic capabilities, Cisco AppDynamics helps you identify and resolve performance issues quickly. This leads to faster load times, fewer errors, and an overall improved user experience.
#### Enhanced Operational Efficiency
By automating many of the monitoring and diagnostic processes, Cisco AppDynamics reduces the workload on your IT team. This allows them to focus on more strategic initiatives, driving greater value for your business.
#### Better Decision Making
The insights provided by Cisco AppDynamics enable better decision-making at all levels of your organization. Whether you’re looking to optimize resource allocation or plan for future growth, the data and analytics provided can inform your strategies and drive better outcomes.
### Integrations and Flexibility
Cisco AppDynamics offers seamless integrations with a wide range of third-party tools and platforms. Whether you’re using cloud services like AWS and Azure or CI/CD tools like Jenkins and GitHub, AppDynamics can integrate into your existing workflows, providing a unified view of your application’s performance.
For pre-information, you may find the following posts helpful:
Distributed Systems
Today’s world of always-on applications and APIs has availability and reliability requirements that would have been needed of solely a handful of mission-critical services around the globe only a few decades ago. Likewise, the potential for rapid, viral service growth means that every application has to be built to scale nearly instantly in response to user demand.
Finally, these constraints and requirements mean that almost every application made—whether a consumer mobile app or a backend payments application—needs to be a distributed system. A distributed system is an environment where different components are spread across multiple computers on a network. These devices split up the work, harmonizing their efforts to complete the job more efficiently than if a single device had been responsible.
**The Key Components of Observability**
Observability in distributed systems is achieved through three main components: monitoring, logging, and tracing.
1. Monitoring: Monitoring involves continuously collecting and analyzing system metrics and performance indicators. It provides real-time visibility into the health and performance of the distributed system. By monitoring various metrics such as CPU usage, memory consumption, network traffic, and response times, engineers can proactively identify anomalies and make informed decisions to optimize system performance.
2. Logging: Logging involves recording events, activities, and errors within the distributed system. Log data provides a historical record that can be analyzed to understand system behavior and debug issues. Distributed systems generate vast amounts of log data, and effective log management practices, such as centralized log storage and log aggregation, are crucial for efficient troubleshooting.
3. Tracing: Tracing involves capturing the flow of requests and interactions between different distributed system components. It allows engineers to trace the journey of a specific request and identify potential bottlenecks or performance issues. Tracing is particularly useful in complex distributed architectures where multiple services interact.
**Benefits of Observability in Distributed Systems**
Adopting observability practices in distributed systems offers several benefits:
1. Enhanced Troubleshooting: Observability enables engineers to quickly identify and resolve issues by providing detailed insights into system behavior. With real-time monitoring, log analysis, and tracing capabilities, engineers can pinpoint the root cause of problems and take appropriate actions, minimizing downtime and improving system reliability.
2. Performance Optimization: By closely monitoring system metrics, engineers can identify performance bottlenecks and optimize system resources. Observability allows for proactive capacity planning and efficient resource allocation, ensuring optimal performance even under high loads.
3. Efficient Change Management: Observability facilitates monitoring system changes and their impact on overall performance. Engineers can track changes in metrics and easily identify any deviations or anomalies caused by updates or configuration changes. This helps maintain system stability and avoid unexpected issues.
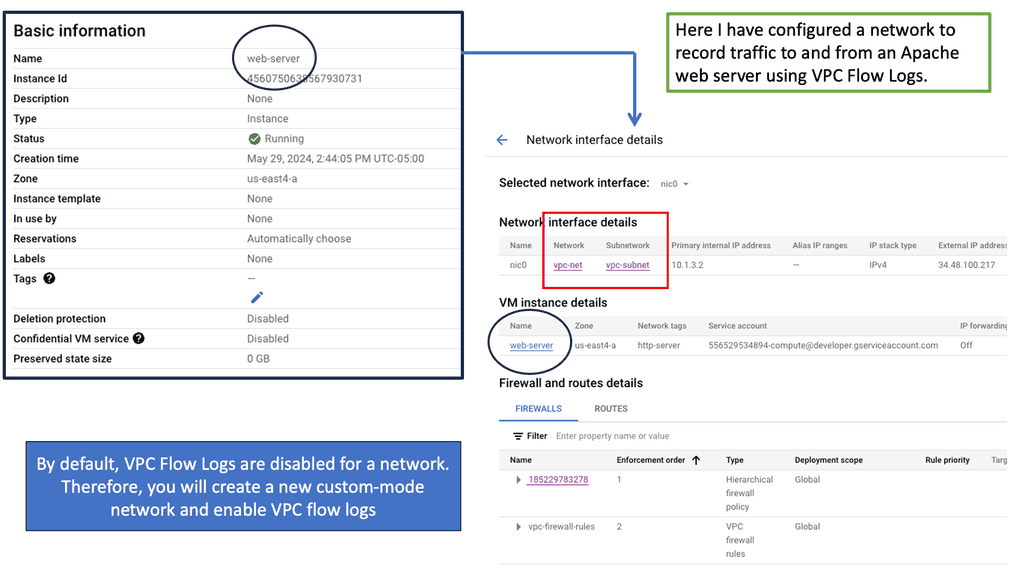
What are VPC Flow Logs?
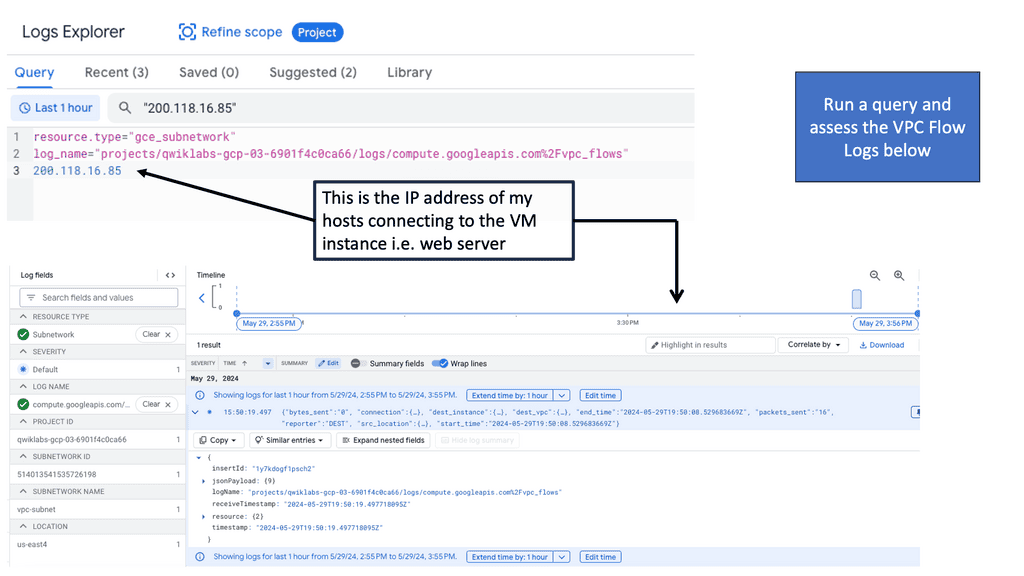
VPC Flow Logs is a feature offered by Google Cloud that captures and records network traffic information within Virtual Private Cloud (VPC) networks. Each network flow is logged, providing a comprehensive view of the traffic traversing. These logs include valuable information such as source and destination IP addresses, ports, protocol, and packet counts.
Once the VPC Flow Logs are enabled and data is being recorded, we can start leveraging the power of analysis. Google Cloud provides several tools and services for analyzing VPC Flow Logs. One such tool is BigQuery, a scalable and flexible data warehouse. By exporting VPC Flow Logs to BigQuery, we can perform complex queries, visualize traffic patterns, and detect anomalies using industry-standard SQL queries.
**How This Affects Failures**
The primary issue I have seen with my clients is that application failures are no longer predictable, and dynamic systems can fail creatively, challenging existing monitoring solutions. But, more importantly, the practices that support them. We have a lot of partial failures that are not just unexpected but not known or have never been seen before. For example, if you recall, we have the network hero.
**The network Hero**
It is someone who knows every part of the network and has seen every failure at least once. These people are no longer helpful in today’s world and need proper Observation. When I was working as an Engineer, we would have plenty of failures, but more than likely, we would have seen them before. And there was a system in place to fix the error. Today’s environment is much different.
We can no longer rely on simply seeing a UP or Down, setting static thresholds, and then alerting based on those thresholds. A key point to note at this stage is that none of these thresholds considers the customer’s perspective. If your POD runs at 80% CPU, does that mean the customer is unhappy?
When monitoring, you should look from your customer’s perspectives and what matters to them. Content Delivery Network (CDN) was one of the first to realize this game and measure what matters most to the customer.
Distributed Systems Observability
The different demands
So, the new, modern, and complex distributed systems place very different demands on your infrastructure and the people who manage it. For example, in microservices, there can be several problems with a particular microservice:
- The microservices could be running under high resource utilization and, therefore, slow to respond, causing a timeout
- The microservices could have crashed or been stopped and is, therefore, unavailable
- The microservices could be fine, but there could be slow-running database queries.
- So we have a lot of partial failures.
Consequently, We can no longer predict
The significant shift we see with software platforms is that they evolve much quicker than the products and paradigms we use to monitor them. As a result, we need to consider new practices and technologies with dedicated platform teams and sound system observability. We can’t predict anything anymore, which puts the brakes on some traditional monitoring approaches, especially the metrics-based approach to monitoring.
I’m not saying that these monitoring tools are not doing what you want them to do. But, they work in a siloed environment, and there is a lack of connectivity. So we have monitoring tools working in silos in different parts of the organization and more than likely managed by other people trying to monitor a very dispersed application with multiple components and services in various places.
Relying On Known Failures
Metric-Based Approach
A metrics-based monitoring approach relies on having previously encountered known failure modes. The metric-based approach relies on known failures and predictable failure modes. So, we have predictable thresholds that someone is considered to experience abnormal.
Monitoring can detect when these systems are either over or under the predictable thresholds that were previously set. Then, we can set alerts, and we hope that these alerts are actionable. This is only useful for variants of predictable failure modes.
Traditional metrics and monitoring tools can tell you any performance spikes or notice that a problem occurs. But they don’t let you dig into the source of the issues and let us slice and dice or see correlations between errors. If the system is complex, this approach is more challenging in getting to the root cause in a reasonable timeframe.
Google Cloud Trace
Example: Application Latency & Cloud Trace
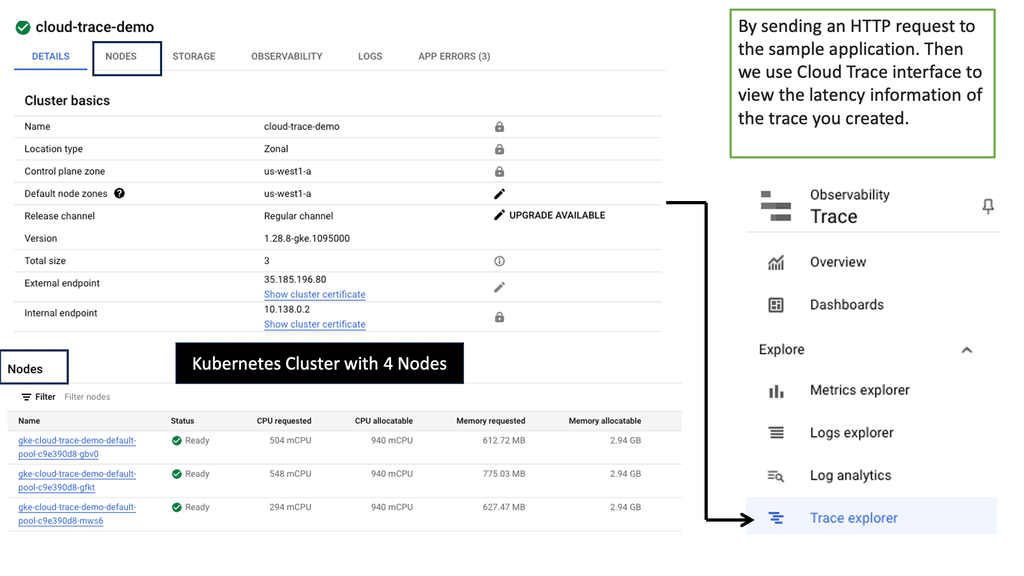
Before we discuss Cloud Trace’s specifics, let’s establish a clear understanding of application latency. Latency refers to the time delay between a user’s action or request and the corresponding response from the application. It includes network latency, server processing time, and database query execution time. By comprehending the different factors contributing to latency, developers can proactively optimize their applications for improved performance.
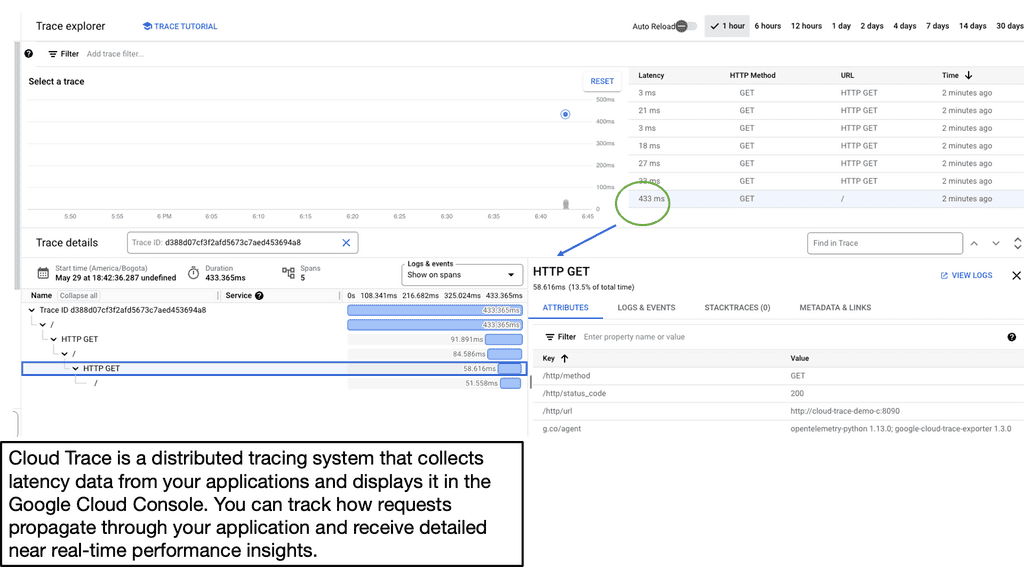
Google Cloud Trace is a powerful diagnostic tool offered by Google Cloud Platform (GCP) that enables developers to identify and analyze application latency bottlenecks. It provides detailed insights into the flow of requests and events within an application, allowing developers to pinpoint areas of concern and optimize accordingly. Cloud Trace integrates seamlessly with other GCP services and provides a comprehensive view of latency across various components of an application stack.
Traditional style metrics systems
With traditional metrics systems, you had to define custom metrics, which were always defined upfront. This approach prevents us from starting to ask new questions about problems. So, it would be best to determine the questions to ask upfront.
Then, we set performance thresholds, pronounce them “good” or “bad, ” and check and re-check those thresholds. We would tweak the thresholds over time, but that was about it. This monitoring style has been the de facto approach, but we don’t now want to predict how a system can fail. Always observe instead of waiting for problems, such as reaching a certain threshold before acting.
**Metrics: Lack of connective event**
The metrics did not retain the connective event, so you cannot ask new questions in the existing dataset. These traditional system metrics could miss unexpected failure modes in complex distributed systems. Also, the condition detected via system metrics might be unrelated to what is happening.
An example of this could be an odd number of running threads on one component, which might indicate garbage collection is in progress or that slow response times are imminent in an upstream service.
**Users experience static thresholds**
User experience means different things to different sets of users. We now have a model where different service users may be routed through the system in other ways, using various components and providing experiences that can vary widely. We also know now that the services no longer tend to break in the same few predictable ways over and over.
We should have a few alerts triggered by only focusing on symptoms that directly impact user experience and not because a threshold was reached.
The Challenge: Can’t reliably indicate any issues with user experience
If you use static thresholds, they can’t reliably indicate any issues with user experience. Alerts should be set up to detect failures that impact user experience. Traditional monitoring falls short in this regard. With traditional metrics-based monitoring, we rely on static thresholds to define optimal system conditions, which have nothing to do with user experience.
However, modern systems change shape dynamically under different workloads. Static monitoring thresholds can’t reflect impacts on user experience. They lack context and are too coarse.
Required: Distributed Systems Observability
Systems observability and reliability in distributed systems are practices. Rather than just focusing on a tool that logs, metrics, or alters, Observability is all about how you approach problems, and for this, you need to look at your culture. So you could say that Observability is a cultural practice that allows you to be proactive about findings instead of relying on a reactive approach that we are used to in the past.
Nowadays, we need a different viewpoint and want to see everything from one place. You want to know how the application works and how it interacts with the other infrastructure components, such as the underlying servers, physical or server, the network, and how data transfer looks in a transfer and stale state.
Levels of Abstraction
What level of observation is needed to ensure everything performs as it should? What should you look at to obtain this level of detail?
Monitoring is knowing the data points and the entities from which we gather information. On the other hand, Observability is like putting all the data together. So monitoring is collecting data, and Observability is putting it together in one single pane of glass. Observability is observing the different patterns and deviations from the baseline; monitoring is getting the data and putting it into the systems. A vital part of an Observability toolkit is service level objectives (slos).
**Preference: Distributed Tracing**
We have three pillars of Systems Observability. There are Metrics, Traces, and Logging. So, defining or viewing Observability as having these pillars is an oversimplification. But for Observability, you need these in place. Observability is all about connecting the dots from each of these pillars.
If someone asked me which one I prefer, it would be distributed tracing. Distributed tracing allows you to visualize each step in service request executions. As a result, it doesn’t matter if services have complex dependencies. You could say that the complexity of the Dynamic systems is abstracted with distributed tracing.
**Use Case: Challenges without tracing**
For example, latency can stack up if a downstream database service experiences performance bottlenecks, resulting in high end-to-end latency. When latency is detected three or four layers upstream, it can be complicated to identify which component of the system is the root of the problem because now that same latency is being seen in dozens of other services.
**Distributed tracing: A winning formula**
Modern distributed systems tend to scale into a tangled knot of dependencies. Therefore, distributed tracing shows the relationships between various services and components in a distributed system. Traces help you understand system interdependencies. Unfortunately, those inter-dependencies can obscure problems and make them challenging to debug unless their relationships are clearly understood.
In distributed systems, observability is vital in ensuring complex architectures’ stability, performance, and reliability. Monitoring, logging, and tracing provide engineers with the tools to understand system behavior, troubleshoot issues, and optimize performance. By adopting observability practices, organizations can effectively manage their distributed systems and provide seamless and reliable services to their users.

- Fortinet’s new FortiOS 7.4 enhances SASE - April 5, 2023
- Comcast SD-WAN Expansion to SMBs - April 4, 2023
- Cisco CloudLock - April 4, 2023