
Secure access does not automatically mean observable access. In a SASE architecture, a user's traffic can cross the endpoint, local network, Internet, SASE service edge, cloud provider and application before the final transaction completes. When performance degrades, the challenge is identifying which part of that path is responsible.
See the complete path
Measure more than the security policy. Observe latency, packet loss, DNS behaviour, routing changes and application response across the complete user-to-service path.
Find where the problem begins
Compare evidence from different vantage points to separate endpoint, access-network, Internet, SASE and cloud conditions.
Turn telemetry into a diagnosis
Correlate network-path evidence with application and service dependencies so an incident can move from symptom to probable cause.
Four engineering sections take the investigation from end-to-end visibility through vantage points, troubleshooting and operational correlation.
See the complete path from user to application
SASE secures access, but visibility must extend beyond the security policy itself. ThousandEyes adds digital experience and network-path visibility across the endpoint, local network, Internet, SASE infrastructure, cloud services and applications.
User / Device
The endpoint is where the digital experience begins. Local conditions such as Wi-Fi quality, device performance and the user's connection can influence application performance.
SASE Visibility: Building the End-to-End Evidence Path
SASE changes the way enterprise traffic moves through the network. Instead of sending every application flow through a traditional central security stack, users may connect through a combination of local access, Internet connectivity, SD-WAN, security service edges, cloud platforms and SaaS providers.
This architecture provides greater flexibility, but it also changes the visibility problem. A user experiencing a slow application does not necessarily have a problem with the application itself. The degradation could have started on the endpoint, across Wi-Fi, at the local gateway, somewhere in the Internet path, at a SASE point of presence or within a cloud service dependency.
The key engineering principle: SASE visibility should follow the complete transaction path rather than stopping at the security boundary.
From security policy to user experience
Traditional security monitoring often concentrates on whether traffic was permitted, denied or inspected correctly. Those are important control-plane questions, but they do not answer whether the user actually received a good application experience.
An application request can be successfully authorised and inspected while still experiencing high latency, packet loss, DNS delays or inefficient routing. Consequently, operational visibility needs to connect security decisions with the underlying network and application path.
User and device experience
Measure the starting point of the transaction, including endpoint connectivity, local access conditions and the experience observed by the user.
Path performance
Examine latency, packet loss, routing changes and path transitions between the user, Internet and SASE service edge.
Service-edge behaviour
Establish whether the selected SASE point of presence and security service are introducing delay or whether the service itself remains healthy.
Transaction performance
Correlate network evidence with DNS, HTTP response and application behaviour to determine whether the destination service is actually responsible.
What should be measured?
Effective SASE observability requires multiple forms of telemetry rather than a single health indicator. Network-path measurements can reveal where latency or loss begins, while application tests can determine whether the same condition is affecting the transaction itself.
Core evidence to correlate
- Endpoint and local-network conditions
- DNS resolution and dependency behaviour
- Latency, packet loss and jitter
- Internet routing and path changes
- SASE PoP reachability and service health
- Cloud and SaaS connectivity
- HTTP and application response time
Why end-to-end visibility matters
The objective is not to create another dashboard containing more metrics. The objective is to build an evidence chain that allows an engineer to move from symptom to location and then from location to probable cause.
Engineering takeaway: The more distributed the SASE architecture becomes, the more important it is to observe the complete path from the user's device to the application. Visibility must cross organisational and infrastructure boundaries rather than ending at the enterprise edge.
Measures evidence close to the user: endpoint health, Wi-Fi, local access, VPN paths and application experience.
Compare measurements from different locations before assigning the fault domain.
ThousandEyes Vantage Point Explorer
The same application problem can look completely different depending on where you measure it. Select a vantage point to see what evidence it contributes to the investigation.
ThousandEyes Vantage Points: Seeing the Path from Multiple Locations
End-to-end SASE visibility becomes much more useful when measurements can be taken from different points in the network. A single test tells you what one observer experienced. Multiple vantage points allow you to compare those experiences and determine where the difference begins.
This is particularly important for SASE environments because the user does not simply connect directly to an application. Traffic may pass through the endpoint, local access network, ISP, Internet transit, security service edge, cloud provider and finally the application itself.
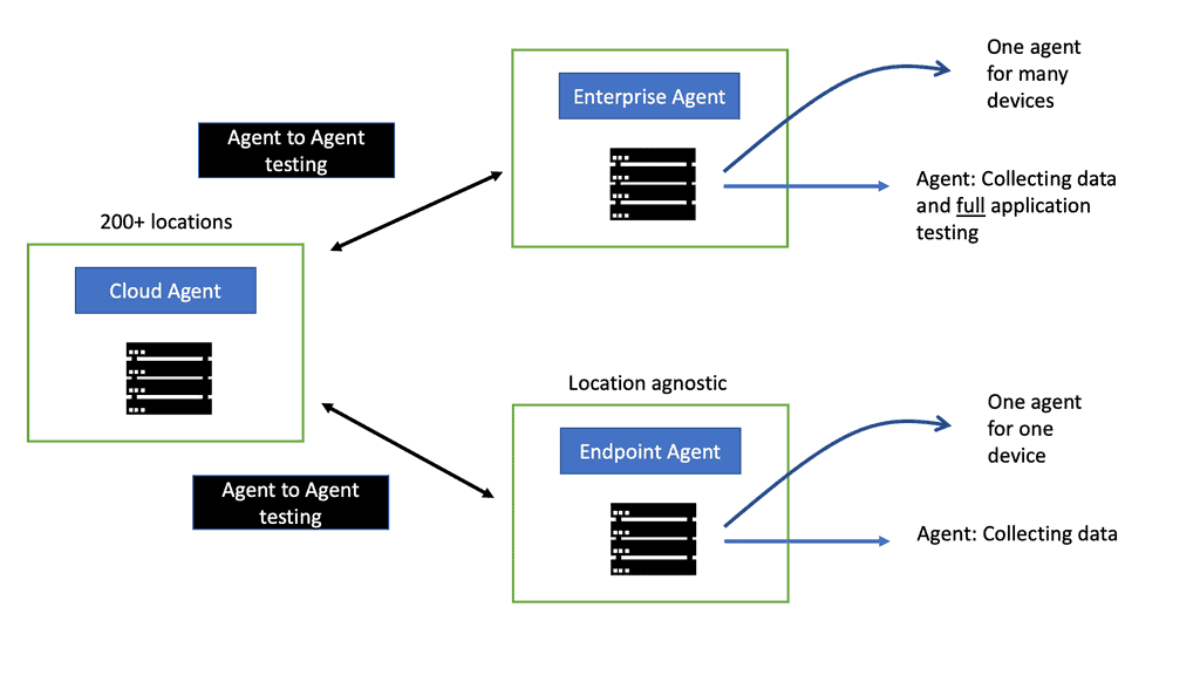
Endpoint Agents: Measuring the User Experience
An Endpoint Agent provides the closest view to the actual user experience. It can help expose problems affecting the device, Wi-Fi or local network before traffic even reaches the wider Internet.
This makes endpoint visibility valuable when users report that an application is slow, unreliable or intermittently unreachable. The measurement begins where the problem is being experienced rather than somewhere deeper in the network.
Enterprise Agents: Establishing a Controlled Baseline
Enterprise Agents provide a controlled observation point within a branch, office, data centre or other managed location. They are useful for establishing a repeatable baseline for connectivity and application reachability.
Comparing an Enterprise Agent with an Endpoint Agent can help distinguish a local user problem from a wider network condition. If the enterprise baseline remains healthy while endpoint measurements degrade, attention can move towards the local access environment.
Cloud Agents: Seeing the Internet from Outside the User Network
Cloud Agents provide another perspective by measuring connectivity from externally hosted locations. They cannot see the user's Wi-Fi or local network, but they can provide independent evidence about Internet, provider and SaaS reachability.
This external perspective is particularly useful when investigating whether an apparent SASE or application problem is actually broader than the affected user location.
Why Multiple Vantage Points Matter
The real value comes from comparing the measurements rather than treating any individual vantage point as the complete picture.
When measurements from these locations agree, confidence in the observed condition increases. When they disagree, that difference becomes useful evidence in itself. It can help narrow the investigation to the local access network, Internet path, SASE service edge or application dependency.
| Evidence | Endpoint | Enterprise | Cloud |
|---|---|---|---|
| Local Wi-Fi / LAN | Direct | Branch | Not visible |
| ISP path | Direct | Direct | Comparative |
| SASE PoP | Visible | Visible | Visible |
| User experience | Direct | Baseline | Indirect |
| SaaS reachability | Direct | Direct | Direct |
Check Wi-Fi quality, device conditions and local connectivity. If the endpoint is unhealthy, investigate locally before moving toward the SASE service.
Where is the performance problem?
A user reports that a cloud application is slow. Instead of immediately blaming the network, investigate the complete delivery path and use evidence to isolate the failing layer.
Device health
Retransmits
Path changes
Service edge
Provider path
Availability
Start With The User Experience
Begin with the observed symptom. A high HTTP response time tells you that the user experience is degraded, but it does not yet identify the root cause.
Troubleshooting SASE Performance: Follow the Evidence
The value of end-to-end visibility becomes most obvious during an incident. Instead of beginning with assumptions about the SASE platform, ISP or application provider, an engineer can work through the evidence in the same order that the transaction travels through the environment.
Users report increased page-load time and application response latency. The first objective is not to identify the culprit immediately, but to determine where the evidence begins to diverge from the normal baseline.
Start with the user experience
An application complaint is the symptom, not necessarily the root cause. Begin by establishing exactly what has changed. Is the problem affecting every user, a particular office, a specific network, a region or only a subset of devices?
This initial scope is important because it immediately changes the investigation. A global application failure should produce a different evidence pattern from a local access-network problem affecting only one office.
Move down the path
Establish whether the endpoint and local access environment are behaving normally.
Look for increased latency, packet loss, routing changes or path instability.
Determine whether the selected SASE PoP and security service show corresponding degradation.
Compare application and HTTP response with network-path evidence.
Separate path problems from application problems
One of the most useful troubleshooting techniques is correlation. If application response time increases at the same time that network latency increases along a particular path, there is evidence of a network-side contribution.
Conversely, if the network path remains stable while application response time increases, attention should move toward the destination service, application infrastructure or one of its dependencies.
Healthy network path
Latency and loss remain close to baseline, routing is stable and the SASE service edge is responding normally. Investigate application or service dependencies.
Changed network path
Latency or loss increases after a path transition or routing change. Investigate the affected provider, transit segment or Internet route.
Where SPAN and sFlow fit
Traditional network telemetry remains valuable. SPAN can provide packet visibility for a local segment, while sFlow and related telemetry can provide traffic-level information from network infrastructure.
These technologies should be treated as complementary evidence rather than replacements for end-to-end observability. A packet capture may explain what happened on one network segment, but it cannot by itself establish the complete user-to-SaaS path across multiple providers and service boundaries.
Build the investigation around evidence
The strongest troubleshooting process continually asks what the current evidence proves and what it does not prove. This prevents engineers from prematurely blaming the SASE platform simply because the incident was observed through a SASE-connected user.
Engineering takeaway: Troubleshooting should follow the transaction path. Start with the observed user experience, compare vantage points, inspect the network path, validate the SASE service edge and then confirm the application response. Each step should narrow the possible failure domain.
Collect network, endpoint, application and service measurements from the relevant observation points.
Secure access is only successful when users can reliably reach the applications they depend on.
SASE Operations: Correlating Network, Application and Service Dependencies
SASE should be operated as a distributed service rather than as an isolated security platform. User experience depends on multiple interconnected components, including identity, connectivity, security policy, DNS, service edges, cloud infrastructure and SaaS applications.
This means that operational visibility must extend beyond individual devices and dashboards. Engineers need to understand the dependencies that make secure application access possible and continuously validate whether those dependencies are behaving as expected.
Secure access is only part of the objective. Enterprise users also need predictable, measurable and explainable access to the applications they depend on.
The SASE service dependency chain
Build an operational control loop
Monitoring becomes much more useful when it forms a continuous operational loop. Measurements identify change, correlation connects related signals, localization narrows the failure domain and validation confirms the suspected cause before remediation is applied.
After a change is made, the same measurements should be used to verify that the user experience actually improved. Otherwise, an incident may simply move from one component to another without being resolved.
Underlay and overlay must be correlated
Underlay visibility
Observe the physical and Internet transport supporting the SASE architecture. Latency, packet loss, routing changes and provider behaviour can explain why an otherwise healthy overlay is performing poorly.
Overlay visibility
Observe the logical service path created by SD-WAN, security policies, SASE inspection and application access decisions. The overlay can change even when the physical network remains healthy.
From dashboards to dependency-aware operations
A large collection of independent monitoring dashboards can still leave engineers searching for the relationship between signals. A better approach is to connect measurements to the services and dependencies they represent.
For example, increased Microsoft 365 response time should be correlated with DNS performance, Internet path changes, SASE PoP behaviour and endpoint experience. If all users using one Internet provider show the same path degradation while users on another provider remain healthy, the evidence becomes significantly more actionable.
What good SASE observability looks like
Mature SASE operations should allow an engineer to answer five questions quickly:
Who is affected?
Identify the users, locations, applications and services experiencing the degradation.
Where does it begin?
Determine the first point in the transaction path where performance diverges from the expected baseline.
What changed?
Correlate the degradation with routing, provider, policy, service or application changes.
Did remediation work?
Re-measure the same path after remediation and verify that the actual user experience recovered.
Engineering takeaway: SASE observability is most valuable when it connects user experience, network telemetry, security services and application dependencies into a single investigation model. The goal is not simply to see more data. It is to reduce the time required to explain what changed and why.

- BGP Solutions and Insights - October 8, 2026
- DMVPN - May 20, 2023
- Computer Networking: Building a Strong Foundation for Success - April 7, 2023