
Network Visibility: From Telemetry to Operational Understanding
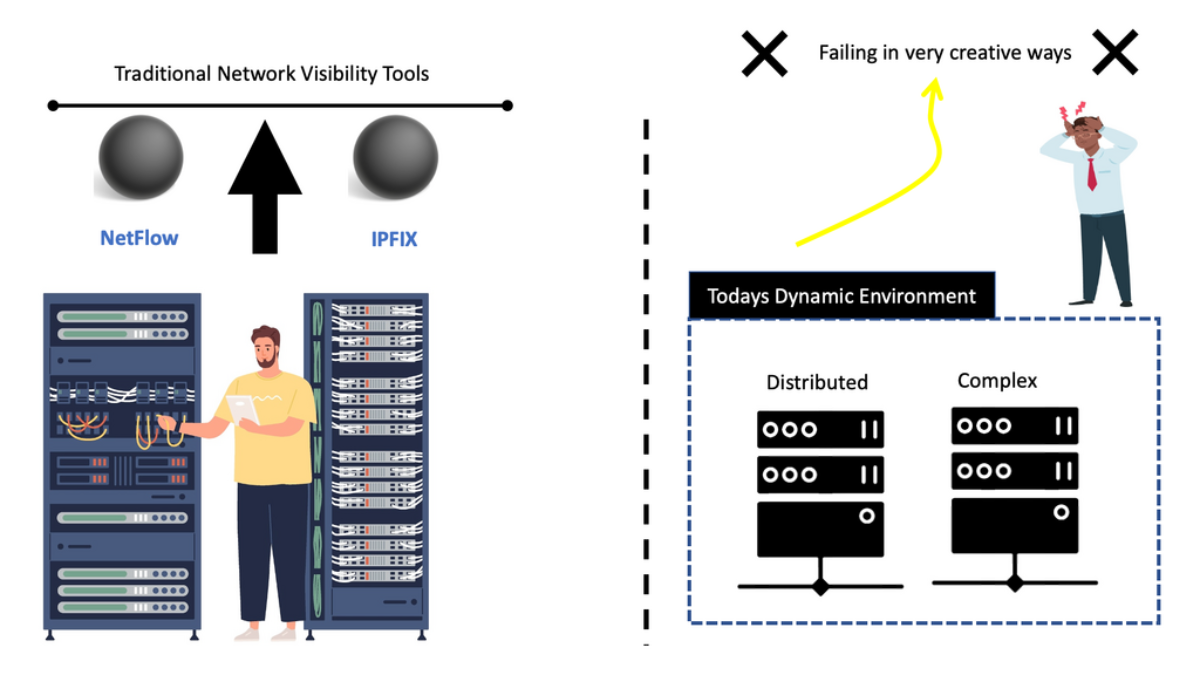
Modern networks are no longer defined by a small number of routers, switches and servers inside a single data centre. Applications span cloud platforms, data centres, SaaS services and distributed environments, while users and devices connect from offices, branches, remote locations and mobile networks. Understanding what is happening across that environment requires more than a dashboard or a single monitoring system.
See the network
Collect telemetry from interfaces, flows, packets, routing, DNS, applications and infrastructure. Each source provides a different view of network behaviour.
Correlate the signals
Connect apparently separate events. High latency, interface utilisation, routing changes and application performance may be different symptoms of the same underlying condition.
Understand the outcome
Add application, identity, security and service context so engineers can investigate the cause rather than simply reacting to another isolated alert.
Network visibility therefore should not be treated as simply collecting more data. Its value comes from creating enough context to answer operational questions: Where is the problem? Which users or applications are affected? What changed? Is the behaviour expected? And what evidence supports the next engineering decision?
Network Visibility
Follow the investigation from raw telemetry to operational understanding.
Visibility Map — What Can You Actually See?
Select a telemetry layer to see the evidence it provides and the question it helps answer.
Visibility vs Observability
Visibility shows what is happening across the environment. Observability adds the context needed to investigate why it is happening.
Network telemetry confirms that traffic is flowing between the client and application path.
Shows the network signals surrounding the event, but additional application and system context may be required to explain the user-facing impact.
Network Visibility: Building the Telemetry Foundation
Network visibility begins with the ability to observe what is happening across the infrastructure. The objective is not to collect every possible metric simply because it is available. Instead, visibility should provide the telemetry required to answer meaningful engineering questions about connectivity, performance, security and application behaviour.
Infrastructure health
Utilisation, errors, discards, link state and other indicators of physical or logical health.
Traffic conversations
Source, destination, protocol, ports, packets and bytes reveal who is communicating and how much.
Protocol detail
Packet-level visibility exposes individual transactions, protocol behaviour and detailed network evidence.
Routing behaviour
Routing and next-hop information show how traffic is expected to move through the infrastructure.
Name resolution
DNS telemetry provides context about services, destinations, response behaviour and resolution latency.
Who is involved?
Identity telemetry can associate network activity with users, devices, roles and access context.
Service behaviour
Application telemetry helps establish whether the service is healthy and meeting expected performance.
Wider context
Metrics, logs, events and traces extend visibility beyond the network into the surrounding system.
Passive visibility
Traditional monitoring often observes existing traffic and infrastructure state. Technologies such as NetFlow/IPFIX, SNMP, SPAN, packet capture and syslog provide valuable evidence without necessarily generating additional traffic.
- Flow records
- Interface counters
- Packet captures
- Routing information
- Device and system logs
Active visibility
Active monitoring introduces measurements into the environment. Synthetic tests, latency probes and application transactions can establish whether a path or service is actually reachable and performing.
- Latency probes
- Synthetic transactions
- Reachability tests
- Application performance checks
- Continuous service validation
Build the Network Picture
slow application
gateway
transit
HTTPS / 443
Errors 0
HTTPS dominant
No failures
R2 → R3
Response degraded
Is the visible interface condition actually responsible for the user-facing application problem?
Telemetry Correlation Explorer
A symptom becomes more useful when related evidence is added to the investigation.
Telemetry Correlation: From Signals to Network Understanding
Collecting telemetry is only the beginning. A monitoring platform may tell an engineer that latency is high, an interface is busy or packet loss has increased, but an individual metric rarely explains why the condition exists. The engineering challenge is to correlate related signals and build enough context to understand the event.
Traditional monitoring
Traditional visibility systems are valuable because they provide measurements and establish baselines. The limitation appears when an incident crosses multiple domains.
Correlated investigation
Correlation connects those measurements into a single investigation. Instead of treating each event as an independent problem, engineers can determine whether they form part of the same causal chain.
Normalize
Telemetry arrives in different formats and time scales. Normalization makes those signals comparable.
Correlate
Related events can be connected using time, identity, topology, application and network context.
Contextualize
The final finding should explain what the signal means for the user, service or business process.
Network Visibility Explorer
See how different telemetry sources reveal different parts of the same network event — and why correlation matters.
A single metric can identify a symptom, but not necessarily the underlying cause.
Inspect the Telemetry Stack
Select telemetry layers to see what each one reveals, what evidence it produces, and where its visibility ends. Build the investigation from interfaces and flows through packets, DNS and applications.
Interfaces
Interface telemetry tells you whether the network device and link are healthy, but it does not explain the complete application experience.
Start with interface telemetry. It establishes whether the network path is operational before deeper telemetry is examined.
Visibility vs Observability
Move from seeing network conditions to understanding the behaviour of the complete application system.
Traffic, paths, interfaces, DNS, latency and packet behaviour.
Useful evidence, but application dependencies may remain unknown.
Visibility vs Observability: Understanding Why the Network Behaves This Way
Network visibility tells us what can be observed across the infrastructure. Observability extends that capability by connecting network evidence with application, service, system and business context. The distinction becomes particularly important as applications move from static architectures into distributed cloud-native environments.
Network Visibility
Visibility provides direct evidence about network conditions and activity.
Distributed Observability
Observability adds context across the complete system.
Consider a slow checkout transaction. Network monitoring might show that the interface is operating at 80% utilisation. Application monitoring might report increased JVM latency. Database monitoring could reveal a slow query. None of these observations alone necessarily identifies the root cause.
Observability connects the events along the transaction path. The objective is to understand which component introduced the delay and whether the network condition is a cause, a contributing factor, or simply a symptom occurring at the same time.
Collect
Gather metrics, logs, events, traces and network telemetry from the relevant systems.
Structure
Convert different telemetry formats and time scales into a form that can be compared.
Connect
Associate signals through timestamps, topology, identities, services and transaction context.
Investigate
Use the combined evidence to explain system behaviour and determine the likely root cause.
Why distributed systems make visibility harder
Containers and microservices create temporary components, dynamic service relationships and rapidly changing network paths. A transaction that previously remained inside a single host can now cross multiple services, clusters, networks and cloud environments.
The network therefore becomes part of a much larger dependency graph. Engineers need to understand not only whether packets are moving, but how those packets relate to the application transaction.
Engineering evidence
- Network path and latency
- Application response time
- Service dependency health
- Distributed trace timing
- Database response behaviour
- User-facing transaction impact
Visibility Shows the Signal. Observability Finds the Cause.
Follow a slow application request across the network and service stack. Correlate metrics, events and dependencies until the evidence points toward a likely root cause.
User
The user is experiencing the symptom. This establishes the impact, but does not identify the underlying cause.
The user sees a slow response. Visibility identifies the symptom; further correlation is required to understand why.
From Telemetry to Security Decision
Security analytics turns network observations into increasingly confident decisions.
The Network Visibility Stack
No single telemetry source provides complete visibility. Each layer answers a different question about what is happening across the network.
Interfaces
Interface state, utilisation, errors, discards and physical or logical health indicators.
High utilisation does not automatically identify which application or conversation is responsible.
Security Analytics: Turning Visibility into Detection
Network visibility becomes particularly powerful when it is used as a security signal. Communication patterns, traffic volumes, destinations, identities and behavioural changes can reveal activity that would be difficult to identify from endpoint or application data alone.
The first challenge is identifying meaningful deviations from normal behaviour. Known malicious destinations, policy violations and established attack patterns can produce relatively direct detections. Unknown threats are more difficult because they may not match an existing signature or reputation list.
Behavioural analytics addresses part of this problem by establishing what normal activity looks like and then identifying meaningful deviations. A long-lived connection, for example, is not automatically malicious. Additional evidence may be required to determine whether the connection represents normal application behaviour, data transfer, command-and-control activity or cryptocurrency mining.
Detect anomalies
Identify unusual traffic volumes, communication patterns, destinations, timing or east-west activity.
Add context
Enrich network events with reputation, threat intelligence, identity, device and application information.
Prioritise risk
Convert technical signals into meaningful findings that can be investigated and acted upon.
Examples of security signals
Network behaviour can provide early evidence of compromise or policy violations.
Telemetry enrichment
A network event becomes significantly more useful when additional information is attached to it.
Turn technical telemetry into an actionable finding
An alert such as “192.168.1.20 uploaded 4 GB” provides a measurement. A more useful security finding explains that the device belongs to a sensitive system, the transfer is outside its normal behaviour, the destination has a poor reputation, and the activity requires investigation. The objective is context, not simply volume.
This is where analytical engines, statistical models and machine-learning techniques can help. Supervised models can learn from known behaviour or labelled examples, while unsupervised approaches can identify deviations from established patterns. In practice, effective security analytics combines these techniques with deterministic controls and additional telemetry rather than relying on a single algorithm.
Network analytics can also become part of an automated response chain. A high-confidence event may generate a security alert, trigger a workflow, send a webhook or provide information to another security platform. Lower-confidence events may simply increase monitoring or request additional investigation.
Turn Security Signals Into an Investigation
Not every alert is an incident. Collect network, identity, DNS, flow and endpoint evidence, remove weak signals, and determine whether the remaining evidence supports a real security investigation.
Unusual Flow Volume
Flow telemetry identifies a large outbound conversation. This is an important signal, but traffic volume alone does not prove malicious activity.
A large flow has been detected. Collect additional telemetry before deciding whether this represents malicious behaviour.