In today’s distributed and data-driven environments, valuable information rarely exists in a single system. Business applications, network infrastructure, cloud platforms, security tools, observability platforms, databases, APIs, and user activity can all generate data independently. The challenge is not simply collecting this information — it is understanding how the individual signals relate to one another.
Correlating disparate data means bringing information from different sources together to identify relationships, patterns, events, and dependencies that may not be visible when each data source is examined in isolation.
A data point on its own may provide very little context. A network latency measurement, application error, authentication event, and infrastructure alert may initially appear unrelated. When these events are aligned by attributes such as time, identity, location, service, device, IP address, transaction, or resource, they can become part of a much larger operational picture.
Understanding Disparate Data
Disparate data refers to information that originates from different systems, formats, or operational contexts. The sources may produce structured records, semi-structured events, logs, metrics, traces, text, or categorical information.
For example, a modern application environment might generate:
Infrastructure data: CPU and memory utilisation, container events, virtual machines, cloud resources, and configuration changes.
Individually, these datasets provide only partial visibility. Correlation allows them to be examined as connected observations rather than isolated events.
Finding the Relationships
The first step is identifying the attributes that can act as common keys between datasets.
Time is often one of the most important correlation dimensions. An application failure occurring at the same time as a network path change or infrastructure event may provide an important investigative clue.
Other useful correlation attributes include:
Identity: user, service account, device, or application identity.
Network context: IP address, subnet, interface, port, flow, or network segment.
Application context: service, transaction ID, request ID, session, or API endpoint.
Business context: customer, order, transaction, location, or business process.
The more accurately these relationships can be established, the easier it becomes to move from isolated observations to meaningful operational context.
Analytical Techniques
Once datasets have been normalised and related, analytical techniques can be used to identify patterns.
Statistical analysis can reveal relationships between variables and identify unusual behaviour.
Clustering can group observations with similar characteristics, helping identify recurring patterns or previously unknown groups.
Time-series analysis can reveal trends, seasonality, changes, and anomalies across time.
Graph analysis can represent entities and relationships as connected structures, making it particularly useful for understanding dependencies between users, applications, services, devices, and infrastructure.
Machine learning can help identify complex patterns across large datasets and support anomaly detection, classification, forecasting, and event correlation.
Modern observability platforms also use correlation across metrics, logs, and distributed traces to help engineers move from a symptom to the underlying service or infrastructure involved.
Data Visualisation and Context
Visualisation is an important part of the correlation process because complex relationships can become difficult to understand when represented only as raw records.
Time-series charts can show when events occurred. Dependency maps can reveal relationships between services. Network diagrams can expose communication paths. Graph visualisations can highlight connections between entities. Dashboards can combine multiple telemetry sources into a common operational view.
The objective is not simply to create attractive charts. Effective visualisation should help answer questions such as:
What happened?
When did it happen?
What systems were involved?
What changed immediately beforehand?
Which other events occurred at the same time?
Is this an isolated event or part of a larger pattern?
Correlation Is Not Causation
One of the most important considerations when correlating data is that a relationship between two events does not automatically prove that one caused the other.
Two events may occur at the same time because they share a common dependency, infrastructure component, external condition, or upstream event.
For example, an increase in application errors occurring at the same time as increased network latency is a useful correlation. It is not, by itself, proof that the network caused the application failure.
Good analysis therefore combines correlation with additional evidence, such as event sequences, dependency information, configuration changes, controlled testing, historical behaviour, and system telemetry.
From Correlation to Operational Intelligence
The real value of disparate-data correlation is the ability to construct a contextual view of an event.
Instead of investigating a single alert in isolation, an engineer can connect the alert with related infrastructure changes, application behaviour, user activity, network telemetry, and historical events.
This approach is becoming increasingly important in cloud, distributed, and AI-enabled environments where the volume of telemetry can make manual investigation increasingly difficult.
The goal is therefore not simply to collect more data. It is to connect the right data, establish context, identify meaningful relationships, and turn those relationships into actionable insight.
As infrastructure becomes more distributed and systems generate increasingly large volumes of telemetry, the ability to correlate information across traditionally separate data sources will become an increasingly important capability for engineers, analysts, security teams, and AI-driven operational platforms.
Data Correlation Builder
Connect the Data. Reveal the Insight.
Modern applications generate telemetry across many domains. Select the sources and shared attributes that allow those seemingly separate data points to become one correlated view.
Learning ObjectiveBuild a meaningful correlation chain by connecting multiple data sources through shared context such as timestamps, transactions, services and performance metrics.
1. Select Data Sources
Choose the domains you would investigate during an application performance event.
2. Choose Correlation Attributes
3. Correlation Chain
Select at least two data sources to begin building the correlation chain.
Correlation Assessment
The stronger the shared context, the more useful the resulting correlation becomes.
Correlation Strength
0%
Awaiting correlation
Select multiple sources and shared attributes, then build the correlation.
Correlation Console
[READY] Correlation workspace initialised.[WAIT] Select data sources.
Engineering Takeaway
Correlation turns isolated telemetry into operational context. A timestamp, transaction identifier or service relationship can provide the bridge between data points that otherwise appear unrelated.
Highlights: Correlate Disparate Data Points
### Understanding the Importance of Data Correlation
In today’s data-driven world, the ability to correlate disparate data points has become an invaluable skill. Organizations are inundated with vast amounts of information from various sources, and the challenge lies in extracting meaningful insights from this data deluge. Correlating these data points not only helps in identifying patterns but also aids in making informed decisions that drive business success.
### Tools and Techniques for Effective Data Correlation
To effectively correlate disparate data points, it’s essential to leverage the right tools and techniques. Data visualization tools like Tableau and Power BI can help in identifying patterns by representing data in graphical formats. Statistical methods, such as regression analysis and correlation coefficients, are crucial for understanding relationships between variables. Additionally, machine learning algorithms can uncover hidden patterns that are not immediately apparent through traditional methods.
### Real-World Applications of Data Correlation
The ability to connect seemingly unrelated data points has applications across various industries. In healthcare, correlating patient data with treatment outcomes can lead to more effective care plans. In finance, analyzing market trends alongside economic indicators can aid in predicting stock movements. Retailers can enhance customer experience by correlating purchase history with seasonal trends to offer personalized recommendations. The possibilities are endless, and the impact can be transformative.
### Challenges in Correlating Disparate Data Points
While the benefits are clear, correlating disparate data points comes with its own set of challenges. Data quality and consistency are paramount, as inaccurate data can lead to misleading conclusions. Additionally, the sheer volume of data can be overwhelming, necessitating robust data management strategies. Privacy concerns also need to be addressed, particularly when dealing with sensitive information. Overcoming these challenges requires a combination of technological solutions and strategic planning.
Defining Disparate Data Points
To begin our journey, let’s first clearly understand what we mean by “disparate data points.” In data analysis, disparate data points refer to individual pieces of information that appear unrelated or disconnected at first glance. These data points could come from different sources, possess varying formats, or have diverse contexts.
One primary approach to correlating disparate data points is to identify common attributes. By thoroughly examining the data sets, we can search for shared characteristics, such as common variables, timestamps, or unique identifiers. These common attributes act as the foundation for establishing potential connections.
Considerations:
Utilizing Data Visualization Techniques: Visualizing data is a powerful tool when it comes to correlating disparate data points. By representing data in graphical forms like charts, graphs, or heatmaps, we can easily spot patterns, trends, or anomalies that might not be apparent in raw data. Leveraging advanced visualization techniques, such as network graphs or scatter plots, can further aid in identifying interconnections.
Applying Machine Learning and AI Algorithms: In recent years, machine learning and artificial intelligence algorithms have revolutionized the field of data analysis. These algorithms identify complex relationships and make predictions by leveraging vast amounts of data. We can discover hidden correlations and gain valuable predictive insights by training models on disparate data points.
Combining Data Sources and Integration: In some cases, correlating disparate data points requires integrating multiple data sources. This integration process involves merging data sets from different origins, standardizing formats, and resolving inconsistencies. Combining diverse data sources can create a unified view that enables more comprehensive analysis and correlation.
**The Required Monitoring Solution**
Digital transformation intensifies the touch between businesses, customers, and prospects. Although it expands workflow agility, it also introduces a significant level of complexity as it requires a more agile information technology (IT) architecture and increased data correlation. This belittles the network and application visibility, creating a substantial data volume and data points that require monitoring. The monitoring solution is needed to correlate disparate data points.
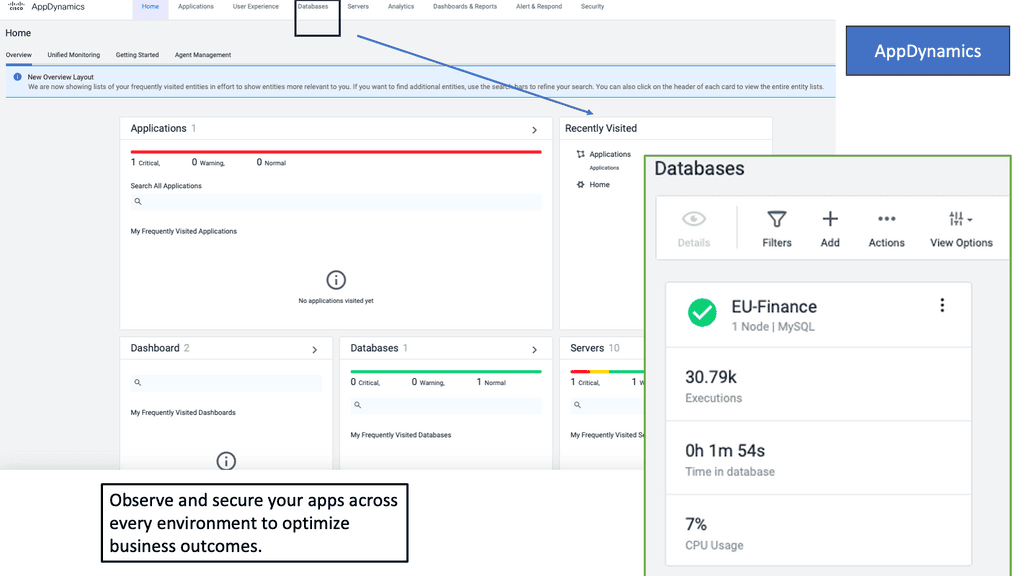
Example Product: Cisco AppDynamics
### Real-Time Monitoring and Analytics
One of the standout features of Cisco AppDynamics is its ability to provide real-time monitoring and analytics. This means you can get instant insights into your application’s performance, identify bottlenecks, and take immediate action to resolve issues. With its intuitive dashboard, you can easily visualize data and make informed decisions to enhance your application’s performance.
### End-to-End Visibility
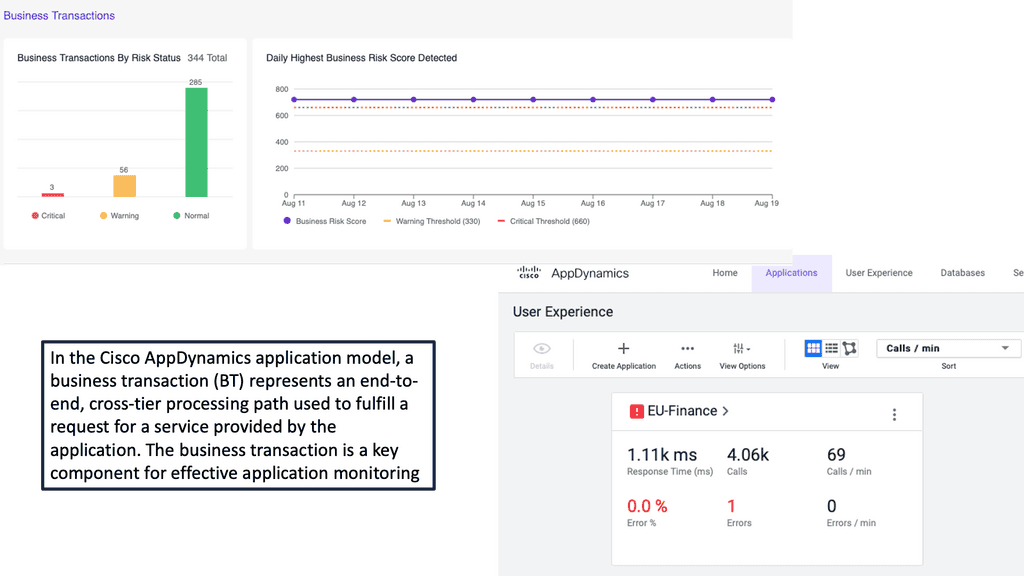
Cisco AppDynamics offers end-to-end visibility into your application’s performance. This feature allows you to track every transaction from the end-user to the back-end system. By understanding how each component of your application interacts, you can pinpoint the root cause of performance issues and optimize each layer for better performance.
### Automatic Discovery and Mapping
Another powerful feature of Cisco AppDynamics is its automatic discovery and mapping capabilities. The tool automatically discovers your application’s architecture and maps out all the dependencies. This helps you understand the complex relationships between different components and ensures you have a clear picture of your application’s infrastructure.
### Machine Learning and AI-Powered Insights
Cisco AppDynamics leverages machine learning and AI to provide predictive insights. By analyzing historical data, the tool can predict potential performance issues before they impact your users. This proactive approach allows you to address problems before they become critical, ensuring a seamless user experience.
Cross-Domain Troubleshooting Lab
Follow the Evidence Across the Stack
An application incident rarely belongs to one technical domain. Investigate the transaction across application, network and database telemetry, correlate the evidence and identify the earliest meaningful fault.
Learning ObjectiveTrace an application transaction across multiple infrastructure domains, separate symptoms from causes and use correlated evidence to identify the root cause.
Application Transaction Path
Click a component to inspect its telemetry. Then compare evidence across domains.
UserRequest origin
→
Web AppApplication
→
APIApplication
→
Load BalancerTraffic
→
DatabaseData
Telemetry Domains
Telemetry Evidence
Transaction IDTX-4821
Observed Time14:02:11
LatencyNormal
StatusAwaiting domain selection
Investigation Actions
Investigation Console
[READY] Incident investigation started.[INFO] Transaction TX-4821 is experiencing elevated latency.[HINT] Do not assume the application is the root cause.
Incident Investigation
Determine which event happened first and which measurements are downstream symptoms.
Incident
Users report slow application responses. Application latency has increased, but the root cause may exist elsewhere in the transaction path.
Investigation Progress0%
Correlation Clue
Inspect at least two telemetry domains before drawing a conclusion.
Root Cause Identified
Database query latency increased first at 14:02:08. Network retransmits and application latency followed. The application errors are therefore downstream symptoms rather than the originating fault.
Engineering Takeaway
Effective troubleshooting correlates evidence across domains instead of allowing teams to investigate in isolation. The earliest correlated signal is often more valuable than the most visible symptom.
Correlate Disparate Data Points
Data observability:
Over the last while, data has transformed almost everything we do, starting as a strategic asset and evolving the core strategy. However, managing data quality is the most critical barrier for organizations to scale data strategies due to the need to identify and remediate issues appropriately. Therefore, we need an approach to quickly detect, troubleshoot, and prevent a wide range of data issues through data observability, a set of best practices that enable data teams to gain greater visibility of data and its usage.
Identifying Disparate Data Points:
Disparate data points refer to information that appears unrelated or disconnected at first glance. They can be derived from multiple sources, such as customer behavior, market trends, social media interactions, or environmental factors. The challenge lies in recognizing the potential relationships between these seemingly unrelated data points and understanding the value they can bring when combined.
Unveiling Hidden Patterns:
Correlating disparate data points reveals hidden patterns that would otherwise remain unnoticed. For example, in the retail industry, correlating sales data with weather patterns may help identify the impact of weather conditions on consumer behavior. Similarly, correlating customer feedback with product features can provide insights into areas for improvement or potential new product ideas.
Benefits in Various Fields:
The ability to correlate disparate data points has significant implications across different domains. Analyzing patient data alongside environmental factors in healthcare can help identify potential triggers for certain diseases or conditions. In finance, correlating market data with social media sentiment can provide valuable insights for investment decisions. In transportation, correlating traffic data with weather conditions can optimize route planning and improve efficiency.
Tools and Techniques:
Advanced data analysis techniques and tools are essential to correlate disparate data points effectively. Machine learning algorithms, data visualization tools, and statistical models can help identify correlations and patterns within complex datasets. Data integration and cleaning processes are crucial in ensuring accurate and reliable results.
Challenges and Considerations:
Correlating disparate data points is not without its challenges. Combining data from different sources often involves data quality issues, inconsistencies, and compatibility challenges. Additionally, ethical considerations regarding data privacy and security must be considered when working with sensitive information.
Getting Started: Correlate Disparate Data Points
Many businesses feel overwhelmed by the amount of data they’re collecting and don’t know what to do with it. The digital world swells the volume of data and data correlation to which a business has access. Apart from impacting the network and server resources, the staff is also taxed in their attempts to manually analyze the data while resolving the root cause of the application or network performance problem. Furthermore, IT teams operate in silos, making it difficult to process data from all the IT domains – this severely limits business velocity.
Data Correlation: Technology Transformation
Conventional systems, while easy to troubleshoot and manage, do not meet today’s requirements, which has led to introducing an array of new technologies. The technological transformation umbrella includes virtualization, hybrid cloud, hyper-convergence, and containers.
While technically remarkable, introducing these technologies posed an array of operationally complex monitoring tasks, increased the volume of data, and required the correlation of disparate data points.Today’s infrastructures comprise complex technologies and architectures.
They entail a variety of sophisticated control planes consisting of next-generation routing and new principles such as software-defined networking (SDN), network function virtualization (NFV), service chaining, and virtualization solutions.
Virtualization and service chaining introduce new layers of complexity that don’t follow the traditional monitoring rules. Service chaining does not adhere to the standard packet forwarding paradigms, while virtualization hides layers of valuable information.
Micro-segmentation changes the security paradigm while introducing virtual machine (VM) mobility, which introduces north-to-south and east-to-west traffic trombones. The VM, which the application sits on, now has mobility requirements and may move instantly to different on-premise data center topology types or external to the hybrid cloud.
The hybrid cloud dissolves the traditional network perimeter and triggers disparate data points in multiple locations. Containers and microservices introduce a new wave of application complexity and data volume. Individual microservices require cross-communication, potentially located in geographically dispersed data centers.
All these new technologies increase the number of data points and volume of data by an order of magnitude. Therefore, an IT organization must compute millions of data points to correlate information from business transactions to infrastructures such as invoices and orders.
Growing Data Points & Volumes
The need to correlate disparate data points
As part of the digital transformation, organizations are launching more applications. More applications require additional infrastructure, which always snowballs, increasing the number of data points to monitor.
Breaking up a monolithic system into smaller, fine-grained microservices adds complexity when monitoring the system in production. With a monolithic application, we have well-known and prominent investigation starting points.
But the world of microservices introduces multiple data points to monitor, and it’s harder to pinpoint latency or other performance-related problems. The human capacity hasn’t changed – a human can correlate at most 100 data points per hour. The actual challenge surfaces because they are monitored in a silo.
Containers are deployed to run software that is found more reliable when moved from one computing environment to another. They are often used to increase business agility. However, the increase in agility comes at a high cost—containers generate 18x more data than they would in traditional environments. Conventional systems may have a manageable set of data points to be managed, while a full-fledged container architecture could have millions.
The amount of data to be correlated to support digital transformation far exceeds human capabilities. It’s just too much for the human brain to handle. Traditional monitoring methods are not prepared to meet the demands of what is known as “big data.” This is why some businesses use the big data analytics software from Kyligence.
That uses an AI-augmented engine to manage and optimize the data, allowing businesses to see their most valuable data, which helps them make decisions. While data volumes grow to an unprecedented level, visibility is decreasing due to the complexity of the new application style and the underlying infrastructure. All this is compounded by ineffective troubleshooting and team collaboration.
Ineffective Troubleshooting Team Collaboration
The application rides on various complex infrastructures and, at some stage, requires troubleshooting. Troubleshooting should be a science, but most departments use the manual method. This causes challenges with cross-team collaboration during an application troubleshooting event among multiple data center segments—network, storage, database, and application.
IT workflows are complex, and a single response/request query will touch all supporting infrastructure elements: routers, servers, storage, database, etc. For example, an application request may traverse the web front ends in one segment to be processed by database and storage modules on different segments. This may require firewalling or load-balancing services in various on and off-premise data centers.
IT departments will never have a single team overlooking all areas of the network, server, storage, database, and other infrastructure modules. The technical skill sets required are far too broad for any individual to handle efficiently.
Multiple technical teams are often distributed to support various technical skill levels at different locations, time zones, and cultures. Troubleshooting workflows between teams should be automated, although they are not because monitoring and troubleshooting are carried out in silos, completely lacking any data point correlation. The natural assumption is to add more people, which is nothing less than fueling the fire.
An efficient monitoring solution is a winning formula.
There is an increasingly vast lack of collaboration due to silo boundaries that don’t even allow you to look at each other’s environments. By the design of the silos, engineers blame each other as collaboration is not built by the very nature of how different technical teams communicate.
Engineers say bluntly, “It’s not my problem; it’s not my environment.” In reality, no one knows how to drill down and pinpoint the root cause. Mean Time to Innocence becomes the de facto working practice when the application faces downtime. It’s all about how you can save yourself. Compounding application complexity and the lack of efficient collaboration and troubleshooting science create a bleak picture.
How to Win the Race with Growing Volumes of Data and Data Volumes?
How do we resolve this mess and ensure the application meets the service level agreement (SLA) and operates at peak performance levels? The first thing you need to do is collect the data—not just from one domain but from all domains simultaneously. Data must be collected from various data points from all infrastructure modules, no matter how complicated.
Once the data is collected, application flows are detected, and the application path is computed in real-time. The data is extracted from all data center points and correlated to determine the exact path and time. The path visually presents the correct application route and over what devices the application is traversing.
For example, the application path can instantly show application A flowing over a particular switch, router, firewall, load balancer, web frontend, and database server.
**It’s An Application World**
The application path defines what infrastructure components are being used and will change dynamically in today’s environment. The application that rides over the infrastructure uses every element in the data center, including interconnects to the cloud and other off-premise physical or virtual locations.
Customers are well informed about the products and services, as they have all the information at their fingertips. This makes the work of applications complex to deliver excellent results. Having the right objectives and key results (OKRs) is essential to comprehending the business’s top priorities and working towards them. You can review some examples of OKRs by profit to learn more about this topic.
That said, it is essential to note that an issue with critical application performance can happen in any compartment or domain on which the application depends. In a world that monitors everything but monitors in a silo, it’s difficult to understand the cause of the application problem quickly. The majority of time is spent isolating and identifying rather than fixing the problem.
Imagine a monitoring solution helping customers select the best coffee shop to order a cup from. The customer has a variety of coffee shops to choose from, and there are several lanes in each. One lane could be blocked due to a spillage, while the other could be slow due to a training cashier. Wouldn’t having all this information upfront before leaving your house be great?
Economic Value:
Time is money in two ways. First is the cost, and the other is damage to the company brand due to poor application performance. Each device requires several essential data points to monitor. These data points contribute to determining the overall health of the infrastructure.
Fifteen data points aren’t too bad to monitor, but what about a million data points? These points must be observed and correlated across teams to conclude application performance. Unfortunately, the traditional monitoring approach in silos has a high time value.
Using traditional monitoring methods and in the face of application downtime, the theory of elimination and answers are not easily accessible to the engineer. There is a time value that creates a cost. Given the amount of data today, on average, it takes 4 hours to repair an outage, and an outage costs $300K.
If revenue is lost, the cost to the enterprise, on average, is $5.6M. How much will it take, and what price will a company incur if the amount of data increases 18x? A recent report states that only 21% of organizations can successfully troubleshoot within the first hour. That’s an expensive hour that could have been saved with the proper monitoring solution.
There is real economic value in applying the correct monitoring solution to the problem and adequately correlating between silos. What if a solution does all the correlation? The time value is now shortened because, algorithmically, the system is carrying out the heavy-duty manual work for you.
Observability Correlation Center
Detect. Correlate. Explain.
Modern environments produce enormous volumes of telemetry. The challenge is not simply collecting events, but determining which events belong to the same incident and explaining the relationship between them.
Learning ObjectiveCorrelate multiple telemetry events into a single incident, identify the originating fault and distinguish the root cause from downstream symptoms.
Live Telemetry Event Stream
Select events that appear related. Then correlate the timeline and determine whether they form one incident.
TimeSourceEventState
Selected Evidence
Select telemetry events to investigate their relationship.
Observability Console
[READY] Observability event stream connected.[INFO] Six telemetry sources are reporting.[HINT] Not every event belongs to the same incident.
Incident Correlation
Build the operational story from the evidence rather than investigating each signal independently.
Incident StatusInvestigating
Checkout Performance Degradation
Multiple systems are reporting abnormal behaviour. The relationship between the events has not yet been established.
Correlated Event Path
Select Events
Correlation Confidence0%
Incident Explanation
Select related events, correlate them and build the timeline before explaining the incident.
Engineering Takeaway
Observability becomes powerful when telemetry is correlated into an explanation. The objective is not to monitor everything independently, but to understand how events combine into an application-level incident.
Kubernetes networking is fundamental to how applications communicate inside and outside a cluster. Unlike traditional server networking, Kubernetes creates an abstraction around rapidly changing workloads: Pods can be created, destroyed, rescheduled, and moved between nodes while applications still need reliable ways to communicate. Understanding the Kubernetes network model therefore requires looking at how Pods, Nodes, Services, DNS, CNI plugins, and network policy work together.
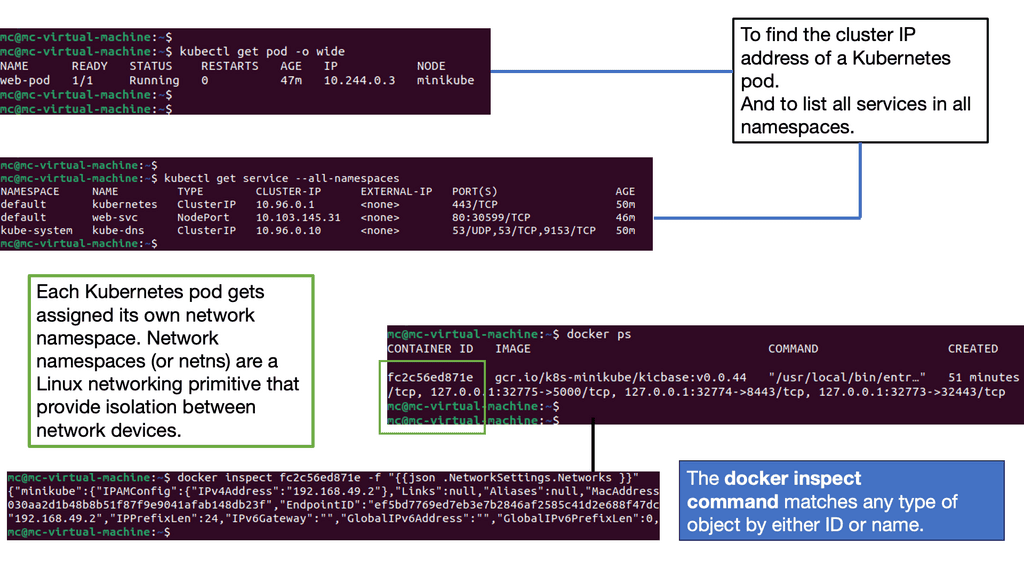
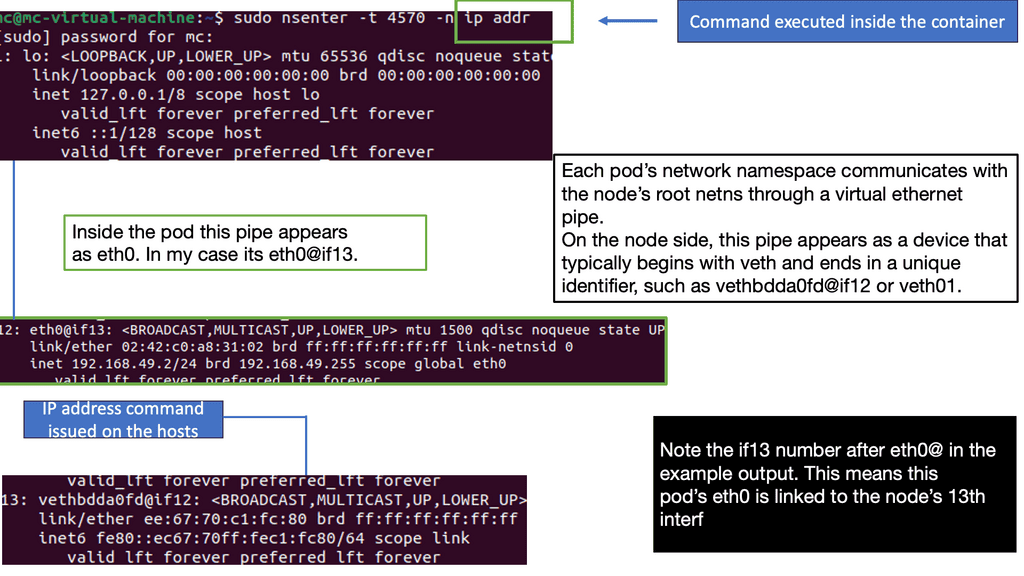
Pods and the Kubernetes Network Model: A Pod is the smallest deployable unit in Kubernetes and receives its own IP address within the cluster network. Containers within the same Pod share the Pod’s network namespace and can communicate through localhost. Pods on different nodes must also be able to communicate across the cluster network without requiring application-level NAT between them. This connectivity is provided by the cluster’s networking implementation and is one of the fundamental assumptions of the Kubernetes network model.
Container Network Interface (CNI): Kubernetes does not itself implement the complete Pod networking data plane. Instead, networking is commonly provided through a CNI-based implementation. The CNI layer is responsible for tasks such as assigning Pod IP addresses and configuring the interfaces, routes, and connectivity required for Pods to communicate. Different networking implementations provide different capabilities, including routing, encapsulation, network policy enforcement, encryption, observability, and advanced traffic controls. Common technologies include Calico, Cilium, and Flannel, although their architectures and feature sets differ significantly.
Services and Service Discovery: Pod IP addresses are not normally treated as permanent application endpoints because Pods are ephemeral. Kubernetes Services provide a stable abstraction in front of a changing group of Pods. A Service selects matching Pods and provides a stable virtual endpoint through which clients can reach them. Kubernetes also maintains endpoint information, commonly represented through EndpointSlices, allowing the control plane and networking components to track the current set of usable backends.
Kubernetes DNS: Service discovery is closely integrated with cluster DNS. Applications can normally communicate with Services using DNS names rather than maintaining lists of Pod IP addresses. This allows applications to remain largely independent of where individual Pods are running. DNS therefore becomes an important part of the Kubernetes application networking model rather than simply an optional convenience.
Service Traffic and Load Distribution: Traffic sent to a Service must ultimately be directed toward one of its available backend Pods. The exact implementation depends on the Kubernetes networking stack and configuration. Traditional deployments commonly use kube-proxy with mechanisms such as iptables or IPVS, while other networking implementations can provide Service handling directly through technologies such as eBPF. The important architectural distinction is between the stable Service abstraction presented to applications and the underlying mechanism used to reach individual backends.
Ingress and Gateway Networking: Kubernetes applications frequently need to receive traffic from outside the cluster. Ingress provides a widely used API for HTTP and HTTPS routing, but modern Kubernetes environments are increasingly adopting the Gateway API for more expressive traffic management. These APIs define how external traffic can be routed toward Services, while the actual data-plane implementation is provided by an ingress controller, gateway implementation, load balancer, or other networking technology.
Network Policies and Security: Kubernetes networking is not complete without understanding traffic control. NetworkPolicy can be used to define which connections are permitted between workloads and other network endpoints. Policies commonly restrict traffic according to namespaces, Pod labels, IP ranges, and ports. However, defining a NetworkPolicy object does not by itself guarantee enforcement; the cluster’s networking implementation must support and enforce the relevant policy capabilities. Effective Kubernetes security therefore combines network policy with identity, authentication, authorization, encryption, segmentation, and workload security.
North-South and East-West Traffic: Kubernetes networking can also be understood in terms of traffic direction. East-west traffic describes communication between workloads within the cluster or across cluster nodes. North-south trafficdescribes traffic entering or leaving the cluster. These paths may involve different components, policies, load balancers, gateways, firewalls, and routing mechanisms. Understanding both paths is essential when troubleshooting connectivity and designing secure production environments.
Observability and Troubleshooting: When Kubernetes networking fails, checking whether a Pod is “Running” is not enough. Engineers may need to examine Pod IP addresses, routes, DNS resolution, Services, EndpointSlices, NetworkPolicies, CNI configuration, node connectivity, firewall rules, load balancers, and application-level behaviour. Packet captures, flow telemetry, CNI observability, DNS diagnostics, and Kubernetes events can help identify where communication is failing.
Kubernetes networking therefore forms a layered system:
Pod → CNI Network → Node/Cluster Network → Service → DNS/Discovery → Gateway or Load Balancer → External Network
The exact implementation varies between Kubernetes distributions and networking platforms, but the underlying architectural principles remain consistent. Pods need network connectivity, Services provide stable application endpoints, DNS enables service discovery, networking implementations provide the data plane, and policies control permitted communication.
Mastering Kubernetes networking is consequently more than understanding how Pods obtain IP addresses. It means understanding how traffic moves, where identity and policy are applied, how Services locate workloads, how external traffic enters the cluster, and how the underlying networking implementation forwards and secures packets.
Widget 1 · Visualise
Follow the Packet: How Kubernetes Networking Works
Purpose: build the mental model before experimenting.
Choose a traffic path and watch how Kubernetes moves traffic between
Pods, Services and external clients. The goal is to understand the
networking abstractions, not just memorise component names.
🌐
External Client
User / Internet traffic
🚪
Ingress
HTTP/HTTPS entry point
⚖️
Service
Stable virtual endpoint
📦
Pod
Application workload
Direct Pod-to-Pod communication
1 · Source
2 · Network path
3 · Destination
What changes?
SourcePod
Stable endpointNone
Routing abstractionPod network
Application targetDestination Pod
Learning Point
Pods communicate over the Kubernetes network using Pod IP
addresses. The important mental model is that the application
workload lives inside the Pod while Kubernetes provides the
networking model around it.
Highlights: Kubernetes Networking 101
## The Basics of Kubernetes Networking
At its core, Kubernetes networking ensures that your containers can communicate with each other and with the outside world. Each pod in Kubernetes is assigned its own IP address, and these addresses are used to set up direct communication paths. Unlike traditional networking, there are no port mappings required, and every pod can communicate with every other pod without any NAT (Network Address Translation). This flat networking model simplifies communication but comes with its own set of challenges and considerations.
## Network Policies: Controlling Traffic Flow
Kubernetes allows you to control the traffic flow to and from your pods using Network Policies. These policies act as a firewall for your Kubernetes cluster, enabling you to define rules that dictate how pods can communicate with each other and with external services. By default, all communications are allowed, but you can create Network Policies to restrict access based on security requirements. Implementing these policies is crucial for maintaining a secure and efficient Kubernetes environment.
## Service Discovery and Load Balancing
In Kubernetes, services are used to expose your applications to the outside world and to enable communication within the cluster. Each service is assigned a unique IP address and acts as a load balancer, distributing traffic across the pods in the service. Kubernetes provides built-in service discovery, making it easy to locate other services using DNS. This seamless integration simplifies the process of deploying scalable applications, ensuring that your services are always reachable and responsive.
## Advanced Networking: CNI Plugins and Ingress Controllers
For more advanced networking requirements, Kubernetes supports CNI (Container Network Interface) plugins. These plugins allow you to extend the networking capabilities of your cluster, providing additional features such as custom IPAM (IP Address Management) and advanced routing. In addition to CNI plugins, Ingress Controllers are used to manage external HTTP and HTTPS traffic, offering more granular control over how your services are exposed to the outside world. Understanding and configuring these advanced networking features is key to leveraging the full potential of Kubernetes.
Kubernetes Components
To comprehend Kubernetes networking, we must first delve into the world of Pods. A Pod represents the smallest unit in the Kubernetes ecosystem, encapsulating one or more containers. Despite sharing the same network namespace, each Pod possesses a unique IP address, enabling inter-Pod communication. However, it is crucial to understand how Pods communicate with each other within a cluster.
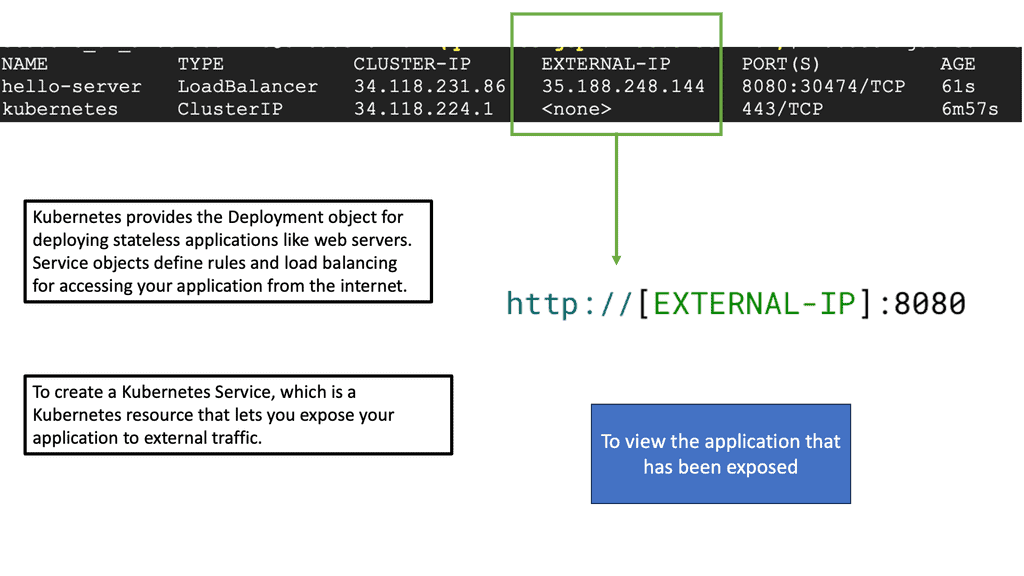
Services act as an abstraction layer, facilitating the discovery and load balancing of Pods. By defining a Service, developers can decouple applications from specific Pod IP addresses, as Services provide a stable endpoint for internal communication. Furthermore, Services enable external access to Pods through the use of NodePorts or LoadBalancers, making them an essential component for networking in Kubernetes.
Ingress, a powerful Kubernetes resource, allows for the exposure of HTTP and HTTPS routes to external traffic. By implementing Ingress, developers can define rules and routes, effectively managing inbound traffic to their applications. This flexible and scalable approach simplifies networking complexities and provides a seamless experience for end-users accessing Kubernetes services.
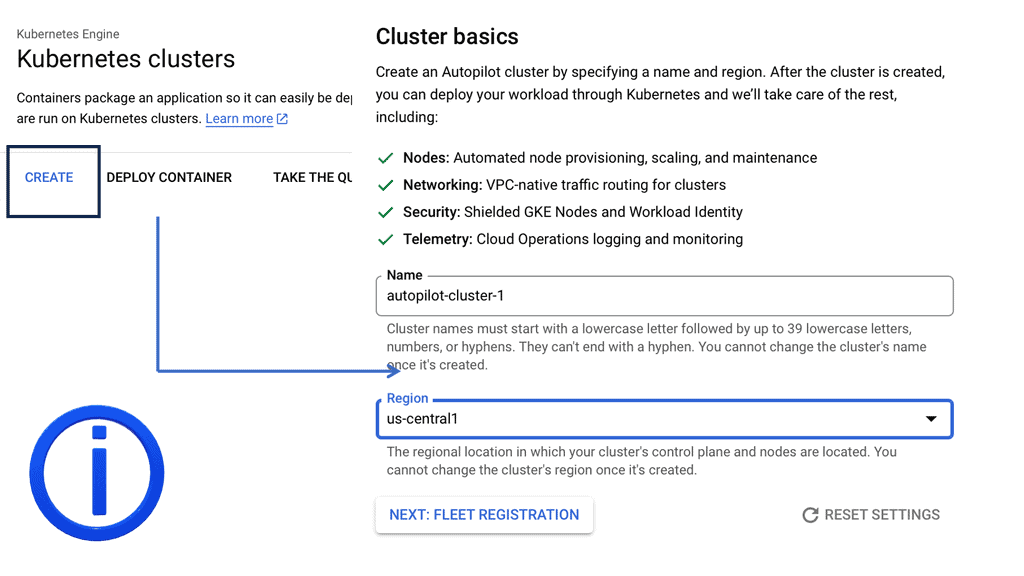
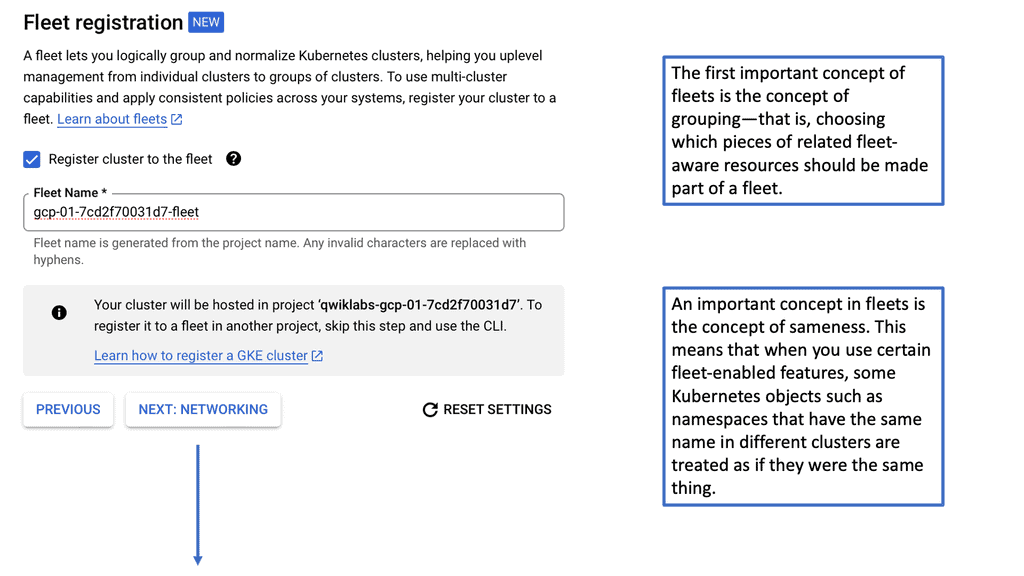
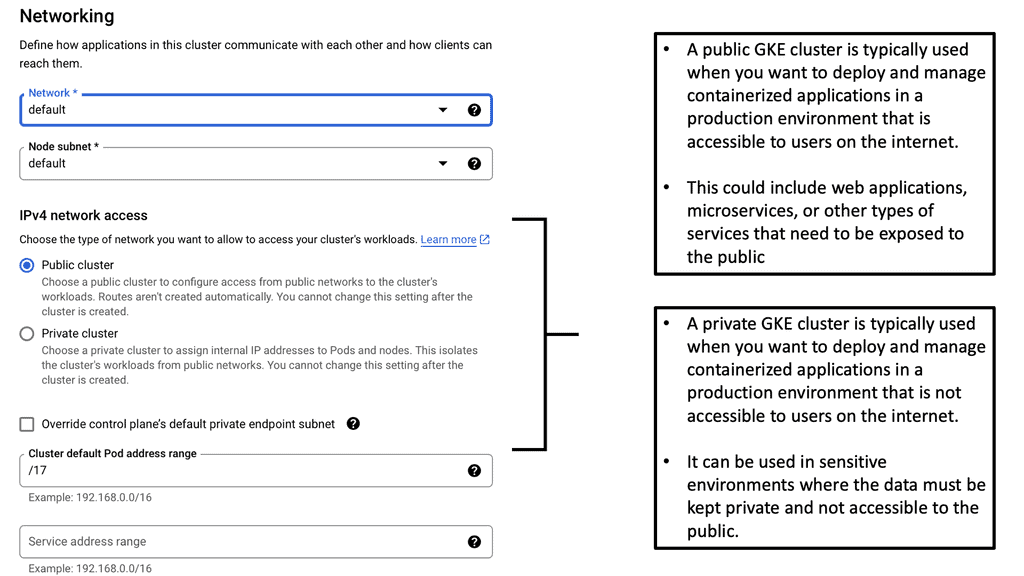
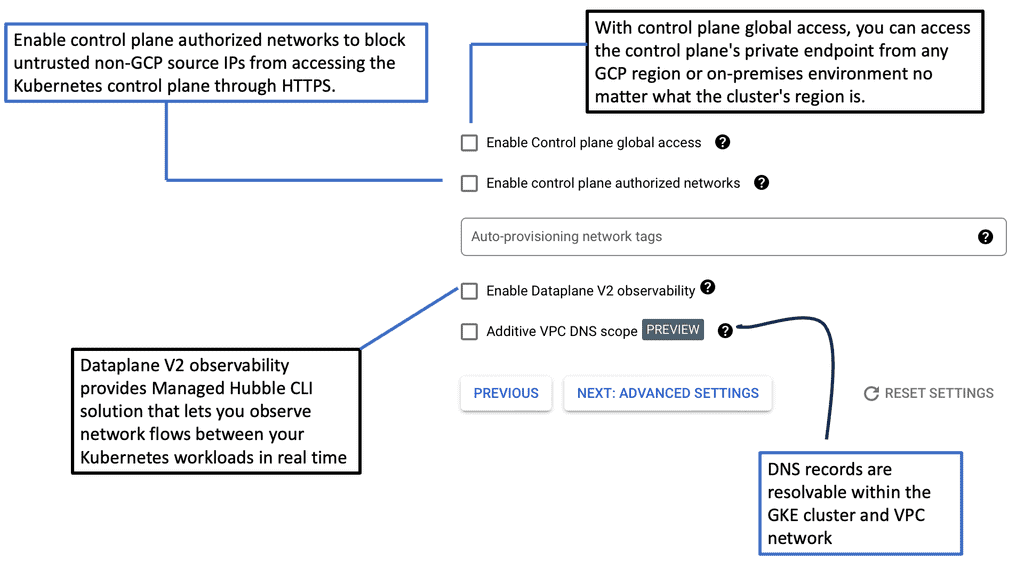
Kubernetes Clusters in GKE
#### Why Choose Google Cloud for Your Kubernetes Cluster?
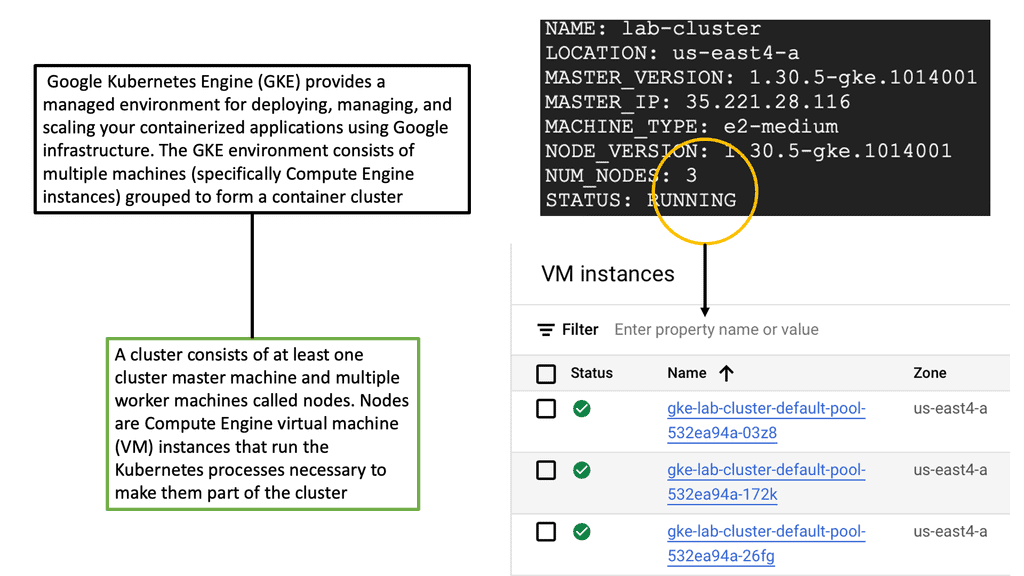
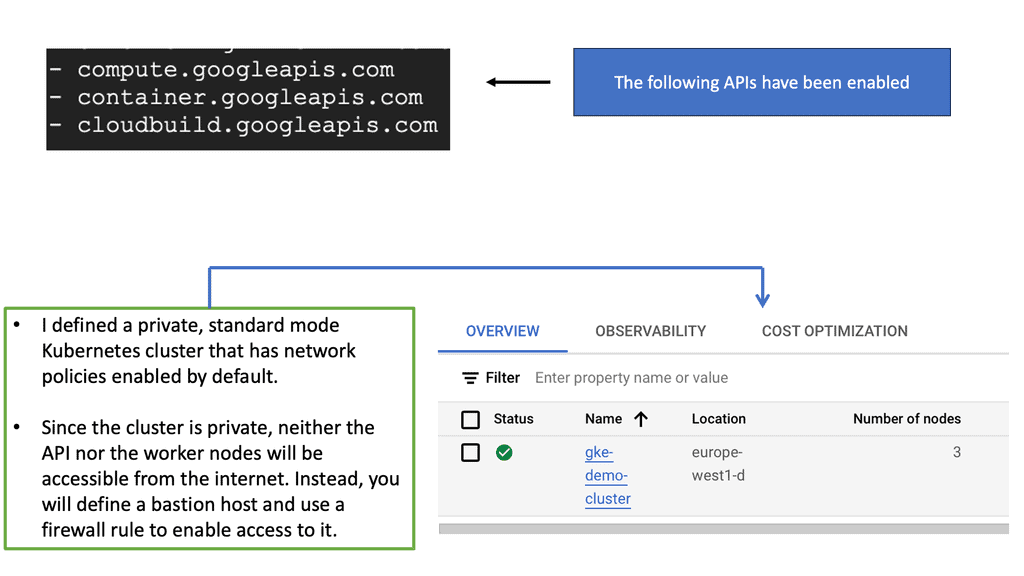
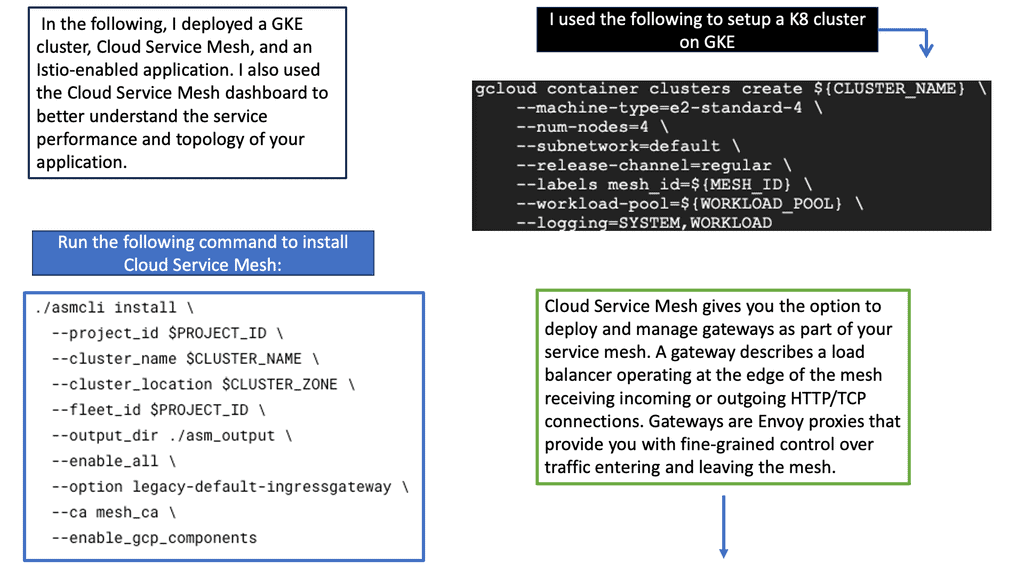
Google Cloud offers a unique advantage when it comes to running Kubernetes clusters. As the original creators of Kubernetes, Google offers deep integration between Kubernetes and its cloud services. Google Kubernetes Engine (GKE) provides a fully managed Kubernetes service, allowing developers to focus more on building and less on managing infrastructure. With GKE, you get the benefit of automatic upgrades, patching, and scaling, all backed by Google’s robust infrastructure. This ensures high availability and security for your applications, making it an ideal choice for businesses looking to leverage Kubernetes without the operational overhead.
#### Setting Up Your Kubernetes Cluster on Google Cloud
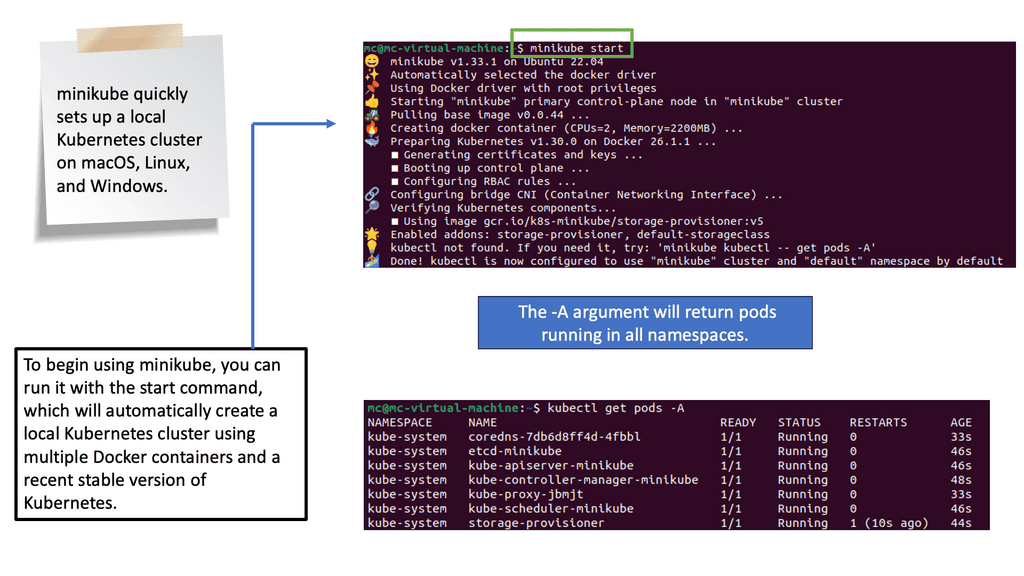
Setting up a Kubernetes cluster on Google Cloud is a straightforward process, thanks to the streamlined interface and comprehensive documentation provided by Google. First, you need to create a Google Cloud project and enable the Kubernetes Engine API. After that, you can use the Google Cloud Console or the `gcloud` command-line tool to create a new cluster. Google Cloud provides various configuration options, allowing you to customize the cluster to fit your specific needs, whether that’s optimizing for cost, performance, or a balance of both.
#### Best Practices for Managing Kubernetes Clusters
Once your Kubernetes cluster is up and running, managing it effectively becomes crucial. Google Cloud offers several tools and features to help with this. It’s recommended to use Google Cloud’s monitoring and logging services to keep track of your cluster’s performance and health. Implementing automated scaling helps you handle varying workloads without manual intervention. Additionally, consider using Kubernetes namespaces to organize your resources efficiently, enabling better resource allocation and access control across your teams.
Understanding Pods and Services
One of the fundamental building blocks of Kubernetes networking is the concept of Pods and Services. Pods are the smallest unit in the platform and house one or more containers. Understanding how Pods communicate with each other and external entities is crucial. On the other hand, services provide a stable endpoint for accessing a group of Pods.
– Cluster Networking: A robust networking solution is required for Pods and Services to communicate seamlessly within a Kubernetes cluster. We’ll dive into the inner workings of cluster networking, discussing popular networking plugins such as Calico, Flannel, and Cilium.
– Ingress and Load Balancing: Kubernetes offers Ingress and load-balancing capabilities when exposing applications to the outside world. In this section, we’ll demystify Ingress, its role in routing external traffic to Services, and how to configure it effectively. We’ll also explore load-balancing options to ensure optimal traffic distribution across Pods.
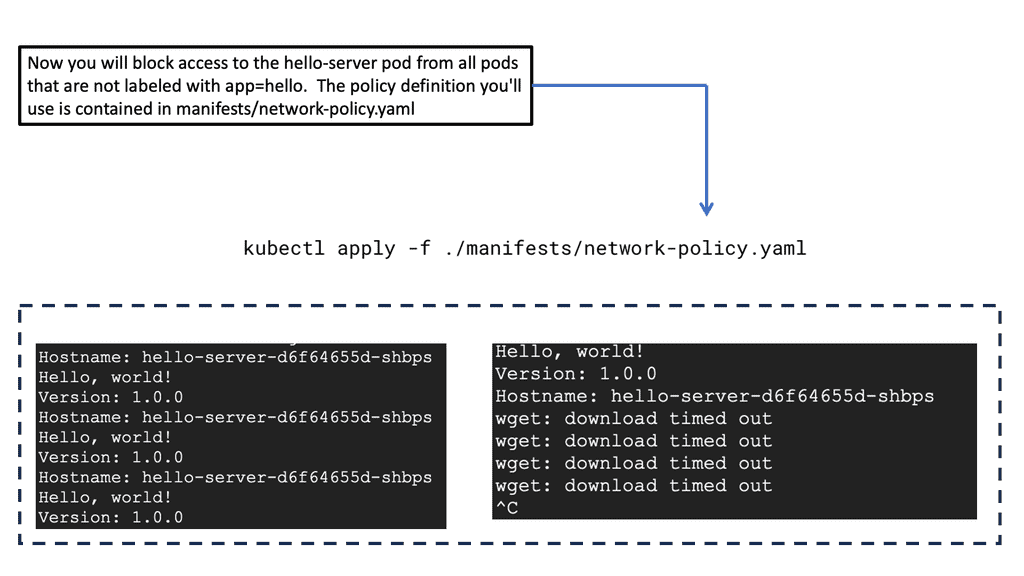
– Network Security and Policies: With the increasing complexity of modern applications, network security becomes paramount. Kubernetes provides robust mechanisms to enforce network policies and secure communication between Pods. We’ll discuss how to define and apply network policies effectively, ensuring only authorized traffic flows within the cluster.
**Kubernetes networking aims to solve the following problems**
Container-to-container communications with high coupling
A pod-to-pod communication system
Communicating from a pod to a service
External-to-service communications
A virtual bridge network is a private network that containers attach to in the Docker networking model. Containers are allocated private IP addresses, so containers running on different machines cannot communicate. Docker allows developers to proxy traffic across nodes by mapping host ports to container ports. Docker administrators, usually system administrators, avoid port clashes in this scenario. In Kubernetes networking, it is handled differently.
The Kubernetes Networking Model
Kubernetes’ native networking model is capable of supporting multi-host cluster networking. Pods can communicate with each other by default, regardless of their hosts. Kubernetes relies on the CNI project to comply with the following requirements:
Without NAT, all containers must be able to communicate with each other.
Containers and nodes can communicate without NAT.
The IP address of a container matches the IP address of those outside the container.
A pod is a unit of work in Kubernetes. Containers in pods are always scheduled and run “together” on the same node. It is possible to separate instances of a service into distinct containers using this connectivity. Developers may run services in one container and log forwarders in another. Having processes running in separate containers allows them to have separate resource quotas (e.g., “the log forwarder cannot use more than 512 MB of memory”). Reducing the scope necessary to build a container also separates container build and deployment machinery.
The Kubernetes History
Google released Kubernetes, an open-source cluster management tool, in June 2014. Google has said it launches over 2 billion containers per week, and Kubernetes was designed to control and manage the orchestration of all these containers and container networking. Initially, they built a Borg and Omega system, resulting in Kubernetes.
All lessons learned from Borg to Kubernetes are now passed to the open-source community. Kubernetes went 1.0 in July 2015 and is now at version 1.3.0. The Kubernetes deployment supports GCE, AWS, Azure, vSphere, and bare metal, and there are a variety of Kubernetes networking configuration parameters. Kubernetes forms the base for OpenShift networking.
Kubernetes information check.
For additional information, before you go with Kubernetes networking 101, the post on Kubernetes chaos engineering discusses the need to stress and break a system, which is the only way to understand and optimize fully. Chaos Engineering starts with a baseline and introduces several controlled experiments. Then we have Kubernetes security best practice discuss the Kubernetes attack vectors and how to protect against them.
Understanding Pods & Service
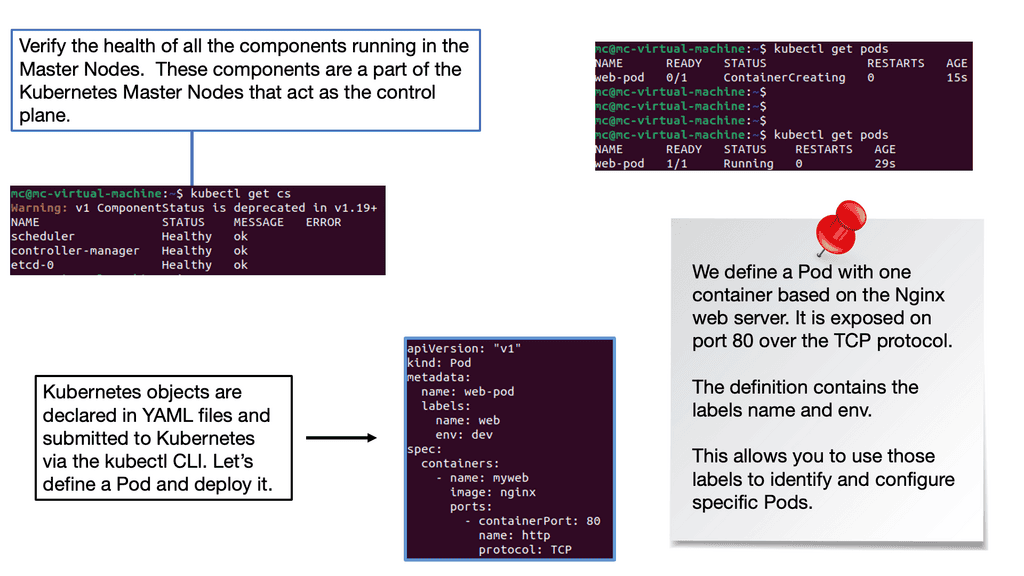
Before diving into deploying pods and services, it’s crucial to understand what a pod is within the context of Kubernetes. A pod is the smallest deployment unit in Kubernetes and can consist of one or more containers. Pods are designed to run a single instance of a specific application, sharing the same network and storage resources. By grouping containers, pods enable efficient communication and coordination between them.
Note: Deploying Pods
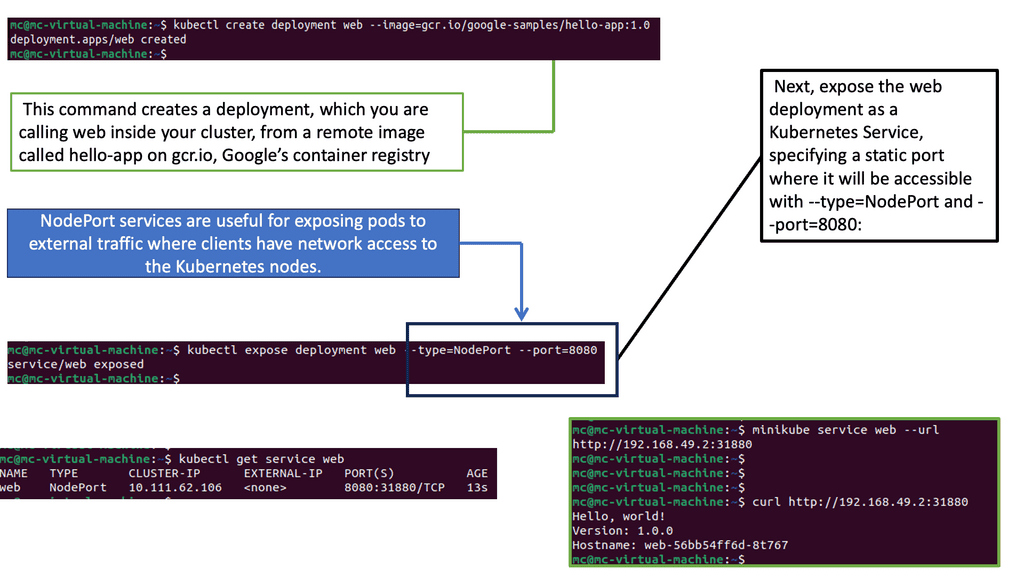
Now that we have a basic understanding of pods let’s explore the process of deploying one. To deploy a pod, you must create a YAML file describing its specifications, including the container image, resource requirements, and any necessary environment variables. Once the YAML file is created, you can use the `kubectl` command-line tool to apply the configuration and create the pod. It’s essential to verify the pod’s status using `kubectl get pods` and ensure it runs successfully.
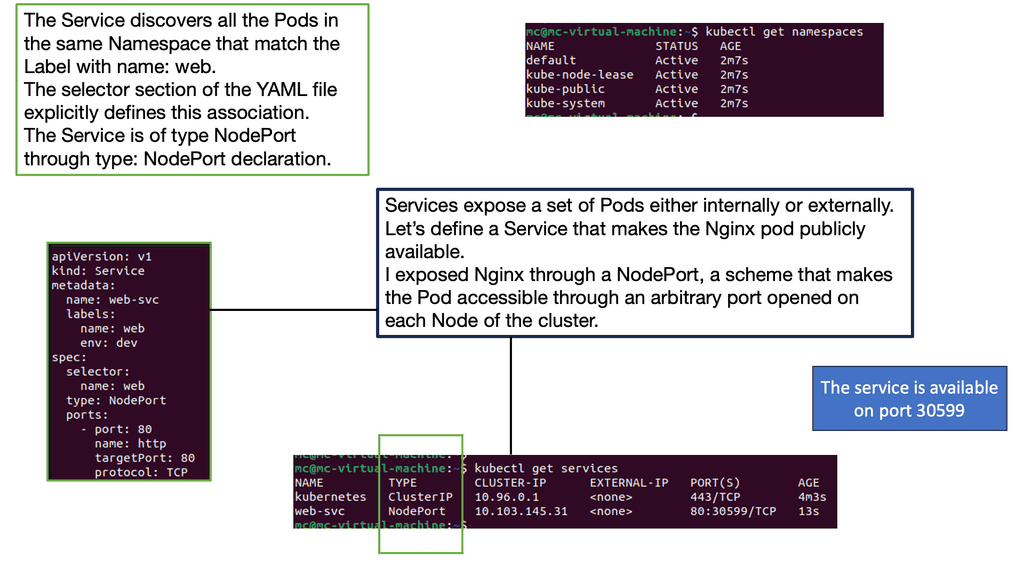
While pods enable the deployment of individual containers, services expose these pods to the external world. Services act as an abstraction layer, allowing applications to communicate with pods without knowing their specific IP addresses or ports. Kubernetes offers various services, such as ClusterIP, NodePort, and LoadBalancer, each catering to different networking requirements.
Note: YAML File Specifications
You must create another YAML file defining its specifications to deploy a service. This includes selecting the appropriate service type, specifying the target port and protocol, and associating it with the corresponding pod using labels. Once the YAML file is ready, you can use `kubectl` to create the service. By default, services are assigned a ClusterIP, which enables communication within the cluster. Depending on your needs, you may expose the service externally using NodePort or LoadBalancer.
Note: Kubernetes Scaling Abilities
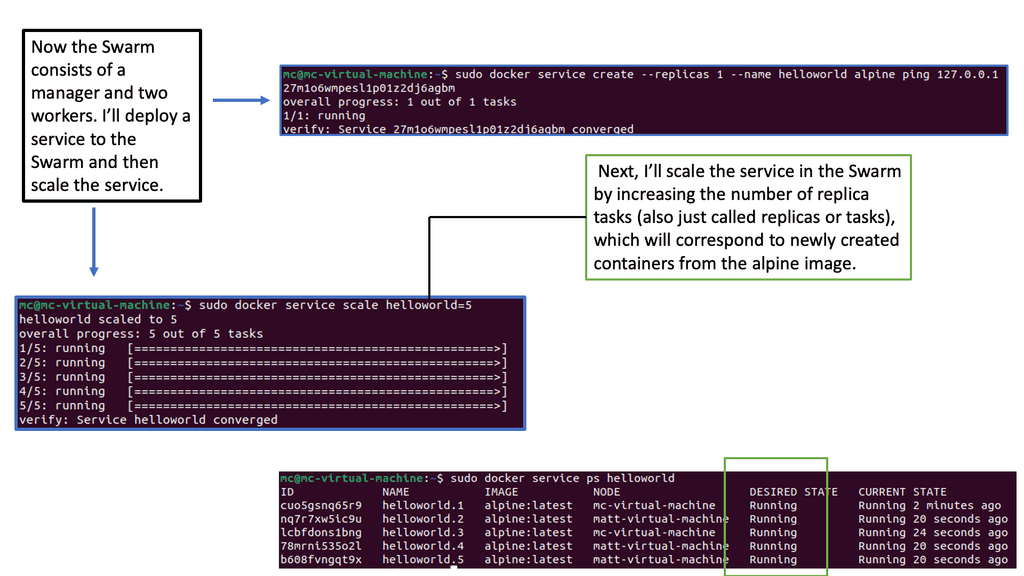
One of Kubernetes’ key advantages is its ability to scale applications effortlessly. By adjusting the replica count in the deployment YAML file and applying the changes, Kubernetes automatically creates or terminates pods to maintain the desired replicas. Additionally, Kubernetes provides various commands and tools to monitor and manage deployments, allowing you to upgrade or roll back to previous versions easily.
Kubernetes Networking vs Docker Swarm
### Understanding Kubernetes Networking
Kubernetes, often hailed as the king of container orchestration, offers a robust and flexible networking model. At its core, Kubernetes assigns each pod its own IP address, providing a flat network structure. This means that Kubernetes does not require you to map ports between containers, simplifying communication. The Kubernetes network model supports various plugins through the Container Network Interface (CNI), allowing seamless integration with different cloud providers and on-premise systems. Moreover, Kubernetes supports complex networking policies, enabling fine-grained control over traffic flow and security.
### Docker Swarm’s Networking Simplicity
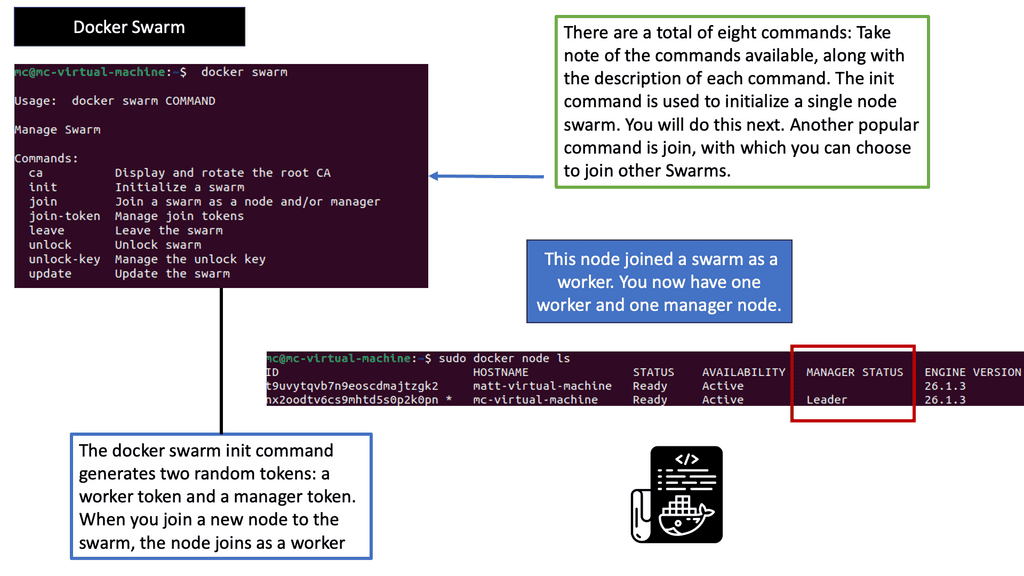
Docker Swarm, on the other hand, is known for its simplicity and ease of use. It provides an overlay network that enables services to communicate with each other across nodes seamlessly. Swarm’s networking is straightforward to set up and manage, making it appealing for smaller teams or projects with less complex networking needs. Docker Swarm also supports load balancing and service discovery out of the box. However, it lacks the extensive networking plugins and policy features available in Kubernetes, which might limit its scalability in larger, more complex environments.
### Performance and Scalability: A Comparative Analysis
When it comes to performance, both Kubernetes and Docker Swarm have their pros and cons. Kubernetes is designed for scalability, capable of handling thousands of nodes and pods. Its networking model is highly efficient, ensuring minimal latency in communication. Docker Swarm, while efficient for smaller clusters, might face challenges scaling to the level of Kubernetes. The simplicity of Swarm’s networking can become a bottleneck in environments that require more sophisticated networking configurations and optimizations. Thus, choosing between the two often depends on the scale and complexity of the deployment.
### Security Considerations
Security is a paramount concern in any networking setup. Kubernetes offers a range of security features, including network policies, secrets management, and role-based access control (RBAC). These features allow administrators to define and enforce security rules at a granular level. Docker Swarm, though simpler in its networking approach, provides basic security features such as mutual TLS encryption and node certificates. While adequate for many use cases, Swarm’s security features may not meet the needs of organizations with stricter compliance requirements.
Widget 2 · Experiment
Service Discovery & Load-Balancing Lab
Purpose: experiment with what happens behind a Kubernetes
Service. Change the number of replicas, the Service selector and endpoint
health, then send requests and observe which Pods can receive traffic.
This makes the difference between a stable Service endpoint
and the individual Pod endpoints visible.
4 Pods
📡
Client
⚖️
web-service
Stable Service endpoint
🎯
Endpoints
Service selector:app=web
—
only matching healthy Pods are treated as usable endpoints in this
illustrative experiment.
Live Result
Active endpoints4
Requests sent0
Requests served0
Requests dropped0
Traffic Distribution
What You Learned
A Service gives clients a stable destination while the backend
Pods can change. Try increasing replicas and sending requests,
then fail an endpoint and run the experiment again.
Kubernetes Networking 101
Google Cloud Data Centers
## Why Google Cloud for Kubernetes?
Google Cloud is a popular choice for running Kubernetes clusters due to its scalability, reliability, and integration with other Google Cloud services. Google Kubernetes Engine (GKE) allows users to quickly and easily deploy Kubernetes clusters, offering features like automatic scaling, monitoring, and seamless updates. With GKE, you can focus on developing your applications while Google handles the underlying infrastructure, ensuring your applications run smoothly.
## Setting Up Your First Kubernetes Cluster on Google Cloud
Deploying a Kubernetes cluster on Google Cloud involves several steps. First, you’ll need to set up a Google Cloud account and enable the Kubernetes Engine API. Then, using the Google Cloud Console or Cloud SDK, you can create a new Kubernetes cluster. Configuring your cluster involves selecting the appropriate machine types, defining node pools, and setting up networking and security policies. Once your cluster is set up, you can deploy applications, manage resources, and scale your infrastructure as needed.
## Best Practices for Managing Kubernetes Clusters
Effectively managing your Kubernetes clusters involves implementing several best practices. These include monitoring cluster performance using Google Cloud’s Stackdriver, automating deployments with CI/CD pipelines, and implementing robust security measures such as role-based access control (RBAC) and network policies. Additionally, regularly updating your clusters and applications ensures that you benefit from the latest features and security patches.
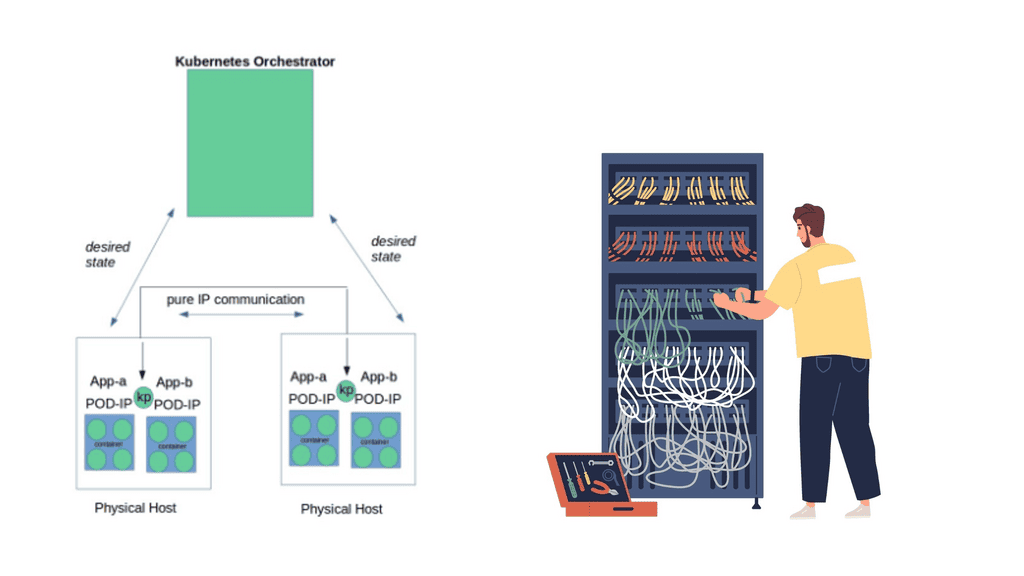
At a very high level, Kubernetes Networking 101 enables a group of hosts to be viewed as a single compute instance. The single compute instance, consisting of multiple physical hosts, is used to deploy containers. This offers an entirely different abstraction level to our single-container deployments.
Users start thinking about high-level application services and the concept of service design only. They are no longer concerned with individual container deployment, as the orchestrator looks after the deployment, scale, and management.
For example, if users specify to the orchestration system they want a specific type of application with defined requirements, now deploy it for me. The orchestrator manages the entire rollout, specifies the targeted hosts, and manages the container lifecycle. The user doesn’t get involved with host selection. This abstraction allows users to focus only on design and workload requirements – the orchestrator takes care of all the low-level deployment and management details.
Diagram: Kubernetes Networking 101
1. Pods:
Pods are the fundamental building blocks of Kubernetes. They consist of one or more containers that share a common network namespace. Each pod receives a unique IP address, allowing containers within the pod to communicate via localhost. However, communication between different pods requires additional networking components.
2. Services:
Services provide a stable and abstracted network endpoint to access a set of pods. By grouping pods based on a standard label, services ensure that applications can discover and communicate with each other seamlessly. Kubernetes offers four types of services: ClusterIP, NodePort, LoadBalancer, and ExternalName. Each service type caters to specific use cases, providing varying levels of accessibility.
3. Ingress:
Ingress is a Kubernetes resource that enables inbound connections to reach services within the cluster. It acts as a traffic controller, routing external requests to the appropriate service based on rules defined in the Ingress resource. Additionally, Ingress supports TLS termination, allowing secure communication with services.
Networking Concepts:
To comprehend Kubernetes networking fully, it is essential to grasp critical concepts that govern its behavior.
1. Cluster Networking:
Cluster networking refers to the communication between pods running on different nodes within a Kubernetes cluster. Kubernetes leverages various networking solutions, such as overlay networks and software-defined networking (SDN) to establish node connectivity. Popular SDN solutions include Calico, Flannel, and Weave.
2. DNS Resolution:
Kubernetes provides a built-in DNS service that enables easy discovery of services within the cluster. Each service is assigned a DNS name, which can be resolved to its corresponding IP address. This allows applications to communicate with services using their DNS names, enhancing flexibility and decoupling.
3. Network Policies:
Network policies define rules that dictate how pods communicate with each other. Administrators can enforce fine-grained access control and secure application traffic using network policies. Policies can be based on various criteria, such as IP addresses, ports, and protocols.
GKE Network Policies
### Crafting Effective Network Policies
To create effective network policies, you must first grasp the structure and components that define them. Network policies in GKE are expressed in YAML format and consist of specifications that dictate how pods communicate with each other. This section will guide you through the essentials of crafting these policies, focusing on key elements such as pod selectors, ingress and egress rules, and the importance of defining explicit traffic paths.
### Implementing and Testing Your Policies
Once you have crafted your network policies, the next step is to implement and test them within your GKE environment. This section will provide a step-by-step guide on how to apply these policies and verify their effectiveness. We will cover common tools and commands used in testing, as well as strategies for troubleshooting and refining your policies to ensure they meet your desired outcomes.
### Best Practices for Network Policy Management
Managing network policies in a dynamic Kubernetes environment can be challenging. In this section, we’ll discuss best practices to streamline this process, including how to regularly audit and update your policies, integrate them with existing security frameworks, and utilize automation tools for enhanced management. Adopting these practices will help you maintain a secure and efficient network policy strategy in your GKE clusters.
Discussing Microservices
Distributed systems are more fine-grained now, with Kubernetes driving microservices. Microservices is a fast-moving topic involving the breaking down applications into many specific services. All services have their lifecycles, collaborating. Splitting the Monolith with microservices is not a new idea ( the term is ), but the emergence of new technologies has a profound effect.
The specific domains/containers require constant communication and access to each other’s services. Therefore, a strategy needs to be maintained to manage container interaction. For example, how do we scale containers? What’s the process for container failure? How do we react to container resource limits?
Although Docker does help with container management, Kubernetes orchestration works on a different scale and looks at the entire application stack, allowing management at a service/application level.
We need a management and orchestration system to utilize containers’ and microservices’ portability fully. Containers can’t just be thrown into a sea of computing and expect to tie themselves together and work efficiently.
A management tool is required to govern and manage the life of containers, where they are placed, and to whom they can talk. Containers have a complicated existence, and many pieces are used to patch up their communication flow and management. We have updates, high availability, service discovery, patching, security, and networking.
The most important aspect about Kubernetes or any content management system is that they are not concerned with individual container placement. Instead, the focus is on workload placement. Users enter high-level requirements, and the scheduler does the rest—where, when, and how many?
Kubernetes networking 101 and network proximity.
Looking at workloads to analyze placement optimizes application deployment. For example, some processes that are part of the same service will benefit from network proximity. Front-end tiers sending large chunks of data to a backend database tier should be close to each other, not trombone across the network Kubernetes host for processing.
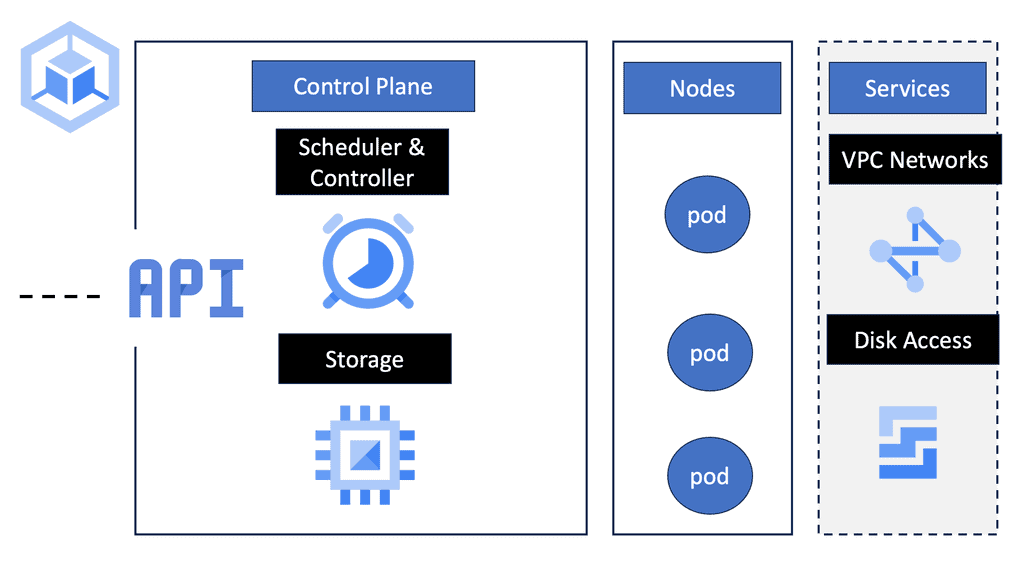
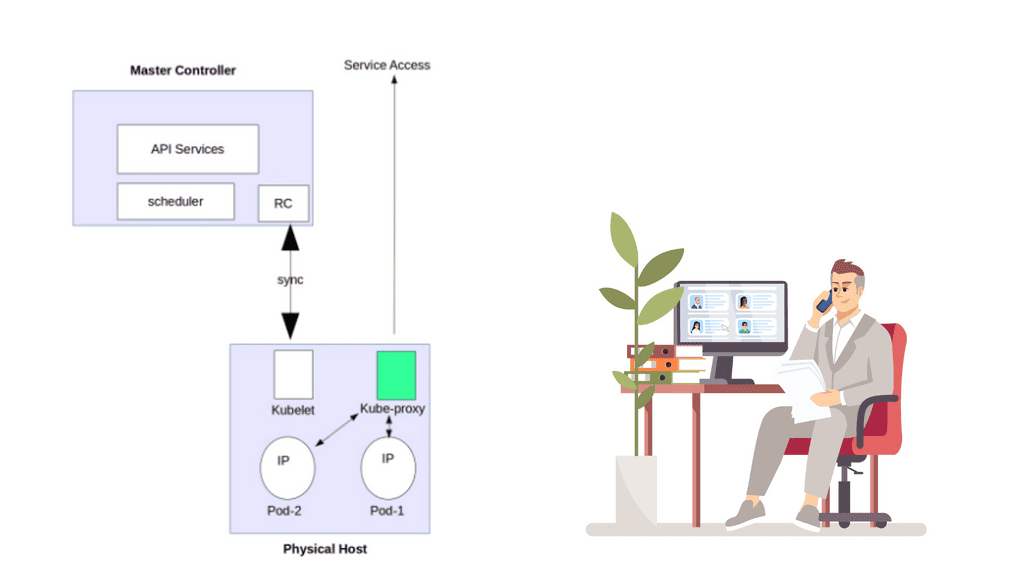
Likewise, when common data needs to be accessed and processed, it makes sense to put containers “close” to each other in a cluster. The following diagram displays the core Kubernetes architecture.
Kubernetes Networking 101: The Constructs
Kubernetes builds the application stack using four primary constructs: Pods, Services, Labels, and Replication Controllers. All constructs are configured and combined, creating a complete application stack with all management components—pods group similar containers on the same hosts.
Labels tag objects; replication controllers manage the desired state at a POD level, not container level, and services enable Pod-to-Pod communication. These constructs allow the management of your entire application lifecycle instead of individual application components. The construct definition is done through configuration files in YAML or JSON format.
The Kubernetes Pod
Pods are the smallest scheduling unit in Kubernetes and hold a set of closely related containers, all sharing fate and resources. Containers in a Pod share the same Kubernetes network namespace and must be installed on the same host. The main idea of keeping similar or related containers together is that processing is performed locally and does not incur any latency traversing from one physical host to another. As a result, local processing is always faster than remote processing.
Pods essentially hold containers with related pieces of the application stack. The critical point is that they are ephemeral and follow a specific lifecycle. They should come and go without service interruption as any service-destined traffic directed should be towards the “service” endpoint IP address, not the Pod IP address.
Even Though Pods have a pod-wide-IP address, service reachability is carried out with service endpoints. Services are not as temporary ( although they can be deleted ) and don’t go away as much as Pods. They act as the front-end VIP to back-end Pods ( more on later ). This type of architecture hammers home the level of abstraction Kubernetes seeks.
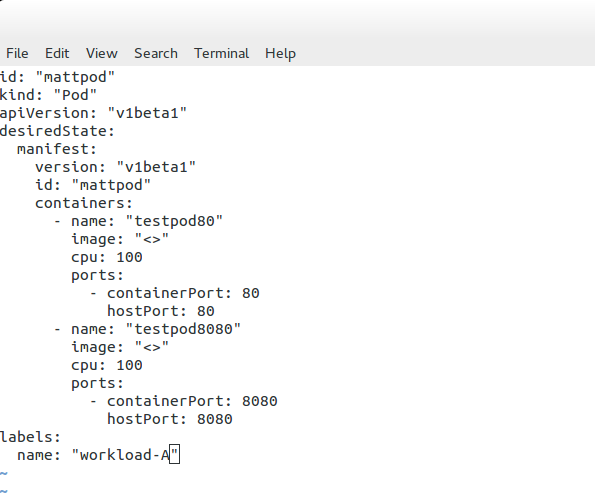
Pod definition file
The following example displays a Pod definition file. We have basic configuration parameters, such as the Pod’s name and ID. Also, notice that the object type is set to “Pod.” This will be set according to the object we are defining. Later we will see this set as “service” for determining a service endpoint.
In this example, we define two containers – “testpod80” and “testpod8080”. We also have the option to specify the container image and Label. As Kubernetes assigns the same IP to the Pod where both containers live, we should be able to browse to the same IP but different port numbers, 80 or 8080. Traffic gets redirected to the respective container.
Kubernetes labels
Containers within a Pod share their network namespaces. All containers within can reach each other’s ports on localhost. This reduces the isolation between containers, but any more isolation would go against why we have Pods in the first place. They are meant to group “similar” containers sharing the same resource volumes, RAM, and CPU. For Pod segmentation, we have labels – a Kubernetes tagging system.
Labels offer another level of abstraction by tagging items as a group. They are essentially key-value pairs categorizing constructs. When we create Kubernetes constructs, we can set a label, which acts as a tag for that construct.
This means you can access a group of objects by specifying the label assigned to those objects. For example, labels distinguish containers as part of a web or database tier. The “selector” field tells Kubernetes which labels to use in finding Pods to forward traffic to.
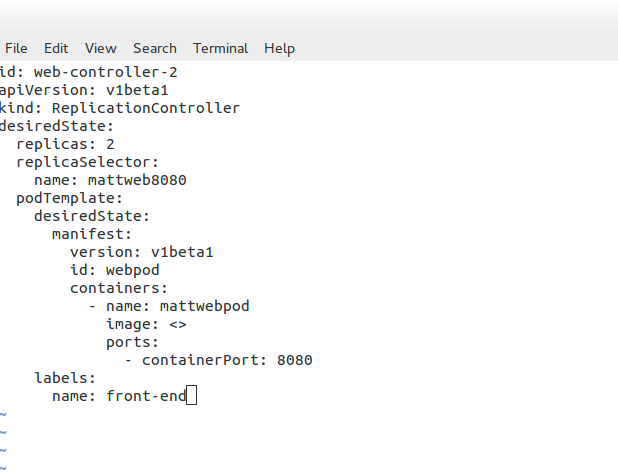
The replication controller ( RC ) manages the lifecycle and state of Pods. It ensures the desired state always matches the actual state. When you create an RC, you define how many copies ( aka replicas) of the Pod you want in the cluster.
The RC maintains that the correct numbers are running by creating or removing Pods at any time. Kubernetes doesn’t care about the number of containers running in a Pod; its only concern is the number of Pods. Therefore, it works at a Pod level.
The following is an example of an RC service definition file. Here, you can see that the desired state of replicas is “2.” A replica of 2 means that the number of pods each controller should maintain is 2. Changing the number up or down will either increase or decrease the number of Pods the replication controller manages.
For example, if the RC notices too many, it will stop some from returning the replication controller to the desired state. The RC keeps track of the desired state and returns it to the state specified in the service definition file. We may also assign a label for grouping replication controllers.
Kubernetes Services
Service endpoints enable the abstraction of services and the ability to scale horizontally. Essentially, they are abstractions defining a logical set of Pods. Services represent groups of Pods acting as one, allowing Pods to access services in other Pods without directing service-destined traffic to the Pod IP. Remember, Pods are short-lived!
The service endpoint’s IP address is from the “Portal Net” range defined on the API service. The address is local to the host, so ensure it doesn’t clash with the docker0 bridge IP address.
Pods are targeted by accessing a service that represents a group of Pods. A service can be viewed with a similar analogy to a load balancer, sitting in front of Pods accepting front-end service-destined traffic. Services act as the main hooking point for service / Pod interactions. They offer high-level abstraction to Pods and the containers within.
All traffic gets redirected to the service IP endpoint, which redirects it to the correct backend. Traffic hits the service IP address ( Portal Net ), and a Netfilter IPtable rules forward to a local host high port number.
The proxy service creates a high port number, which forms the basis for load balancing. The load balancing object then listens to that port. The Kub proxy acts as a full proxy, maintaining two different TCP connections.
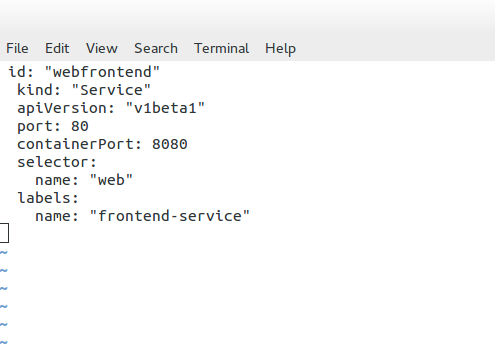
One separates the connection from the container to the proxy and another from the proxy to the load-balanced destination. The following is an example of a service definition file. The service listens on port 80 and sends traffic to the backend container port on 8080. Notice how the object kind is set to “service” and not “Pods” like in the previous definition file.
Kubernetes Networking 101 Model
The Kubernetes networking model details that each Pod should have a routable IP address. This makes communication between Pods easier by not requiring any NAT or port mappings we had with earlier versions of Docker networking.
With Kubernetes, for example, we can have a web server and database server placed in the same Pod and use the local interface for cross-communication. Furthermore, there is no additional translation, so performance is better than that of a NAT approach.
Kubernetes network proxy
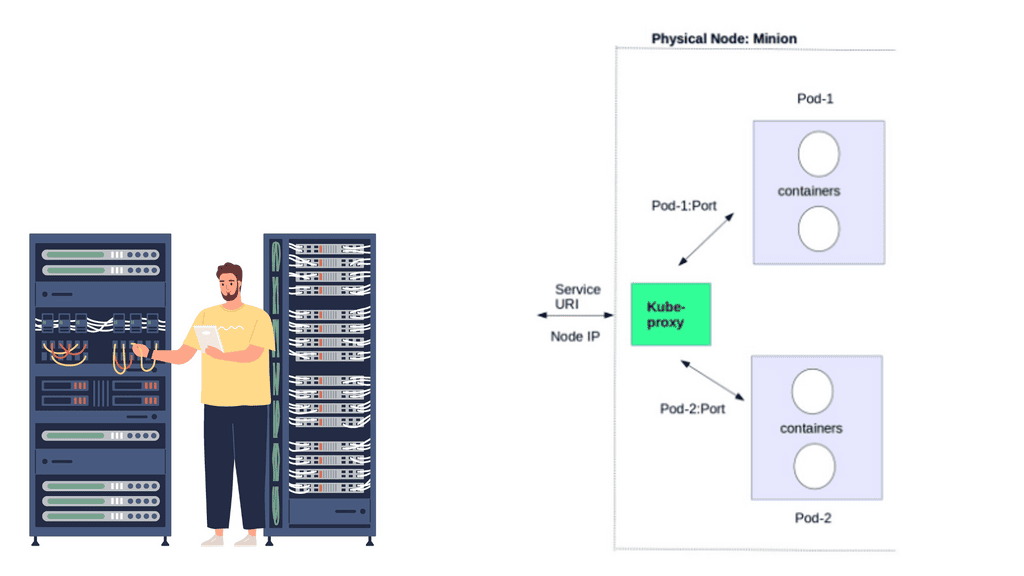
Kubernetes fulfills service -> Pods integration by enabling a network proxy called the Kube-proxy on every node in a cluster. The network proxy is always there, even if Pods are not running. Its main task is to route traffic to the correct Pod and can do TCP, UDP stream forwarding, or round-robin TCP, UDP forwarding.
The Kube proxy captures service-destination traffic and proxies requests from the service endpoint back to the application’s Pod. The traffic is forwarded to the Pods on the target port defined in the definition file, a random port assigned during service creation.
To make all this work, Kubernetes uses IPtables and Virtual IP addresses.
For example, when using Kubernetes alongside OpenContrail, the Kube-proxy is disabled on all hosts, and the OpenContrail router module implements connectivity via overlays ( MPLS over UDP encapsulation ). Another vendor on the forefront is Midokura, the co-founder behind OpenStack Project Kuryr. This project aims to bring any SDN plugin (MidoNet, Dragon flow, OVS, etc.) to Containers—more on these another time.
Kubernetes Pod-IP approach
The Pods IP address is reachable by all other Pods and hosts in the Kubernetes cluster. The address is not usually routable outside of the cluster. This should not be too much of a concern as most traffic stays within application tiers inside the cluster. Mapping external load-balancers achieves any inbound external trafficto services in the cluster.
The Pod-IP approach assumes that all Pods can reach each other without creating specific links. They can access each other by IP rather than through a port mapping on the physical host. Port mappings hide the original address by performing a masquerade – Source NAT.
Like your home residential router hides local PC and laptop IP addresses from the public Internet, cross-node communication is much simpler, as every Pod has an IP address. There isn’t any port mapping or NAT like there is with default docker networking. If the Kube proxy receives traffic for a Pod, not on its host, it simply forwards the traffic to the correct pod IP for that service.
The IP per POD offers a simplified approach to K8 networking. A unique IP per host would potentially need port mappings on the host IP as the number of containers increases. Managing port assignment would become an operational and management burden, similar to earlier versions of Docker. Conversely, a unique IP per container would surely hit scalability limits.
Kubernetes PAUSE container
Kubernetes has what’s known as a PAUSE container, also referred to as a Pod infrastructure container. It handles the networking by holding the networking namespace and IP address for the containers on that Pod. Some refer to the PAUSE container as an implementation detail you can safely ignore.
Each container uses a Pod’s “mapped container” mode to connect to the pause container. The mapped container mode is implemented with a source and target container grouping. The source container is the user-created container, and the target container is the infrastructure pause container.
Destination Pod IP traffic first lands on the pause container and gets translated to the backend containers. The pause container and the user-built containers all share the same network stack. Remember we created a service destination file with two containers – port 80 and port 8080? It is the pause container that listens on these port numbers.
In summary, the Kubernetes model introduces three methods of communication.
a) Pod-to-Pod communication directly by IP address. Kubernetes has a Pod-IP-wide metric simplifying communication.
b) Pod-to-Service Communication – Clients’ traffic is directed to the virtual service IP, which is then intercepted by the kub-proxy process ( running on all hosts) and directed to the correct Pod.
c) External-to-Internal Communication—External access is captured by an external load balancer that targets nodes in a cluster. The Kub proxy determines the correct Pod to send traffic to—more in a separate post.
Docker & Kubernetes networking comparison
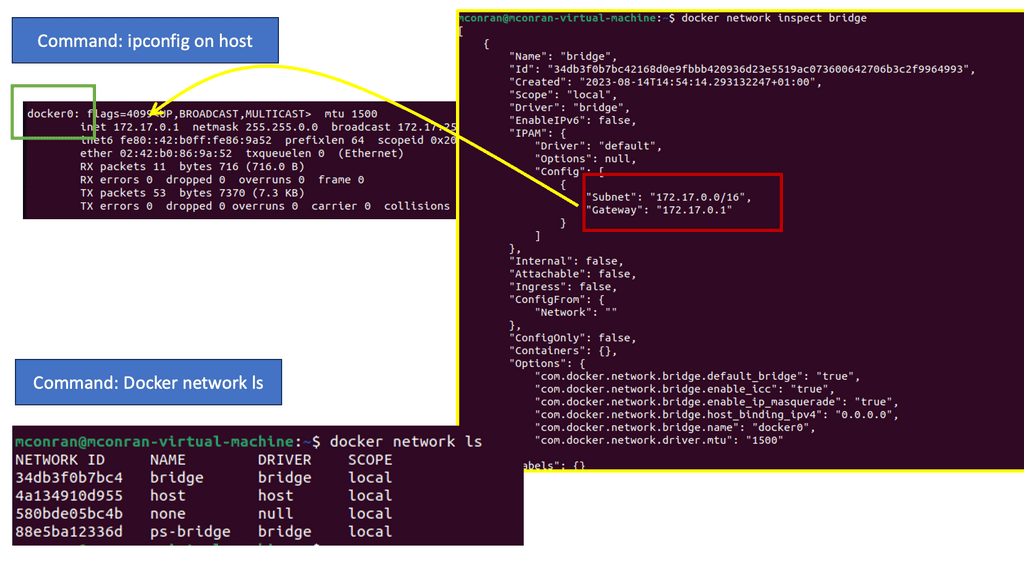
Docker uses host-private networking. The Docker engine creates a default bridge, and every container gets a virtual ethernet to that bridge. The veth acts like a pipe – one end is mapped to the docker0 bridge namespace and the other to the container’s Linux namespace. This provides connectivity between containers on the same Docker bridge.
All containers are assigned an address from the 172.17.42.0 range and 172.17.42.1 to the default bridge acting as the container gateway. Any off-host traffic requires port mappings and NAT for communication. Therefore, the container’s IP address is hidden, and the network would see the container traffic coming from the docker nodes’ physical IP address.
The effect is that containers can only talk to each other by IP address on the same virtual bridge. Any off-host container communication requires messy port allocations. Recently, there have been enhancements to docker networking and multi-host native connectivity without translations. Although there are enhancements to the Docker network, the NAT / Port mapping design is not a clean solution.
Diagram: Docker Default networking
The K8 model offers a different approach, and the docker0 bridge gets a routable IP address. Any outside host can access that Pod by IP address rather than through a port mapping on the physical host. Kubernetes has no NAT for container-to-container or container-to-node traffic.
Understanding Kubernetes networking is crucial for building scalable and resilient applications within a containerized environment. By leveraging its flexible architecture and components like Pods, Services, and Ingress, developers can enable seamless container communication and ensure efficient network management.
Moreover, comprehending network concepts like cluster networking, DNS resolution, and network policies empowers administrators to establish robust and secure communication channels within the Kubernetes ecosystem. Embracing Kubernetes networking capabilities unlocks the full potential of this powerful container orchestration platform.
Closing Points on Kubernetes Networking 101
At the heart of Kubernetes networking lies a flat network structure. This unique model ensures that every pod, a basic Kubernetes unit, can communicate with any other pod without NAT (Network Address Translation). This design principle simplifies communication processes, eliminating complex network configurations. However, achieving this simplicity requires comprehending core concepts such as Network Policies, Services, and Ingress, which facilitate and control internal and external traffic.
Services in Kubernetes act as an abstraction layer over a set of pods, providing a stable endpoint for client communication. As pods can dynamically scale or change due to Kubernetes’ orchestration, services ensure that there is a consistent way to access these pods. Services can be of different types, including ClusterIP, NodePort, and LoadBalancer, each serving unique roles and use cases. Understanding how to configure and utilize these services effectively is key to maintaining robust and scalable applications.
Network Policies in Kubernetes provide a mechanism to control the traffic flow to and from pods. They allow you to define rules that specify which connections are allowed or denied, enhancing the security of your applications. By leveraging Network Policies, you can enforce stringent security measures, ensuring that only authorized traffic can interact with your application components. This section will delve into creating and applying Network Policies to safeguard your Kubernetes environment.
Ingress in Kubernetes serves as an entry point for external traffic into the cluster, providing HTTP and HTTPS routing to services within the cluster. It offers functionalities such as load balancing, SSL termination, and name-based virtual hosting. Properly configuring Ingress resources is essential for directing external traffic efficiently and securely to your services. This section will guide you through setting up and managing Ingress controllers and resources to optimize your application’s accessibility and performance.
Widget 3 · Apply
Kubernetes Network Policy Challenge
Purpose: apply the networking model to a real access-control
decision. Decide which application flows should be allowed and which should
be blocked. Your goal is to permit the required application path while
preventing unnecessary lateral access.
Scenario · Three-Tier Application
A Kubernetes application contains a frontend,
API and database. The frontend needs
the API. The API needs PostgreSQL on TCP 5432.
The frontend should not connect directly to the database.
Choose the correct NetworkPolicy outcome for each flow.
Traffic Decisions
🖥️
Frontend
app=frontend
TCP 443
⚙️
API
app=api
Frontend → API
🖥️
Frontend
app=frontend
TCP 5432
🗄️
Database
app=db
Frontend → DB
⚙️
API
app=api
TCP 5432
🗄️
Database
app=db
API → DB
🌐
External
outside cluster
TCP 5432
🗄️
Database
app=db
External → DB
Policy thinking:
NetworkPolicy is based on selectors, directions and ports rather
than simply naming individual Pod IP addresses. In this challenge,
think in terms of application identity and required communication.
Policy Model
Frontend → API Application dependency
API → DB : 5432 Required database access
Frontend → DB Unnecessary lateral path
External → DB Direct database exposure
Challenge Score
Correct decisions
— / 4
Result
Ready
Key Lesson
Good network policy design starts with the application's required
communication paths. Allow what the workload needs and avoid
exposing unrelated services.
Container-based virtualization, or containerization, is a popular technology revolutionizing how we deploy and manage applications. In this blog post, we will explore what container-based virtualization is, why it is gaining traction, and how it differs from traditional virtualization techniques.
Container-based virtualization is a lightweight alternative to traditional methods such as hypervisor-based virtualization. Unlike virtual machines (VMs), which require a separate operating system (OS) instance for each application, containers share the host OS. This means containers can be more efficient regarding resource utilization and faster to start and stop.
Container-based virtualization, also known as operating system-level virtualization, is a lightweight virtualization method that allows multiple isolated user-space instances, known as containers, to run on a single host operating system. Unlike traditional virtualization techniques, which rely on hypervisors and full-fledged guest operating systems, containerization leverages the host operating system's kernel to provide resource isolation and process separation. This streamlined approach eliminates the need for redundant operating system installations, resulting in improved performance and efficiency.
Enhanced Portability: Containers encapsulate all the dependencies required to run an application, making them highly portable across different environments. Developers can package their applications with all the necessary libraries, frameworks, and configurations, ensuring consistent behavior regardless of the underlying infrastructure.
Scalability and Resource Efficiency: Containers enable efficient resource utilization by sharing the host's operating system and kernel. With their lightweight nature, containers can be rapidly provisioned, scaled up or down, and migrated across hosts, ensuring optimal resource allocation and responsiveness.
Isolation and Security: Containers provide isolation at the process level, ensuring that each application runs in its own isolated environment. This isolation prevents interference and minimizes security risks, making container-based virtualization an attractive choice for multi-tenant environments and cloud-native applications.
Container-based virtualization has gained significant traction across various industries and use cases. Some notable examples include:
Microservices Architecture: Containerization seamlessly aligns with the principles of microservices, allowing applications to be broken down into smaller, independent services. Each microservice can be encapsulated within its own container, enabling rapid development, deployment, and scaling.
DevOps and Continuous Integration/Continuous Deployment (CI/CD): Containers play a crucial role in modern DevOps practices, streamlining the software development lifecycle. With container-based virtualization, developers can easily package, test, and deploy applications across different environments, ensuring consistency and reducing deployment complexities.
Hybrid and Multi-Cloud Environments: Containers facilitate hybrid and multi-cloud strategies by abstracting away the underlying infrastructure dependencies. Applications can be packaged as containers and seamlessly deployed across different cloud providers or on-premises environments, enabling flexibility and avoiding vendor lock-in.
Container Virtualization Lab
Containers vs VMs: What Actually Changes?
Experiment with the virtualization boundary. See how workload density,
isolation and resource overhead change when the same application set is
deployed as containers or virtual machines.
4
Medium
Virtualization BoundaryReady
Physical / Cloud Host
Hypervisor layer
Shared host operating-system kernel
Workloads4
Resource OverheadLow
IsolationProcess
DensityHigh
[ready] Architecture waiting for evaluation.
Engineering Insight
Containers generally reduce per-workload overhead by sharing the host
kernel, while VMs provide a stronger virtualization boundary by
virtualizing complete guest operating systems.
Conceptual simulation for learning. Real isolation, performance and
security depend on the runtime, kernel configuration, hardware,
workload and deployment architecture.
Highlights: Container Based Virtualization
What is Container-Based Virtualization?
Container-based virtualization, also known as operating-system-level virtualization, is a lightweight approach to virtualization that allows multiple isolated containers to run on a single host operating system. Unlike traditional virtualization techniques, containerization does not require a full-fledged operating system for each container, resulting in enhanced efficiency and performance.
Unlike traditional hypervisor-based virtualization, which relies on full-fledged virtual machines, containerization offers a more lightweight and efficient approach. Containers share the host OS kernel, resulting in faster startup times, reduced resource overhead, and improved overall performance.
Benefits:
Increased Resource Utilization: By sharing the host operating system, containers can efficiently use system resources, leading to higher resource utilization and cost savings.
Rapid Deployment and Scalability: Containers offer fast deployment and scaling capabilities, enabling developers to quickly build, deploy, and scale applications in seconds. This agility is crucial in today’s fast-paced development environments.
Isolation and Security: Containers provide a high level of isolation between applications, ensuring that one container’s activities do not affect others. This isolation enhances security and minimizes the risk of system failures.
Use Cases:
Microservices Architecture: Containerization plays a vital role in microservices architecture. Developers can independently develop, test, and deploy services by encapsulating each microservice within its container, increasing flexibility and scalability.
Cloud Computing: Container-based virtualization is widely used in cloud computing platforms. It allows users to deploy applications seamlessly across different cloud environments, making migrating and managing workloads easier.
DevOps and Continuous Integration/Continuous Deployment (CI/CD): Containerization is a crucial enabler of DevOps practices. With container-based virtualization, developers can ensure consistency in development, testing, and production environments, enabling smoother CI/CD workflows.
**Container Management and Orchestration**
Managing containers at scale necessitates the use of orchestration tools, with Kubernetes being one of the most popular options. Kubernetes automates the deployment, scaling, and management of containerized applications, providing a robust framework for managing large clusters of containers. It handles tasks like load balancing, scaling applications up or down based on demand, and ensuring the desired state of the application is maintained, making it indispensable for organizations leveraging container-based virtualization.
**Security Considerations in Containerization**
While containers offer numerous advantages, they also introduce unique security challenges. The shared kernel architecture, while efficient, necessitates stringent security measures to prevent vulnerabilities. Ensuring that container images are secure, implementing robust access controls, and regularly updating and patching container environments are critical steps in safeguarding containerized applications. Tools and best practices specifically designed for container security are vital components of a comprehensive security strategy.
Container Networking
Docker Networks
Container networking refers to the communication and connectivity between containers within a containerized environment. It allows containers to interact with each other and external networks and services. Isolating network resources for each container enables secure and efficient data exchange.
In this section, we will explore some essential concepts in container networking:
1. Network Namespaces: Container runtimes use network namespaces to create isolated container network environments. Each container has its network namespace, providing separation and isolation.
2. Bridge Networks: Bridge networks serve as a virtual bridge connecting containers within the same host. They enable container communication by assigning unique IP addresses and facilitating network traffic routing.
3. Overlay Networks: Overlay networks connect containers across multiple hosts or nodes in a cluster. They provide a seamless communication layer, allowing containers to communicate as if they were on the same network.
Docker Default Networking
Docker default networking is an essential feature that enables containerized applications to communicate with each other and the outside world. By default, Docker provides three types of networks: bridge, host, and none. These networks serve different purposes and have distinct characteristics.
– The bridge network is Docker’s default networking mode. It creates a virtual network interface on the host machine, allowing containers to communicate with each other through this bridge. By default, containers connected to the bridge network can reach each other using their IP addresses.
– The host network mode allows containers to bypass the isolation provided by Docker networking and use the host machine’s network directly. When a container uses the host network, it shares the same network namespace as the host, resulting in improved network performance but sacrificing the container’s isolation.
– The non-network mode completely isolates the container from network access. Containers using this mode have no network interfaces and cannot communicate with the outside world or other containers. This mode is useful for scenarios where network access is not required.
Docker provides various options to customize default networking behavior. You can create custom bridge networks, define IP ranges, configure DNS resolution, and map container ports to host ports. Understanding these configuration options empowers you to design networking setups that align with your application requirements.
Application Landscape Changes
The application landscape has changed from a monolithic design to a design consisting of microservices. Today, applications are constantly developed. Patches usually patch only certain parts of the application, and the entire application is built from loosely coupled components instead of existing tightly coupled ones. The entire application stack is broken into components and spread over multiple servers and locations, all requiring cross-communication. For example, users connect to a presentation layer, the presentation layer then connects to some shopping cart, and the shopping cart connects to a catalog library.
These components are potentially stored on different servers, maybe different data centers. The application is built from several small parts, known as microservices. Each component or microservice can now be put into a lightweight container—a scaled-down VM. VMware and KVM are virtualization systems that allow you to run Linux kernels and operating systems on top of a virtualized layer, commonly known as a hypervisor. Because each VM is based on its operating system kernel in its memory space, this approach provides extreme isolation between workloads.
Containers differ fundamentally from shared kernel systems since they implement isolation between workloads entirely within the kernel. This is called operating system virtualization.
A major advantage of containers is resource efficiency since each isolated workload does not require a whole operating system instance. Sharing a kernel reduces the amount of indirection between isolated tasks and their real hardware. The kernel only manages a container when a process is running inside a container. Unlike a virtual machine, an actual machine has no second layer. The process would have to bounce into and out of privileged mode twice when calling the hardware or hypervisor in a VM, significantly slowing down many operations.
Traditional Deployment Models
So, how do containers facilitate virtualization? Traditional application deployment was based on a single-server approach. As a result, one application was installed per physical server, wasting server resources, and components such as RAM and CPU were never fully utilized. There was also considerable vendor lock-in, making moving applications from one hardware vendor to another hard.
Then, the world of hypervisor-based virtualization was introduced, and the concept of a virtual machine (VM) was born. Soon after, we had container-based applications. Container-based virtualization introduced container networking, and new principles arose for security around containers, specifically, Docker container security.
Introducing hypervisors
We still deployed physical servers but introduced hypervisors on the physical host, enabling the installation of multiple VMs on a single server. Each VM is isolated from its operating system. Hypervisor-based virtualization introduced better resource pooling as one physical server could now be divided into multiple VMs, each hosting a different application type. This was years better than single-server deployments and opened the doors to open networking.
The VM deployment approach increased agility and scalability, as applications within a VM are scaled by simply spinning up more VMs on any physical host. While hypervisor-based virtualization was a step in the right direction, a guest operating system for each application is pretty intensive. Each VM requires RAM, CPU, storage, and an entire guest OS, all-consuming resources.
Introducing Virtualization
Another advantage of virtualization is the ability to isolate applications or services. Each virtual machine operates independently, with its resources and configurations. This enhances security and stability, as issues in one virtual machine do not affect others. It also allows for easy testing and development, as virtual machines can be quickly created and discarded.
Virtualization also offers improved disaster recovery and business continuity. By encapsulating the entire virtual machine, including its operating system, applications, and data, into a single file, organizations can quickly back up, replicate, and restore virtual machines. This ensures that critical systems and data are protected and can rapidly recover during a failure or disaster.
Furthermore, virtualization enables workload balancing and dynamic resource allocation. Virtual machines can be dynamically migrated between physical servers to optimize resource utilization and performance. This allows for better utilization of computing resources and the ability to respond to changing workload demands.
Container Orchestration
**What is Google Kubernetes Engine?**
Google Kubernetes Engine is a managed environment for deploying, managing, and scaling containerized applications using Google infrastructure. GKE is built on Kubernetes, an open-source container orchestration system that automates the deployment, scaling, and management of containerized applications. With GKE, developers can focus on building applications without worrying about the complexities of managing the underlying infrastructure.
**The Benefits of Container-Based Virtualization**
Container-based virtualization is a game-changer in the world of cloud computing. Unlike traditional virtual machines, containers are lightweight and share the host system’s kernel, leading to faster start-up times and reduced overhead. GKE leverages this technology to offer seamless scaling and efficient resource utilization. This means businesses can run more applications on fewer resources, reducing costs and improving performance.
**GKE Features: What Sets It Apart?**
One of GKE’s standout features is its ability to auto-scale, which ensures that applications can handle varying loads by automatically adjusting the number of running instances. Additionally, GKE provides robust security features, including vulnerability scanning and automated updates, safeguarding your applications from potential threats. The integration with other Google Cloud services also enhances its functionality, offering a comprehensive suite of tools for developers.
**Getting Started with GKE**
For businesses looking to harness the potential of Google Kubernetes Engine, getting started is straightforward. Google Cloud provides extensive documentation and tutorials, making it easy for developers to deploy their first applications. With its intuitive user interface and powerful command-line tools, GKE simplifies the process of managing containerized applications, even for those new to Kubernetes.
Understanding Docker Swarm
Docker Swarm provides native clustering and orchestration capabilities for Docker. It allows you to create and manage a swarm of Docker nodes, forming a single virtual Docker host. By leveraging the power of swarm mode, you can seamlessly deploy and manage containers across a cluster of machines, enabling high availability, fault tolerance, and scalability.
One of Docker Swarm’s key features is its simplicity. With just a few commands, you can initialize a swarm, join nodes to the swarm, and deploy services across the cluster. Additionally, Swarm provides load balancing, automatic container placement, rolling updates, and service discovery, making it an ideal choice for managing and scaling containerized applications.
Scaling Services with Docker Swarm
To create a Docker Swarm, you need at least one manager node and one or more worker nodes. The manager node acts as the central control plane, handling service orchestration and managing the swarm’s state. On the other hand, Worker nodes execute the tasks assigned to them by the manager. Setting up a swarm allows you to distribute containers across the cluster, ensuring efficient resource utilization and fault tolerance.
One of Docker Swarm’s significant benefits is its ability to deploy and scale services effortlessly. With a simple command, you can create a service, specify the number of replicas, and let Swarm distribute the workload across the available nodes. Scaling a service is as simple as updating the desired number of replicas, and Swarm will automatically adjust the deployment accordingly, ensuring high availability and efficient resource allocation.
Docker Swarm is a native clustering and orchestration solution for Docker. It allows you to create and manage a swarm of Docker nodes, enabling the deployment and scaling of containers across multiple machines. With its simplicity and ease of use, Docker Swarm is an excellent choice for those looking to dive into container orchestration without a steep learning curve.
The Power of Kubernetes
Kubernetes, often called “K8s,” is an open-source container orchestration platform developed by Google. It provides a robust and scalable solution for managing containerized applications. With its advanced features, such as automatic scaling, load balancing, and self-healing capabilities, Kubernetes has gained widespread adoption in the industry.
Example Technology: Virtual Switching
Understanding Open vSwitch
Open vSwitch, called OVS, is an open-source virtual switch that efficiently creates and manages virtual networks. It operates at the data link layer of the networking stack, enabling seamless communication between virtual machines, containers, and physical network devices. With extensibility in mind, OVS offers a wide range of features contributing to its popularity and widespread adoption.
– Flexible Network Topologies: One of the standout features of Open vSwitch is its ability to support a variety of network topologies. Whether a simple flat network or a complex multi-tiered architecture, OVS provides the flexibility to design and deploy networks that suit specific requirements. This level of adaptability makes it a preferred choice for cloud service providers, data centers, and enterprises seeking dynamic network setups.
– Virtual Network Overlays: Open vSwitch enables virtual network overlays, allowing multiple virtual networks to coexist and operate independently on the same physical infrastructure. By leveraging technologies like VXLAN, GRE, and Geneve, OVS facilitates the creation of isolated network segments that are transparent to the underlying physical infrastructure. This capability simplifies network management and enhances scalability, making it an ideal solution for cloud environments.
– Flow-based Forwarding: Flow-based forwarding is a powerful mechanism provided by Open vSwitch. It allows for fine-grained control over network traffic by defining flows based on specific criteria such as source/destination IP addresses, ports, protocols, and more. This granular control enables efficient traffic steering, load balancing, and network monitoring, enhancing performance and security.
Controlling Security
Understanding SELinux
SELinux, which stands for Security-Enhanced Linux, is a security framework built into the Linux kernel. It provides a fine-grained access control mechanism beyond traditional discretionary access controls (DAC). SELinux implements mandatory access controls (MAC) based on the principle of least privilege. This means that processes and users are granted only the bare minimum permissions required to perform their tasks, reducing the potential attack surface.
Container-based virtualization has revolutionized the way applications are deployed and managed. However, it also introduces new security challenges. This is where SELinux shines. By enforcing strict access controls on container processes and limiting their capabilities, SELinux helps prevent unauthorized access and potential exploits. It adds an extra layer of protection to the container environment, making it more resilient against attacks.
Container Networking Lab
How Does the Network Change the Container Boundary?
Change the network model and traffic requirement to see how containers gain
connectivity, isolation and multi-host reachability. The simulation is
conceptual: real implementations depend on the runtime, CNI, host networking
and platform configuration.
Logical Network Path
Network Boundary
A
App ContainerNetwork namespace
⇄
Virtual NetworkBridge / veth path
B
Target ContainerApplication endpoint
Namespace IsolationMedium
Network ScopeSingle Host
Cross-HostNot Available
Port MappingNot Required
SegmentationShared Network
Connectivity ResultNot tested
Network Reachability0%
Isolation Strength0%
Network Event Console
[ready] Experiment waiting for configuration.
Engineering Insight
Choose a network model and traffic scope, then run the test.
Educational simulation only. Network behaviour varies by container runtime,
CNI/plugin, host configuration, routing, firewalling and orchestration platform.
Container Based Virtualization
The Traditional World
Before we address how containers facilitate virtualization, let’s address the basics. In the past, we could solely run one application per server. However, the open-systems world of Windows and Linux didn’t have the technologies to safely and securely run multiple applications on the same server.
So, whenever we needed a new application, we would buy a new server. We had the virtual machine (VM) to solve the waste of resources. With the VM, we had a technology that permitted us to safely and securely run applications on a single server. Unfortunately, the VM model also has additional challenges.
Migrating VMs
For example, VMs are slow to boot, and portability isn’t great — migrating and moving VM workloads between hypervisors and cloud platforms is more complicated than it needs to be. All of these factors drove the need for new container technology with container virtualization.
How do containers facilitate virtualization? We needed a lightweight tool without losing the scalability and agility benefits of the VM-based application approach. The lightweight tool is container-based virtualization, and Docker is at the forefront. The container offers a similar capability to object-oriented programming. It lets you build composable modular building blocks, making it easier to design distributed systems.
In the following example, we have one Docker host. We can list the available networks for these Docker hosts with the command docker network ls. These are not WAN or VPN networks; they are only Docker networks.
Docker networks are virtual networks that allow containers to communicate with each other and the outside world. They provide isolation, security, and flexibility to manage network traffic flow between containers. By default, when you create a new Docker container, it is connected to a default bridge network, which allows communication with other containers on the same host.
Notice the subnets assigned of 172.17.0.0/16. So, the default gateway ( exit point) is set to the docker0 bridge.
Diagram: Docker networking
Types of Docker Networks:
Docker offers various types of networks, each serving a specific purpose:
1. Bridge Network:
The bridge network is the default network that enables communication between containers on the same host. Containers connected to the bridge network can communicate using IP addresses or container names. It provides a simple way to connect containers without exposing them to the outside world.
2. Host Network:
In the host network mode, a container shares the network stack with the host, using its network interface directly. This mode provides maximum network performance as no network address translation (NAT) is involved. However, it also means the container is directly exposed to the host’s network, potentially introducing security risks.
3. Overlay Network:
The overlay network allows containers to communicate across multiple Docker hosts, even in different physical or virtual networks. It achieves this by encapsulating network packets and routing them to the appropriate destination. Overlay networks are essential for creating distributed and scalable applications.
4. Macvlan Network:
The Macvlan network mode allows containers to have MAC addresses and appear as separate devices. This mode is useful when assigning IP addresses to containers and making them accessible from the external network. It is commonly used when containers must be treated as physical devices.
5. None Network:
The non-network mode isolates a container from all networking. It effectively disables all networking capabilities and prevents the container from communicating with other containers or the outside world. This mode is typically used when networking is not required or desired.
Guide Container Networking
You can attach as many containers as you like to a bridge. They will be assigned IP addresses within the same subnet, meaning they can communicate by default. You can have a container with two Ethernet interfaces ( virtual interfaces ) connected to two different bridges on the same host and have connectivity to two networks simultaneously.
Also, remember that the scope is local when you are doing this, and even if the docker hosts are on the same underlying network but with different hosts, they won’t have IP reachability. In this case, you may need a VXLAN overlay network to connect containers on different docker hosts.
Diagram: Inspecting container networks
Container-based Virtualization
One critical benefit of container-based virtualization is its portability. Containers encapsulate the application and all its dependencies, allowing it to run consistently across different environments, from development to production. This portability eliminates the “it works on my machine” problem and makes it easier to maintain and scale applications.
Scalability
Another advantage of containerization is its scalability. Containers can be easily replicated and distributed across multiple hosts, making it straightforward to scale applications horizontally. Furthermore, container orchestration platforms, like Kubernetes, provide automated management and scaling of containers, simplifying the deployment and management of complex applications.
Security
Security is crucial to any virtualization technology, and container-based virtualization is no exception. Containers provide isolation between applications, preventing them from interfering with each other. However, it is essential to note that containers share the same kernel as the host OS, which means a compromised container can potentially impact other containers. Proper security measures, such as regular updates and vulnerability scanning, are essential to ensure the security of containerized applications.
Tooling
Container-based virtualization also offers various tools and platforms for application development and deployment. Docker, for example, is a popular containerization platform that provides a user-friendly interface for building, running, and managing containers. It simplifies container image creation and enables developers to package their applications and dependencies.
Understanding Kubernetes Networking Architecture
Kubernetes networking architecture comprises several crucial components that enable seamless communication between pods, services, and external resources. The fundamental building blocks of Kubernetes networking include pods, nodes, containers, and the Container Network Interface (CNI). r.
Network security is paramount to any Kubernetes deployment. Network policies provide a powerful tool to control ingress and egress traffic, enabling fine-grained access control between pods. Kubernetes has the concept of network policies and demonstrates how to define and enforce them to enhance the security posture of your Kubernetes cluster.
Applications of Container-Based Virtualization:
1. DevOps and Continuous Integration/Continuous Deployment (CI/CD): Containerization enables developers to package applications, libraries, and configurations into portable and reproducible containers. This simplifies the deployment process and ensures consistency across different environments, facilitating faster software delivery.
2. Microservices Architecture: Container-based virtualization aligns well with the microservices architectural pattern. Organizations can develop, deploy, and scale each service independently using containers by breaking down complex applications into more minor, loosely coupled services. This approach enhances modularity, scalability, and fault tolerance.
3. Hybrid Cloud and Multi-Cloud Environments: Containers provide a unified platform for deploying applications across hybrid and multi-cloud environments. With container orchestration tools, organizations can leverage the benefits of multiple cloud providers while ensuring consistent deployment and management practices.
How do containers facilitate virtualization?
Container-Based Applications
Now, we have complex distributed software stacks based on microservices. Its base consists of loosely coupled components that may change and software that runs on various hardware, including test machines, in-house clusters, cloud deployments, etc. The web front end may include the following:
Ruby + Rail.
API endpoints with Python 2.7.
Stack website with Nginx.
A variety of databases.
We have a very complex stack on top of various hardware devices. While the traditional monolithic application will likely remain for some time, containers still exhibit the use case to modernize the operational model for conventional stacks. Both monolithic and container-based applications can live together.
The application’s complexity, scalability, and agility requirements have led us to the market of container-based virtualization. Container-based virtualization uses the host’s kernel to run multiple guest instances. Now, we can run multiple guest instances (containers), and each container will have its root file system, process, and network stack.
Containers allow you to package an application with all its parts in an isolated environment. They are a complete abstraction and do not need to run dependencies on the hosts. Docker, a type of container (first based on Linux Containers but now powered by runC), separates the application from infrastructure using container technologies.
Similar to how VMs separate the operating system from bare metal, containers let you build a layer of isolation in software that reduces the burden of human communication and specific workflows. An excellent way to understand containers is to accept that they are not VMs—they are simple wrappers around a single Unix process. Containers contain everything they need to run (runtime, code, libraries, etc.).
Linux kernel namespaces
Isolation or variants of isolation have been around for a while. We have mount namespacing in 2.4 kernels and userspace namespacing in 3.8. These technologies allow the kernel to create partitions and isolate PIDs. Linux containers (Lxc) started in 2008, and Docker was introduced in Jan 2013, with a public release of 1.0 in 2014. We are now at version 1.9, which has some new networking enhancements.
Docker uses Linux kernel namespaces and control groups, providing an isolated workspace, which offers the starting grounds for the Docker security options. Namespaces offer an isolated workspace that we call a container. They help us fool the container.
We have PID for process isolation, MOUNT for storage isolation, and NET for network-level isolation. The Linux network subsystem has the correct information for additional Linux network information.
Container-based application: Container operations
Containers use schedulers. A scheduler starts containers on the correct host and then connects them. It also needs to manage container failover and handle container scalability when there is too much data to process for a single instance. Popular container schedulers include Docker Swarm, Apache Mesos, and Google Kubernetes.
The correct host is selected depending on the type of scheduler used. For example, Docker Swarm will have three strategies: spread, binpack, and random. Spread means node selection is based on the fewest containers, disregarding their states. Binpack selection is based on hosts with minimum resources, i.e., the most packed. Finally, random strategy selections are chosen randomly.
Containers are quick to start.
How do containers facilitate virtualization? First, they are quick. Starting a container is much faster than starting a VM—lightweight containers can be started in as little as 300ms. Initial tests on Docker revealed that a newly created container from an existing image takes up only 12 kilobytes of disk space.
A VM could take up thousands of megabytes. The container is lightweight, as its references point to a layered filesystem image. Container deployment is also swift and network-efficient.
Fewer data needs to travel across the network and storage fabrics. Elastic applications that have frequent state changes can be built more efficiently. Both Docker and Linux containers fundamentally change application consumption.
As a side note, not all workloads are suitable for containers, and heavy loads like databases are put into VMs to support multi-cloud environments.
Docker networking
Docker networking is an essential aspect of containerization that allows containers to communicate with each other and external networks. In this document, we will explore the different networking options available in Docker and how they can facilitate seamless communication between containers.
By default, Docker provides three networking options: bridge, host, and none. The bridge network is the default network created when Docker is installed. It allows containers to communicate with each other using IP addresses. Containers within the same bridge network can communicate with each other directly without the need for port mapping.
As the name suggests, the host network allows containers to share the network namespace with the host system. This means containers using the host network can directly access the host system’s interfaces. This option is helpful for scenarios where containers must bind to specific network interfaces on the host.
On the other hand, the non-network option completely isolates the container from the network. Containers using the none network cannot communicate with other containers or external networks. This option is useful when running a container in complete isolation.
Creating custom networks
In addition to these default networking options, Docker also provides the ability to create custom networks. Custom networks allow containers to communicate with each other, even if they are not in the same network namespace. Custom networks can be made using the `docker network create` command, specifying the desired driver (bridge, overlay, macvlan, etc.) and any additional options.
One of the main benefits of using custom networks is the ability to define network-level access control. Docker provides the ability to define network policies using network labels. These labels can control which containers can communicate with each other and which ports are accessible.
Closing Points on Docker networking
Networking is very different in Docker than what we are used to. Networks are domains that interconnect sets of containers. So, if you give access to a network, you can access all containers. However, you must specify rules and port mapping if you want external access to other networks or containers.
A driver backs every network, be it a bridge or overlay driver. These Docker-based drivers can be swapped out with any ecosystem driver. The team at Docker views them as pluggable batteries.
Docker utilizes the concept of scope—local (default) and Global. The local scope is a local network, and the global scope has visibility across the entire cluster. If your driver is a global scope driver, your network belongs to a global scope. A local scope driver corresponds to the local scope.
Containers and Microsegmentation
Microsegmentation is a security technique that divides a network into smaller, isolated segments, allowing organizations to create granular security policies. This approach provides enhanced control and visibility over network traffic, preventing lateral movement and limiting the impact of potential security breaches.
Microsegmentation offers organizations a proactive approach to network security, allowing them to create an environment more resilient to cyber threats. By implementing microsegmentation, organizations can enhance their security posture, minimize the risk of lateral movement, and protect their most critical assets. As the cyber threat landscape continues to evolve, microsegmentation is an effective strategy to safeguard network infrastructure in an increasingly interconnected world.
Docker and Micro-segmentation
Docker 0 is the default bridge. They have now extended into bundles of multiple networks, each with independent bridges. Different bridges cannot directly talk to each other. It is a private, isolated network offering micro-segmentation and multi-tenancy features.
The only way for them to communicate is via host namespace and port mapping, which is administratively controlled. Docker multi-host networking is a new feature in 1.9. A multi-host network comprises several docker hosts that form a cluster.
Several containers in each host form the cluster by pointing to the same KV (example -zookeeper) store. The KV store that you point to defines your cluster. Multi-host networking enables the creation of different topologies and lets the container belong to several networks. The KV store may also be another container, allowing you to stay in a 100% container world.
Final points on container-based virtualization
In recent years, container-based virtualization has become famous for deploying and managing applications. Unlike traditional virtualization, which relies on hypervisors to run multiple virtual machines on a single physical server, container-based virtualization leverages lightweight, isolated containers to run applications.
So, what exactly is container-based virtualization, and why is it gaining traction in the technology industry? In this blog post, we will explore the concept of container-based virtualization, its benefits, and how it differs from traditional virtualization.
Operating system-level virtualization
Container-based virtualization, also known as operating system-level virtualization, is a form of virtualization that allows multiple containers to run on a single operating system kernel. Each container is isolated from the others, ensuring that applications and their dependencies are encapsulated within their runtime environment. This isolation eliminates application conflicts and provides a consistent environment across deployment platforms.
Diagram: Docker default networking 101
Critical advantages of container virtualization
One critical advantage of container-based virtualization is its lightweight nature. Containers are designed to be portable and efficient, allowing for rapid application deployment and scaling. Unlike virtual machines, which require an entire operating system to run, containers share the host operating system kernel, reducing resource overhead and improving performance.
Another benefit of container-based virtualization is its ability to facilitate microservices architecture. By breaking down applications into more minor, independent services, containers enable developers to build and deploy applications more efficiently. Each microservice can be encapsulated within its container, making it easier to manage and update without impacting other application parts.
Greater flexibility and scalability
Moreover, container-based virtualization offers greater flexibility and scalability. Containers can be easily replicated and distributed across hosts, allowing for seamless horizontal scaling. This ability to scale quickly and efficiently makes container-based virtualization ideal for modern, dynamic environments where applications must adapt to changing demands.
Container virtualization is not a complete replacement.
It’s important to note that container-based virtualization is not a replacement for traditional virtualization. Instead, it complements it. While traditional virtualization is well-suited for running multiple operating systems on a single physical server, container-based virtualization is focused on maximizing resource utilization within a single operating system.
In conclusion, container-based virtualization has revolutionized application deployment and management. Its lightweight nature, isolation capabilities, and scalability make it a compelling choice for modern software development and deployment. As technology continues to evolve, container-based virtualization will likely play a significant role in shaping the future of application deployment.
Container-based virtualization has transformed how we develop, deploy, and manage applications. Its lightweight nature, scalability, portability, and isolation capabilities make it an attractive choice for modern software development. By adopting containerization, organizations can achieve greater efficiency, agility, and cost savings in their software development and deployment processes. As container technologies continue to evolve, we can expect even more exciting possibilities in virtualization.
Google Cloud Data Centers
### What is a Cloud Service Mesh?
A cloud service mesh is essentially a network of microservices that manage and optimize communication between application components. It operates behind the scenes, abstracting the complexity of inter-service communication from developers. With a service mesh, you get a unified way to secure, connect, and observe microservices without changing the application code.
### Key Benefits of Using a Cloud Service Mesh
#### Improved Observability
One of the standout features of a service mesh is enhanced observability. By providing detailed insights into traffic flows, latencies, error rates, and more, it allows developers to easily monitor and debug their applications. Tools like Prometheus and Grafana can integrate with service meshes to offer real-time metrics and visualizations.
#### Enhanced Security
Security in a microservices environment can be complex. A cloud service mesh simplifies this by providing built-in security features such as mutual TLS (mTLS) for encrypted service-to-service communication. This ensures that data remains secure and tamper-proof as it travels across the network.
#### Simplified Traffic Management
With a service mesh, traffic management becomes a breeze. Advanced routing capabilities allow for blue-green deployments, canary releases, and circuit breaking, making it easier to roll out new features and updates without downtime. This level of control ensures that applications remain resilient and performant.
### The Role of Container Networking
Container networking is a critical aspect of cloud-native architectures, and a service mesh enhances it significantly. By decoupling the networking logic from the application code, a service mesh provides a standardized way to manage communication between containers. This not only simplifies the development process but also ensures consistent network behavior across different environments.
### Popular Cloud Service Mesh Solutions
Several service mesh solutions have emerged as leaders in the industry. Notable mentions include:
– **Istio:** One of the most popular service meshes, Istio offers a robust set of features for traffic management, security, and observability.
– **Linkerd:** Known for its simplicity and performance, Linkerd focuses on providing essential service mesh capabilities with minimal overhead.
– **Consul Connect:** Developed by HashiCorp, Consul Connect integrates seamlessly with other HashiCorp tools, offering a comprehensive solution for service discovery and mesh networking.
Architecture Challenge
Choose the Right Isolation Model
A modern application does not always need every workload to use the same
isolation boundary. Read the requirements, choose an architecture, and
decide where containers, networking and stronger isolation should be used.
Scenario
Modern Three-Tier Application
A platform team is deploying a public web tier, an internal API and a
sensitive database. The platform needs rapid deployment and scaling,
private east-west communication and controlled exposure to the Internet.
✓
Fast deployment and scalingApplication components should remain lightweight and portable.
✓
Controlled Internet exposureOnly the public web tier should have an externally reachable path.
✓
Private east-west trafficAPI and database communication should stay on private application networks.
✓
Stronger isolation where justifiedSensitive workloads may require a stronger boundary than ordinary application containers.
Select an Architecture
Architecture Assessment0 / 4
Web
→
Controlled Ingress
→
Private API
→
Protected DB
Architecture Decision Console
[ready] Challenge loaded.
[info] Four architecture patterns available.
[hint] Look for the balance between agility, exposure and isolation.
Engineering Insight
The important design question is not simply “containers or VMs?”
It is which isolation boundary is appropriate for each workload and
how networking controls exposure between application tiers.
Educational architecture challenge. Real production decisions also depend
on threat model, runtime security, orchestration, compliance requirements,
performance, operational maturity and workload characteristics.
Shopping Basket
We use cookies on our website to give you the most relevant experience by remembering your preferences and repeat visits. By clicking “Accept”, you consent to the use of ALL the cookies.
This website uses cookies to improve your experience while you navigate through the website. Out of these, the cookies that are categorized as necessary are stored on your browser as they are essential for the working of basic functionalities of the website. We also use third-party cookies that help us analyze and understand how you use this website. These cookies will be stored in your browser only with your consent. You also have the option to opt-out of these cookies. But opting out of some of these cookies may affect your browsing experience.
Necessary cookies are absolutely essential for the website to function properly. This category only includes cookies that ensures basic functionalities and security features of the website. These cookies do not store any personal information.
Any cookies that may not be particularly necessary for the website to function and is used specifically to collect user personal data via analytics, ads, other embedded contents are termed as non-necessary cookies. It is mandatory to procure user consent prior to running these cookies on your website.