Understanding Observability
To comprehend the essence of observability, we must first grasp its fundamental components. Observability involves collecting, analyzing, and interpreting data from various sources within a system. This data provides insights into the system’s performance, health, and potential issues. By monitoring metrics, logs, traces, and other relevant data points, observability equips organizations with the ability to diagnose problems, optimize performance, and ensure reliability.
The benefits of observability extend far beyond the realm of technology. Organizations across industries are leveraging observability to enhance their operations and drive innovation. In software development, observability enables teams to identify and resolve bugs, bottlenecks, and vulnerabilities proactively.
Additionally, it facilitates efficient troubleshooting and aids in the optimization of critical systems. Moreover, observability is pivotal in enabling data-driven decision-making, empowering organizations to make informed choices based on real-time insights.
**Key Components of Observability: Logs, Metrics, and Traces**
To fully grasp observability, you must understand its key components:
1. **Logs**: Logs are records of events that occur within your system. They provide detailed information about what happened, where, and why. Effective log management allows you to search, filter, and analyze these events to detect anomalies and pinpoint issues.
2. **Metrics**: Metrics are numerical values that represent the performance and health of your system over time. They help you track resource utilization, response times, and other critical parameters. By visualizing these metrics, you can easily identify trends and potential bottlenecks.
3. **Traces**: Traces follow the path of requests as they flow through your system. They offer a high-level view of your application’s behavior, highlighting dependencies and latency issues. Tracing is invaluable for diagnosing complex problems in distributed systems.
A New Paradigm Shift
Your infrastructure is undergoing a paradigm shift to support the new variations. As systems become more distributed and complex, methods for building and operating them are evolving, making network visibility into your services and infrastructure more critical than ever. This leads you to adopt new practices, such as Starting Observability and implementing service level objectives (SLO).
Note: The Internal States
Observability aims to provide a level of introspection to understand the internal state of the systems and applications. That state can be achieved in various ways. The most common way to fully understand this state is with a combination of logs, metrics, and traces as debugging signals—all of these need to be viewed as one, not as a single entity.
You have probably encountered the difference between monitoring and Observability. But how many articles have you read that guide starting an observability project?
**Getting Started with Observability Tools**
With a basic understanding of observability, it’s time to explore the tools that can help you implement it. Several observability platforms cater to different needs, including:
– **Prometheus**: Known for its powerful time-series database and flexible querying language, Prometheus is ideal for collecting and analyzing metrics.
– **ELK Stack (Elasticsearch, Logstash, Kibana)**: This open-source stack excels at log management, providing robust search and visualization capabilities.
– **Jaeger**: Designed for distributed tracing, Jaeger helps you trace requests and identify performance bottlenecks in microservices environments.
Choosing the right tools depends on your specific requirements, but starting with these popular options can set you on the right path.
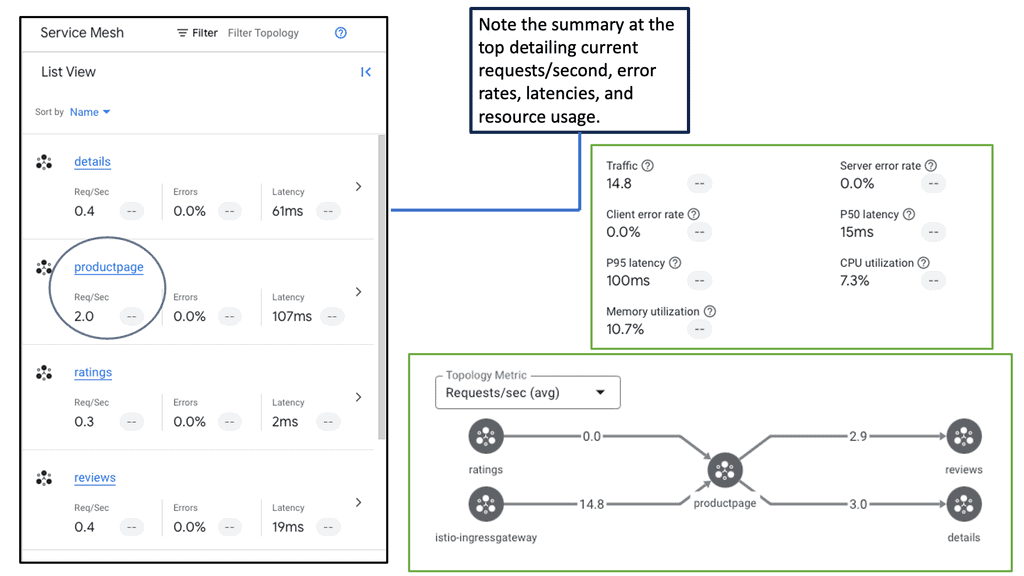
Observability & Service Mesh
**The Role of Service Mesh in Observability**
Service mesh has emerged as a powerful tool in enhancing observability within distributed systems. At its core, a service mesh is a dedicated infrastructure layer that controls service-to-service communication. By handling aspects like load balancing, authentication, and encryption, service meshes provide a centralized way to manage network traffic. More importantly, they offer detailed telemetry, which is essential for observability. With a service mesh, you can collect metrics, traces, and logs in a standardized manner, making it easier to monitor the health and performance of your services.
**Key Benefits of Using a Service Mesh**
One of the primary advantages of implementing a service mesh is the increased visibility it provides. By abstracting the complexities of network communication, a service mesh allows teams to focus on building and deploying applications without worrying about underlying connectivity issues. Additionally, service meshes facilitate better security practices through features like mutual TLS, enabling encryption and authentication between services. This not only boosts observability but also enhances the overall security posture of your applications.
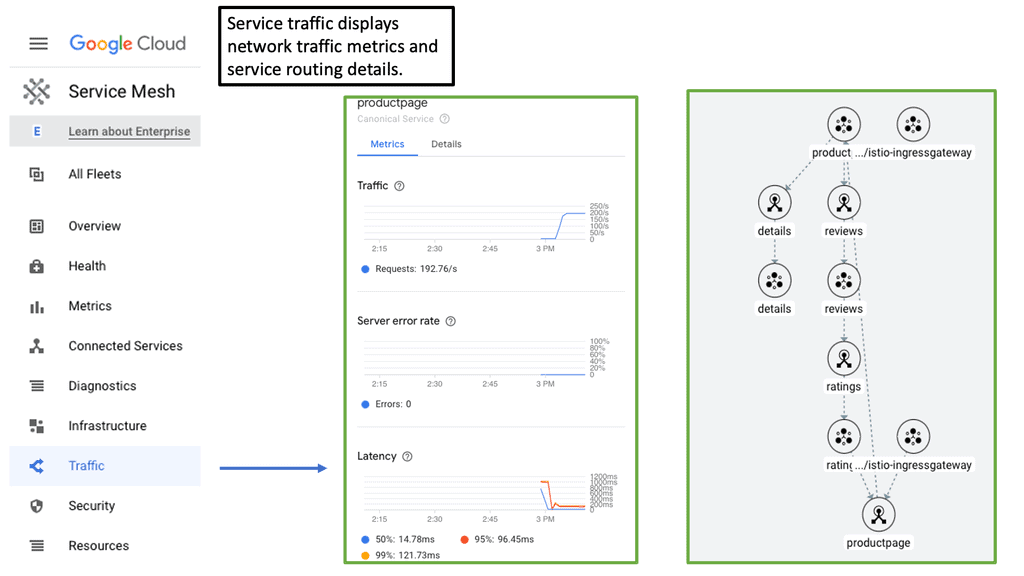
The Basics: How Cloud Service Mesh Works
At its core, a cloud service mesh is a dedicated infrastructure layer that handles service-to-service communication within a cloud environment. It provides a more secure, reliable, and observable way to manage these communications. Instead of embedding complex logic into each service to handle things like retries, timeouts, and security policies, a service mesh abstracts these concerns into a separate layer, often through sidecar proxies that accompany each service instance.
**Key Benefits: Why Adopt a Cloud Service Mesh?**
1. **Enhanced Security**: By centralizing security policies and automating mutual TLS (mTLS) for service-to-service encryption, a service mesh significantly reduces the risk of data breaches.
2. **Observability**: With built-in monitoring and tracing capabilities, a service mesh provides deep insights into the behavior and performance of services, making it easier to detect and resolve issues.
3. **Traffic Management**: Advanced traffic management features such as load balancing, fine-grained traffic routing, and fault injection help optimize the performance and reliability of services.
**Real-World Applications: Success Stories**
Many organizations have successfully implemented cloud service meshes to solve complex challenges. For instance, a large e-commerce platform might use a service mesh to manage its microservices architecture, ensuring that customer transactions are secure and resilient. Another example is a financial institution that leverages a service mesh to comply with stringent regulatory requirements by enforcing consistent security policies across all services.
**Choosing the Right Service Mesh: Key Considerations**
When selecting a cloud service mesh, it’s essential to consider factors such as compatibility with your existing infrastructure, ease of deployment, and community support. Popular options like Istio, Linkerd, and Consul each offer unique features and benefits. Evaluating these options based on your specific needs and constraints will help you make an informed decision.
Compute Engine Monitoring with Ops Agent
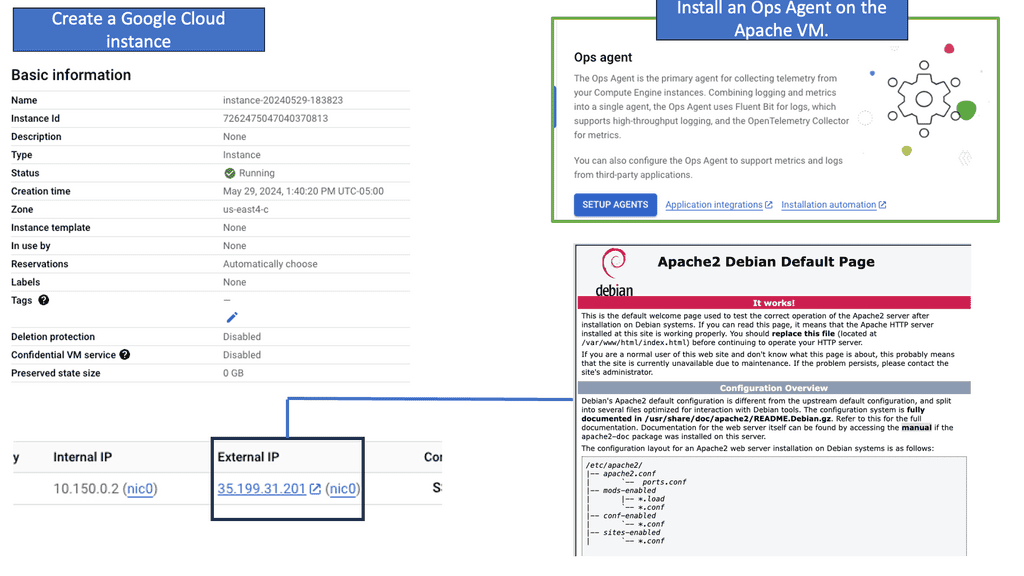
Understanding Ops Agent
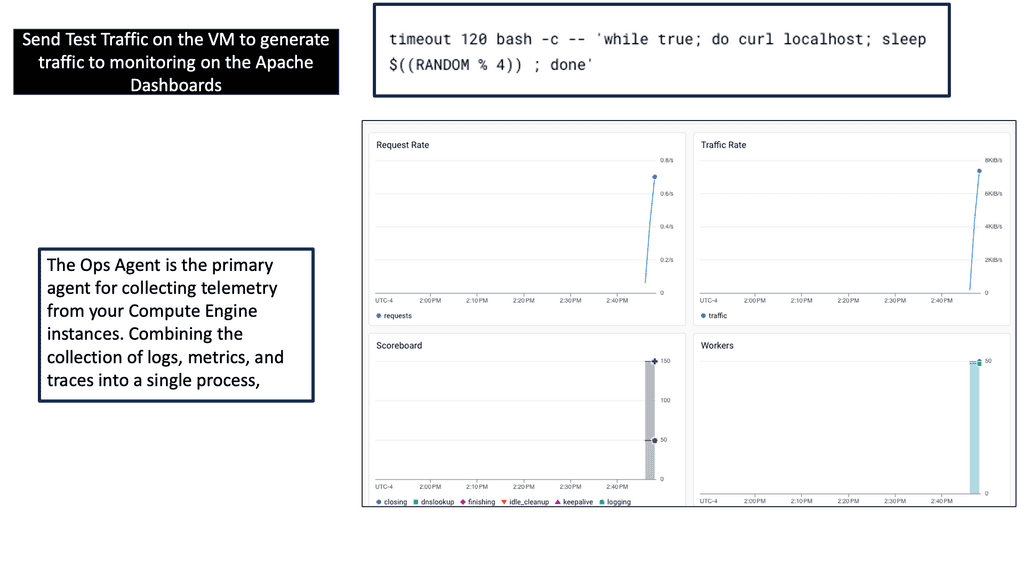
Google Cloud developed Ops Agent, a lightweight and versatile monitoring agent. It seamlessly integrates with Compute Engine instances and provides real-time insights into system metrics, logs, and more. By installing Ops Agent, you gain granular visibility into your instances’ performance, allowing you to address any issues proactively.
To start with Ops Agent, you must install and configure it on your Compute Engine instances. This section will guide you through the steps, from enabling the necessary APIs to deploying Ops Agent on your instances.
Ops Agent offers an extensive range of metrics and logs you can monitor to gain valuable insights into your infrastructure’s health and performance. This section will delve into the available metrics and logs, such as CPU utilization, disk I/O, network traffic, and application logs.
 Observability is critical for building, changing, and understanding the software that powers complex modern systems. Teams that adopt Observability are much better equipped to ship code swiftly and confidently, identify outliers and aberrant behaviors, and understand every user’s experience.
In that case, Observability for software systems measures how well you can understand and explain any state your system can get into, no matter how novel or bizarre.
Observability & Managed Instance Groups
**The Core of Google Cloud’s Scalability**
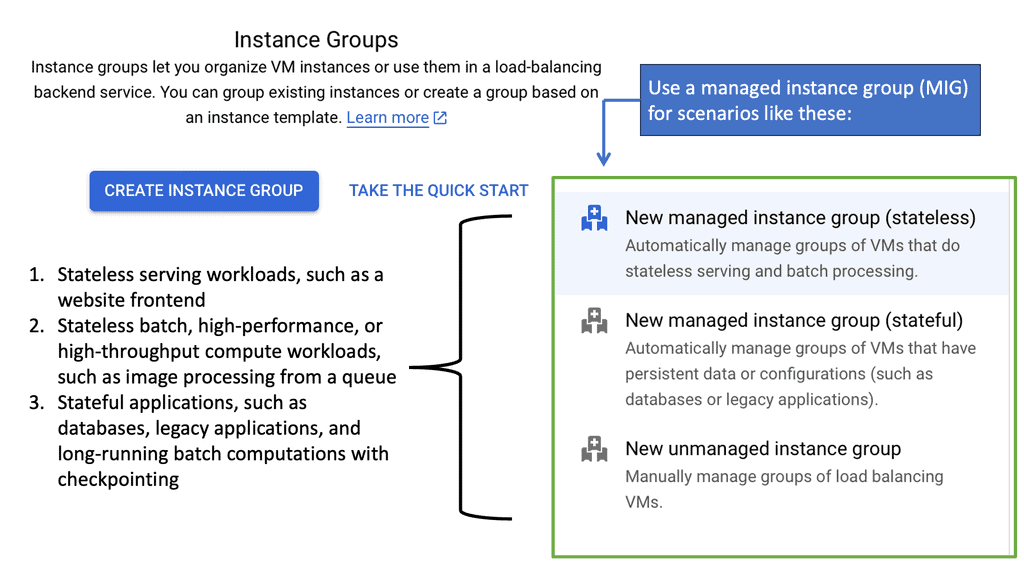
Managed Instance Groups are a fundamental feature of Google Cloud, designed to automate the deployment and management of virtual machine instances. By leveraging MIGs, developers can automatically scale their applications based on current demand, ensuring optimal performance without manual intervention. This automation is achieved through policy-based scaling, which adjusts the number of instances in real-time.
—
**Enhanced Observability with Managed Instance Groups**
Observability is crucial for maintaining the health and performance of cloud-based applications. With Managed Instance Groups, Google Cloud provides robust monitoring and logging tools that offer deep insights into application performance. These tools enable developers to track metrics, set up alerts, and gain a comprehensive view of their infrastructure’s behavior. By integrating observability with MIGs, Google Cloud ensures that any issues can be swiftly identified and resolved, minimizing downtime and enhancing reliability.
—
**Advantages of Using Managed Instance Groups**
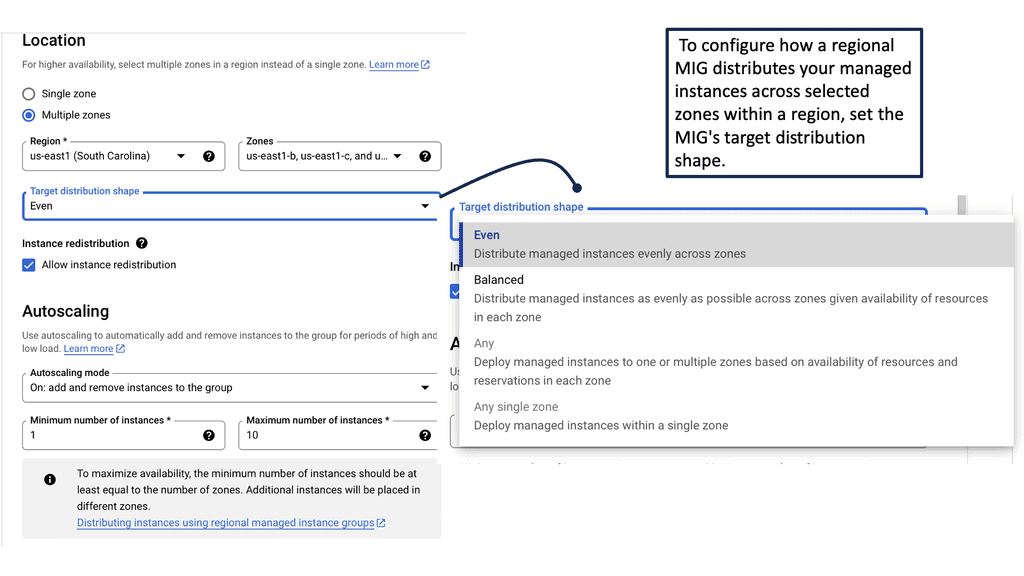
Managed Instance Groups offer several advantages that make them indispensable for modern cloud computing. First and foremost, they provide automatic scaling, which optimizes resource usage and reduces costs. Additionally, MIGs ensure high availability by distributing instances across multiple zones, thereby enhancing fault tolerance. Moreover, they support rolling updates, enabling developers to deploy new features or fixes with minimal disruption.
For additional pre-information, you may find the following helpful
The Three Pillars of Observability
Three Pillars of Observability: Observability rests upon three main pillars: logs, metrics, and traces. Logs capture textual records of system events, providing valuable context and aiding post-incident analysis. Conversely, metrics are quantitative measurements of system behavior, allowing us to track performance and identify anomalies. Traces give a detailed view of request flows and interactions between system components, facilitating troubleshooting and understanding system dependencies.
The Power of Proactive Maintenance: One critical advantage of observability is its ability to enable proactive maintenance. We can continuously monitor and analyze system data to identify potential issues or anomalies before they escalate into critical problems. This proactive approach empowers us to take preventive measures, reducing downtime and improving system reliability.
Unleashing the Potential of Data Analysis: Observability generates a wealth of data that can be harnessed to drive informed decision-making. We can uncover patterns, identify performance bottlenecks, and optimize system behavior by leveraging data analysis techniques. This data-driven approach empowers us to make data-backed decisions that enhance system performance, scalability, and user experience.
The Starting Strategy
Start your observability project in the middle, not in the fridge, and start with something meaningful. There is no point in starting an observability project on something no one cares about or uses that much. So, choose something that matters, and the result will be noticed. On the other hand, something no one cares about will not attract any stakeholder interest.
Service level objectives (SLO)
So, to start an observability project on something that matters and will attract interest, you need to look at metrics that matter: Service Level Objectives (SLOs). With service level objectives, we attach the needs of the product and business to the needs of the individual components, finding the perfect balance for starting observability projects.
The service level objective aggregates over time and is a mathematical equivalent of an error budget. So, over this period, am I breaching my target? If you exceed your SLO target, your users will be happy with the state of your service.
If you are missing your SLO target, your users are unhappy with the state of your service. It’s as simple as that. So, the SLO is the target’s goal over a measurement period. The SLO includes two things: it contains the target and a measurement window. For example, 99.9% of checkout requests in the past 30 days have been successful. Thirty days is the measurement window.
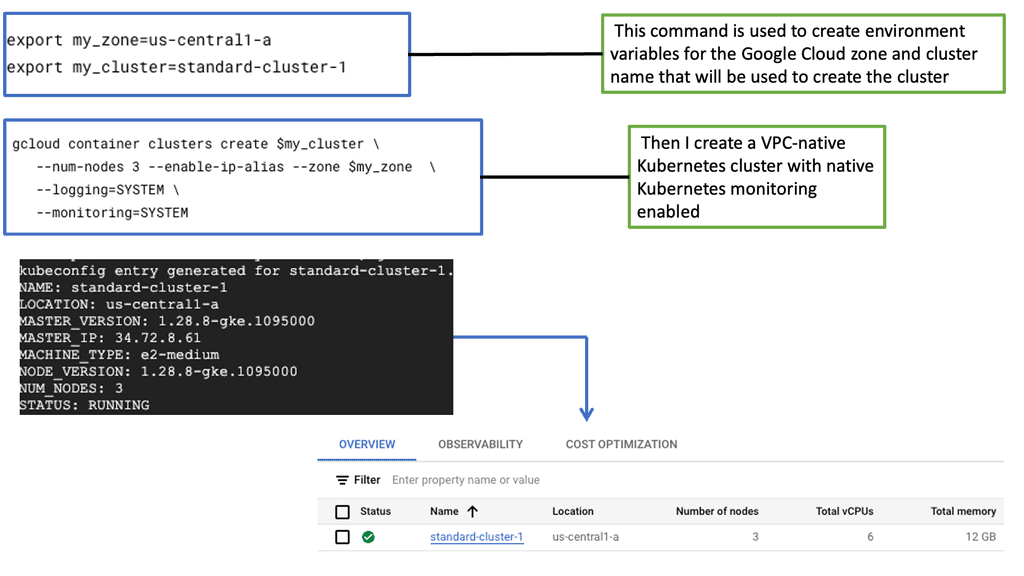
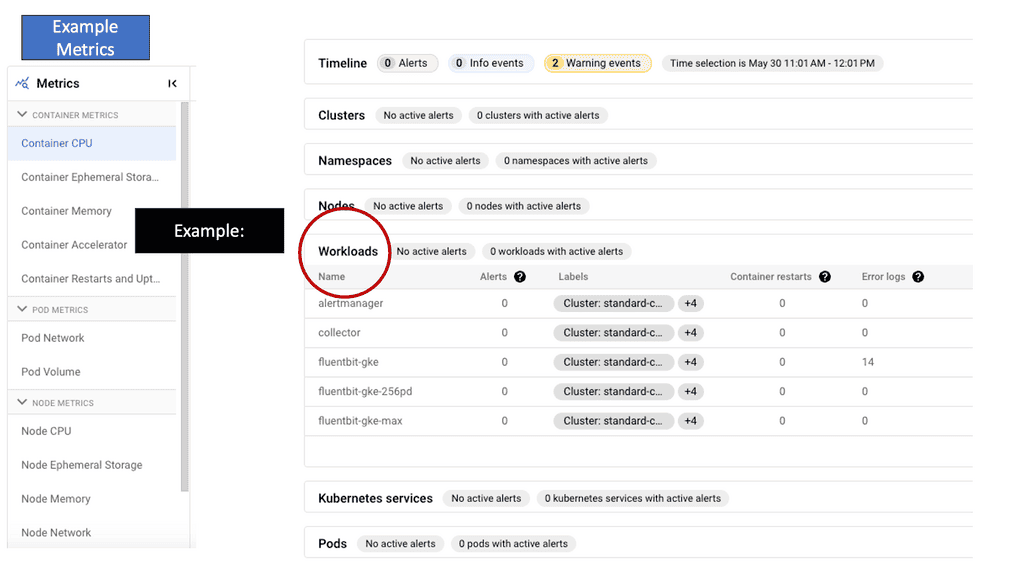
Example: Understanding GKE-Native Monitoring
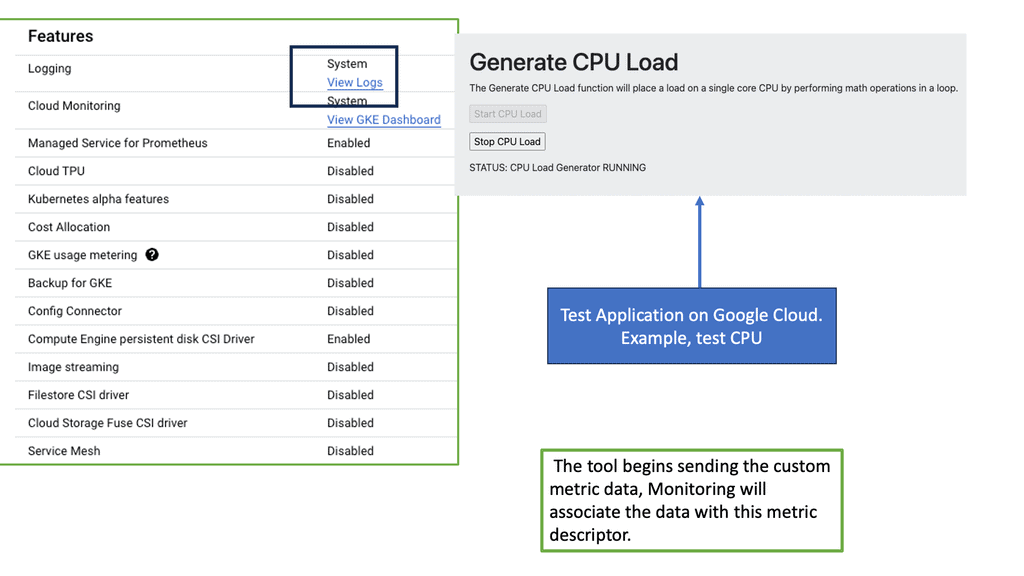
GKE-Native Monitoring provides real-time insights into your GKE clusters, allowing you to monitor the health and performance of your applications. You can easily track resource utilization, latency, error rates, and more with built-in metrics and dashboards. This proactive monitoring enables you to identify bottlenecks, troubleshoot issues, and optimize your cluster’s performance.
GKE-Native Logging simplifies the collection, storage, and analysis of logs generated by your applications running on GKE. By consolidating logs from multiple sources, such as containers, system components, and services, GKE-Native Logging provides a unified view of your application’s behavior. This centralized log management enhances troubleshooting capabilities and lets you gain valuable insights into your application’s performance and security.
**Key Point: Take advantage of Error Budgets**
Once you have determined your service level objectives, it would help to look at your error budgets. Nothing can always be reliable, and it’s ok to fail. This is the only way to perform tests and innovate to meet better user requirements, which is why we have an error budget. An error budget references a budget of failure that you are allowed to have per hour or month.
We need a way to measure the amount of unreliability we will tolerate. Once you know how much of the error budget you have left, you can take more risks and roll out new features. Error budgets help you balance velocity and reliability. So, the practices of SLO and error budgets prioritize reliability and velocity.
**Key Point: Issues with MTTR**
SLO is an excellent way to start and win. This can be approached on a team-by-team basis. It’s a much more accurate way to measure reliability than Mean Time to Recovery (MTTR). The issue with MTTR is that you measure the time it takes to resolve every incident. However, this measurement method can be subject to measurement error. The SLO is more challenging to cheat and a better way to measure.
So, we have key performance indicators ( KPI), service level indicators (SLI), and service level objectives (SLO). These are the first ways to implement Observability, not just look at the KPI. First, you should monitor KPI, SLx, and the system’s internal state. From there, you can derive your service level metrics, which will be the best place to start an observability project.
What is a KPI and SLI: User experience
The key performance indicator (KPI) is tied to system implementation. It conveys health and performance and may change if the system’s architecture changes. For example, database latency would be a KPI. In contrast to KPI, we have service level indicators (SLI). An SLI measures your user experience and can be derived from several signals.
The SLI does not change unless the user needs to. It’s a metric that matters most to the user. This indicator tells you if your service is acceptable or not. So, this line tells you if you have a happy or sad user. It’s a performance measurement, like a metric that describes a user’s experience.
Types of Service Level Indicators
An example of an SLI would be availability, latency, correctness, quality, freshness, and throughout. We need to gather these metrics, which can be done by implementing several measurement strategies, such as application-level metrics, log processing, and client-side instrumentation. So, if we look at an SLI implementation for availability, it would be, for example, the portion of HTTP GET request for /type of request.
The users care about SLI and not KPI. I’m not saying that database latency is not essential. You should measure it and put it in a predefined dashboard. However, users don’t care about database latency or how quickly their requests can be restored. Instead, the role of the SLI is to capture the user’s expectation of how the system behaves. If your database is too slow, you must front it with a cache. So, the cache hit ratio becomes a KPI, but the user’s expectations have not changed.
Starting Observability Engineering
Good Quality Telemetry
You need to understand the importance of high-quality telemetry and adopt it carefully, as it is the first step to good Observation. So, it would be best to have quality logs and metrics and a modern approach such as Observation, which is required for long-term success. For this, you need good Telemetry; without good telemetry, it will be hard to shorten the length of outages.
What are VPC Flow Logs?
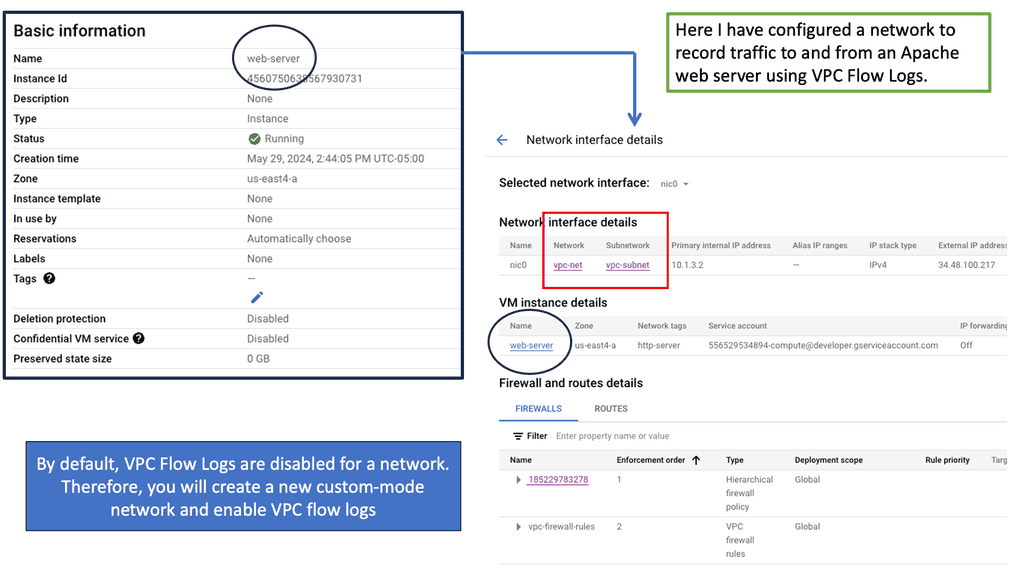
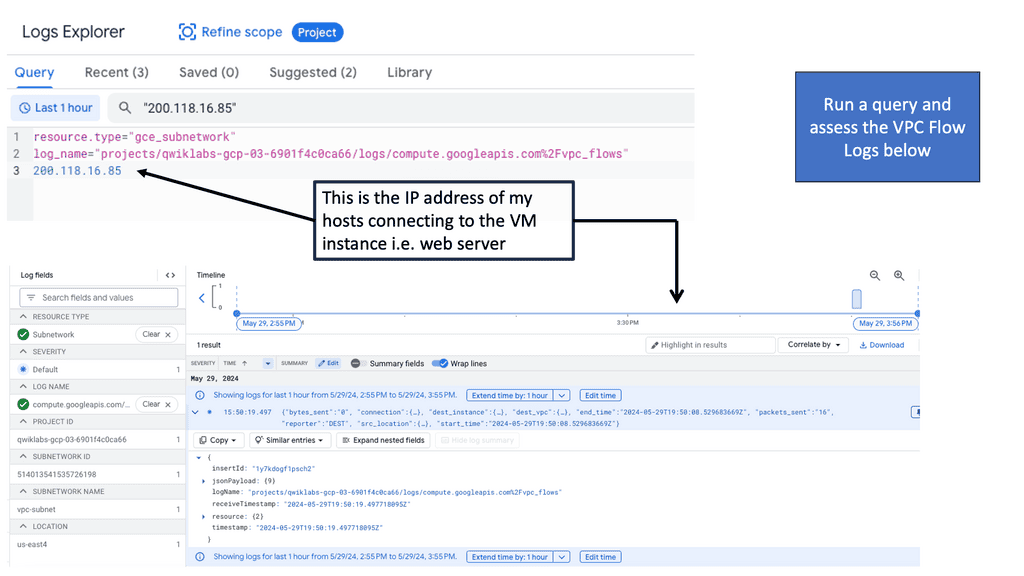
VPC Flow Logs provide detailed information about the IP traffic flowing into and out of Virtual Private Clouds (VPCs) within Google Cloud. These logs capture data at the network interface level, including source and destination IP addresses, ports, protocols, and timestamps. By enabling VPC Flow Logs, network administrators gain a comprehensive view of network traffic, facilitating analysis and troubleshooting.
Analyzing VPC Flow Logs can yield valuable insights for various use cases. Firstly, it enables network administrators to monitor and detect anomalies in network traffic. By studying patterns and identifying unexpected or suspicious behavior, potential security threats can be identified and mitigated promptly. Additionally, VPC Flow Logs provide performance optimization opportunities by identifying bottlenecks, analyzing traffic patterns, and optimizing resource allocation.
Instrumentation: OpenTelemetry
The first step to consider is how your applications will omit telemetry data. OpenTelemetry is the emerging standard for instrumenting frameworks and application code. With OpenTelemetry’s pluggable exporters, you can configure your instrumentation to send data to the analytics tool of your choice.
In addition, OpenTelementry helps with distributed tracing, which enables you to understand system interdependencies. Unless their relationships are clearly understood, those interdependencies can obscure problems and make them challenging to debug.
Understanding Application Latency
Application latency refers to the time it takes for a request to travel from the user to the server and back. Various factors influence it, including network latency, database queries, and processing time. By understanding and measuring application latency, developers can identify areas that require optimization and improve overall performance.
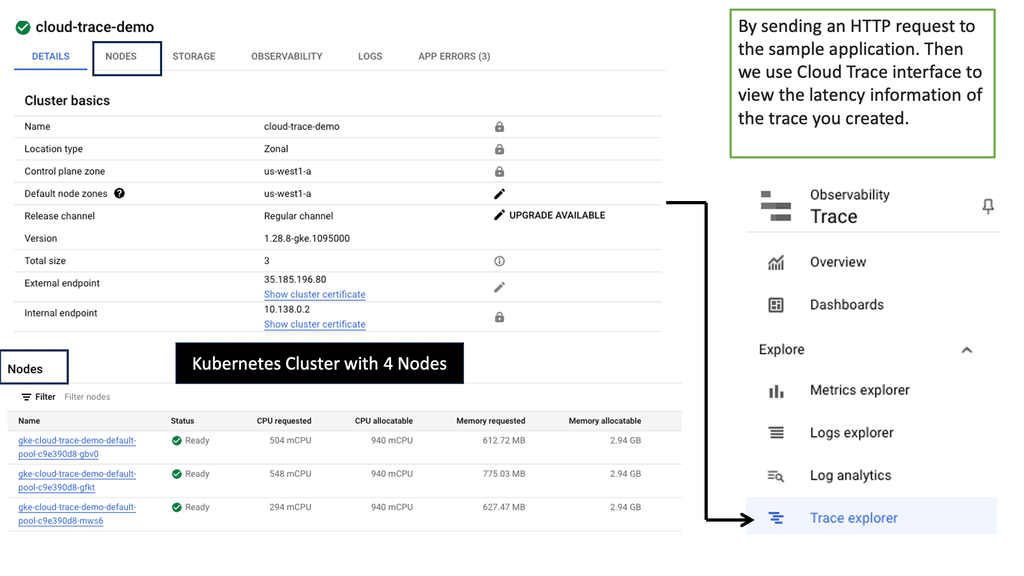
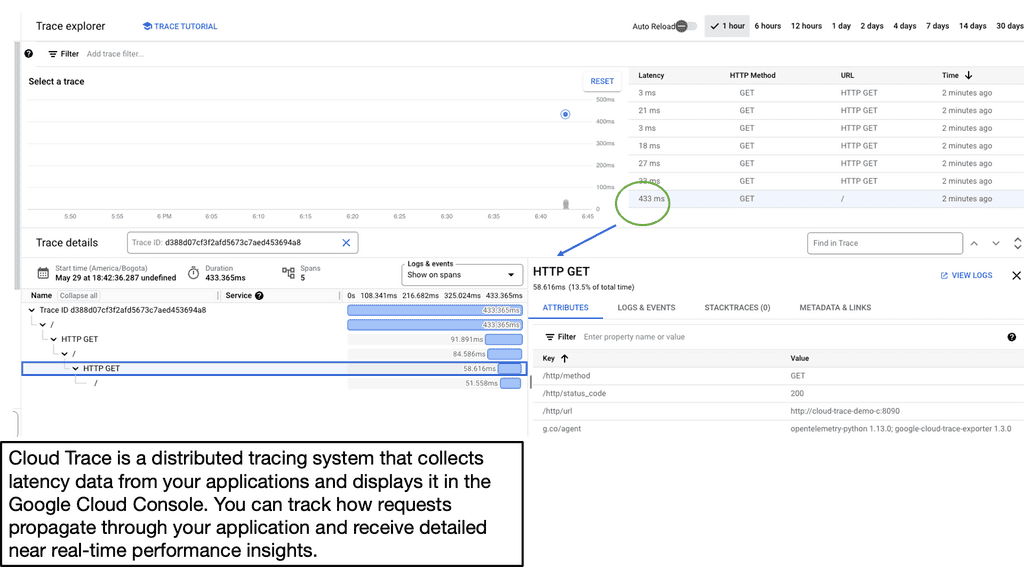
Example: Google Cloud Trace
Google Cloud Trace is a powerful tracing tool provided by Google Cloud Platform. It enables developers to analyze application latency by capturing and visualizing detailed traces of requests as they flow through various components of their applications. With Cloud Trace, developers gain insights into their applications’ performance, enabling them to identify and resolve latency issues efficiently.
**Data storage and analytics**
Once you have high-quality telemetry data, you must consider how it’s stored and analyzed. Depending on whether you use open-source or proprietary solutions, data storage, and analytics are often bundled into the same solution. Commercial vendors typically bundle storage and analytics. These solutions will be proprietary all-in-one solutions, including Honeycomb, Lightstep, New Relic, Splunk, Datadog, etc.
Then, we have the open-source solutions that typically require separate data storage and analytics approaches. These open-source frontends include solutions like Grafana, Prometheus, or Jaeger. While they handle analytics, they all need an independent data store to scale. Popular open-source data storage layers include Cassandra, Elastic, M3, and InfluxDB.
**A final note: Buy instead of building?**
The most significant pain point is knowing how to start. Building your observability tooling rather than buying a commercially available solution quickly proves a return on investment (ROI). However, if you don’t have enough time, you will need to buy it. I prefer buying to get a quick recovery and stakeholder attention. While at the side, you could start to build with open-source components.
Essentially, you are running two projects in parallel. You buy to get immediate benefits and gain stakeholder attraction, and then, on the side, you can start to build your own., which may be more flexible for you in the long term.