For Prometheus metric types, we want as many metrics as possible. These need to be stored to follow trends, understand what has been happening from a historical view, and better predict any issues. So, there are several parts to a Prometheus monitoring solution; we must collect the metrics, known as scraping, store them, and then analyze them. In addition, we need to consider storage security, compliance, and regulatory concerns for distributed systems observability.
Monitoring the correct metric is key; having metrics lets you view how the system performs. The Prometheus metrics types represent raw measurement of resource usage, which can help you plan for upgrading and tell you how many resources are being used.
To be clear, there are two kinds of “types” in Prometheus. There are the metric types of metrics and the data types of PromQL expressions.
Prometheus has four metric types:
- Counters
- Gauges
- Histograms
- Summaries
PromQL subsequently has four data types:
- Floats (mostly scalars)
- Range vectors
- Instant vectors
- Time (though it’s often not counted in this category)
Let me briefly explain them:
- The counter is for cumulative values, like the number of requests or errors.
- Gauge represents a single value that can go up or down, like CPU usage.
- Histogram is used to track the size of an event, like a request time, and will group values in custom quantiles (buckets) depending on the data.
- Summary is similar to a histogram, but the difference is that the quantiles don’t depend on the data (typically, you’ll have 0.5, 0.9, or 0.99 quantiles).
Prometheus Metric Types Best Practices:
Now that we have explored the different metric types offered by Prometheus let’s discuss some best practices for using them effectively:
1. Choose the appropriate metric type for your use case. Consider each type’s characteristics and relevance to your monitoring needs.
2. Avoid combining unrelated metrics into a single metric type. This can lead to confusion and make it harder to analyze the data.
3. Use labels to add additional dimensions to your metrics. Labels allow you to differentiate between instances or environments, providing more context to your monitoring data.
Prometheus Pull Approach
It’s easy to monitor a Kubernetes cluster with the pull model because of service discovery and shared network access within the cluster. However, watching a dynamic fleet of virtual machines, AWS Fargate containers, or Lambda functions with Prometheus is hard. How come?
Identifying metrics endpoints for scraping is difficult; network security policies may restrict access to those endpoints. Prometheus Agent Mode was released at the end of 2021 to solve some of these problems. This mode collects metrics and sends them to a monitoring backend via the remote write protocol.
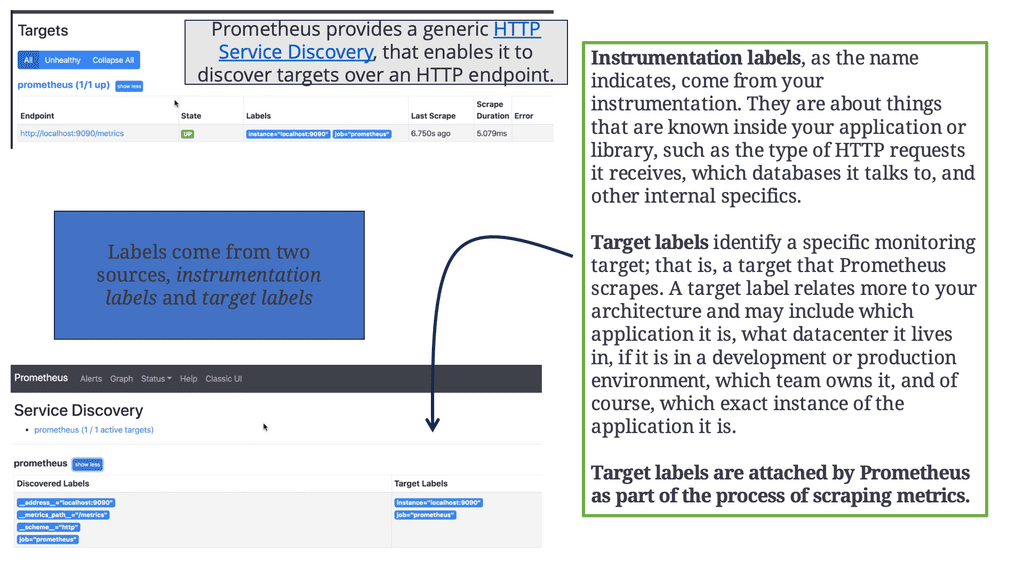
A) Prometheus Service Discovery
Prometheus discovers targets to scrape from service discovery. These can be instrumented or third-party applications you can scrape via an exporter. The scraped data is stored, and you can use it in dashboards using PromQL or send alerts to the Alertmanager, which will convert them into pages, emails, and other notifications. Metrics do not typically magically spring forth from applications; someone has to add the instrumentation that produces them.
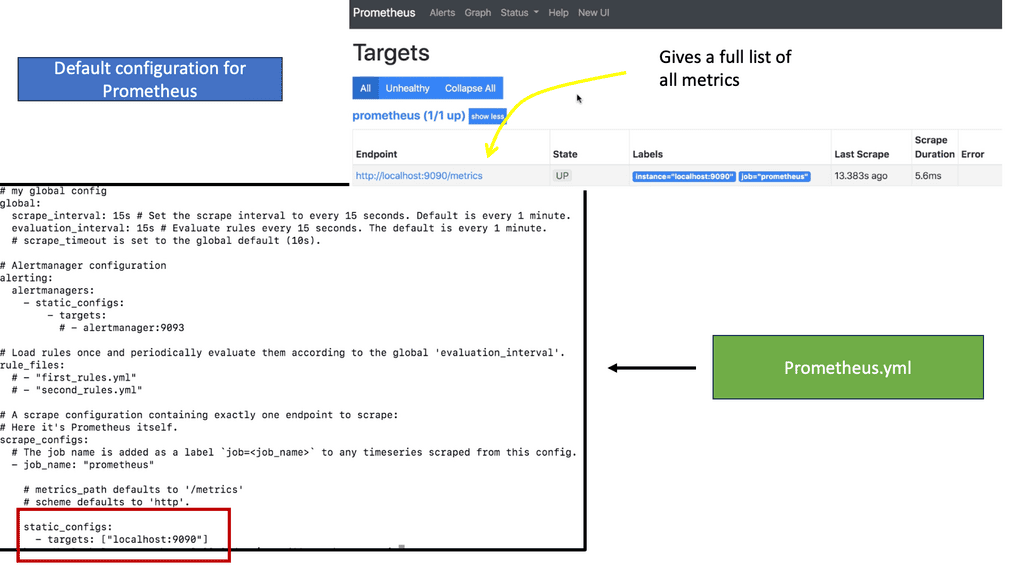
B) Default Prometheus configuration.
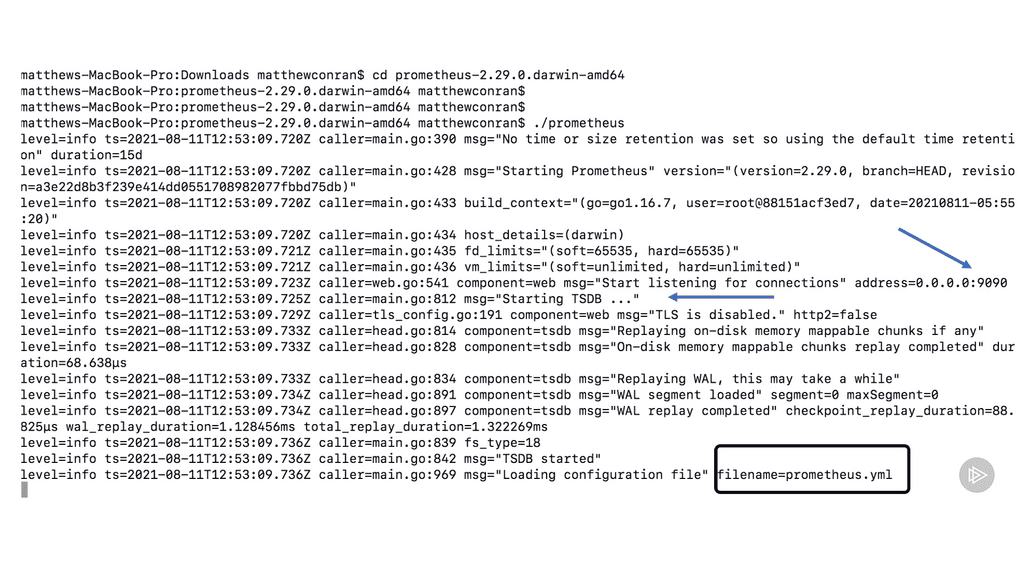
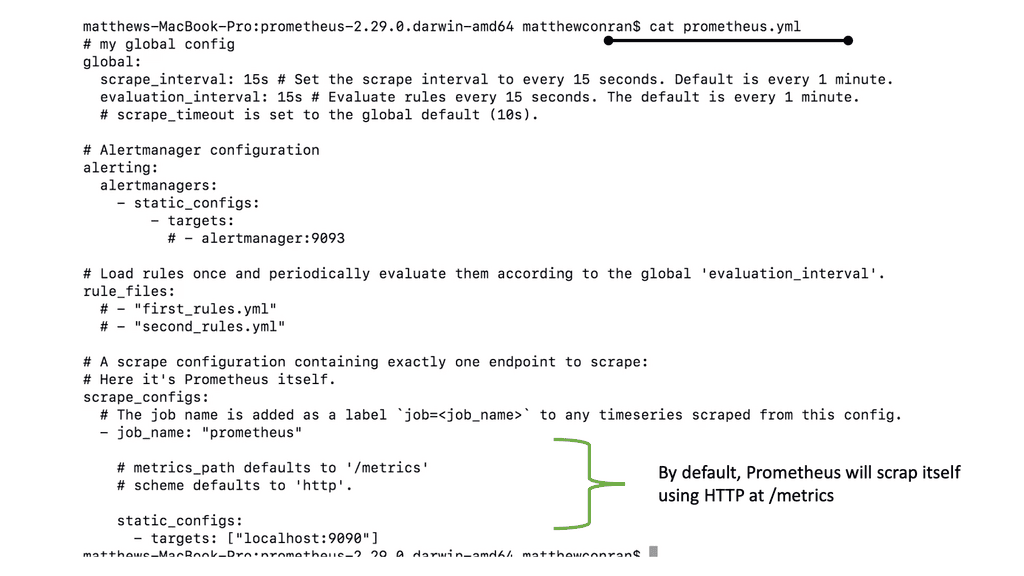
In the following lab guide, you will see Prometheus’s default configuration. I have done a cat prometheus.yml, and you can see Prometheus is scaping itself for metrics. Prometheus is configured through a single YAML file.
The Prometheus YAML file serves as the configuration file for Prometheus and defines the various aspects of the monitoring setup. It consists of a set of key-value pairs organized in a hierarchical structure, instructing Prometheus on what to scrape, how to scrape it, and how to handle the collected data.
C) Global Configuration:
This section defines global configurations applicable to the entire Prometheus setup. Key elements in this section include the scrape_interval (specifying the time interval between scrapes) and the evaluation_interval (determining how frequently Prometheus evaluates the collected data).
D) Scrape Configuration:
Prometheus collects metrics from various targets using scrape configurations. In this section, users can define scrape jobs, specifying the target endpoints, scrape intervals, and other related parameters. Each scrape configuration corresponds to a specific target, such as an application, database, or server.
E) Alerting Rules:
Prometheus allows users to define alerting rules to trigger notifications based on specific conditions. The alerting_rules section in the YAML file is dedicated to configuring these rules. Users can define rules for metrics thresholds, anomalies, or other necessary conditions for their monitoring needs.
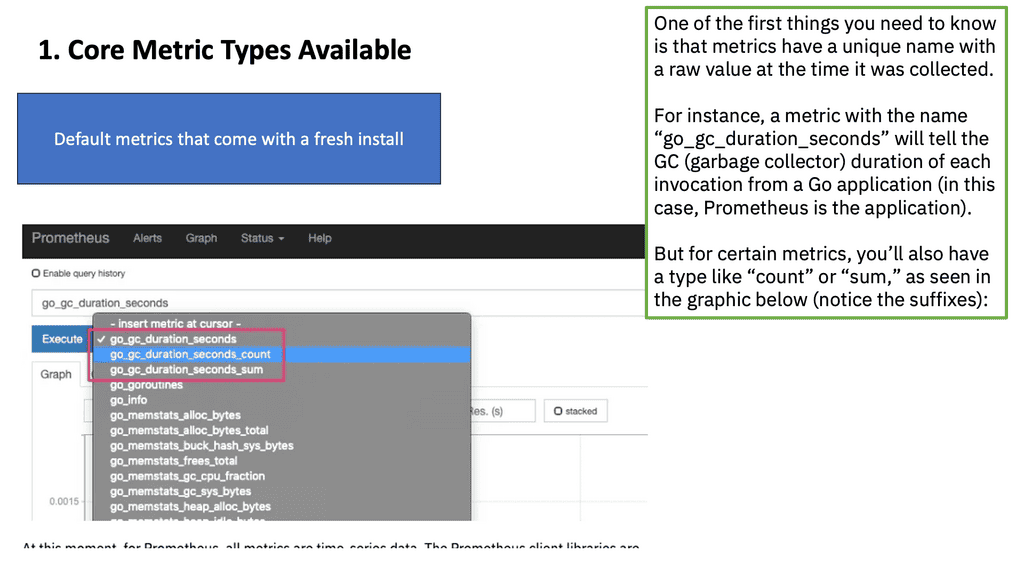
Core Metric Types
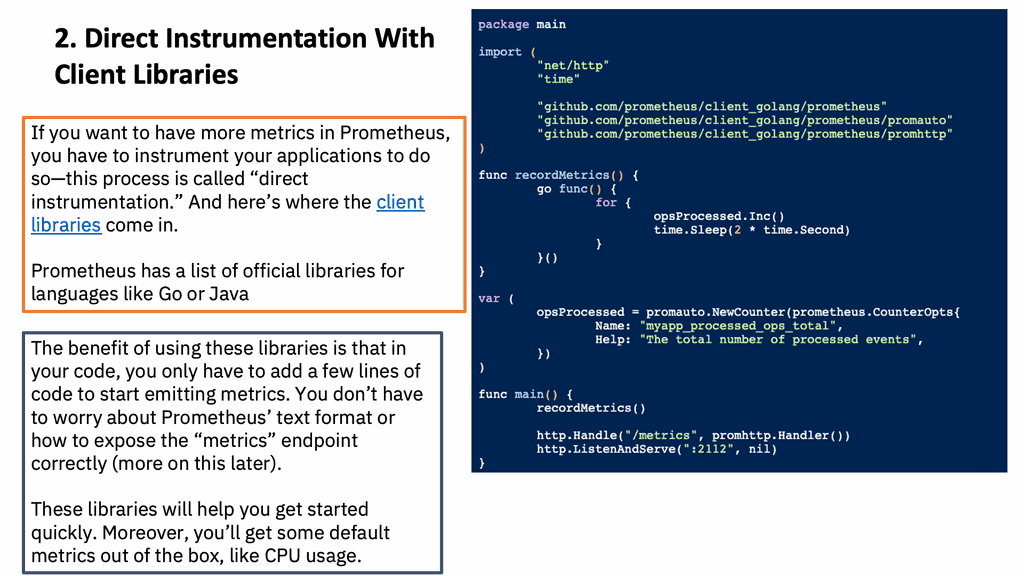
Direct Instrumentation with Client Libraries
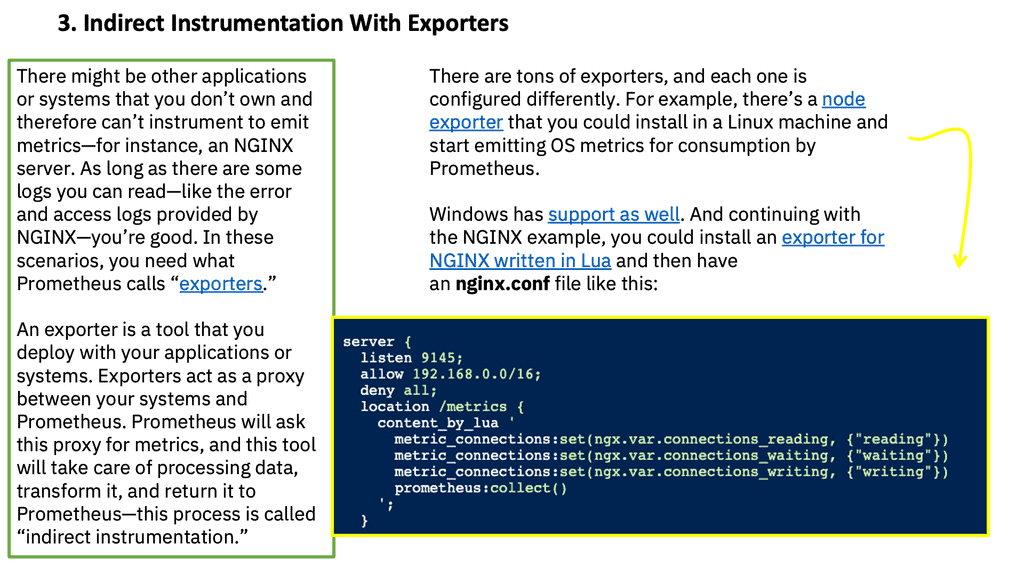
Indirect Instrumentation with Exporters
You must remember that Prometheus is only used to collect and explore metrics. Because it uses a time series data model, data is identified by metric names and has key-value pairs.
Prometheus cannot be used for logging or event-driven architectures that require tracking of individual events. Notice that none of the examples or use cases I’ve used in previous sections relate to logs.
Prometheus is suitable for storing CPU usage, latency requests, error rates, or networking bandwidth.
Moreover, Prometheus makes trade-offs with the data it collects. This means that it will prefer to provide 99.99% accurate data (per their documentation) rather than degrade performance or break monitoring systems. You should avoid using this method to access essential information like a bank account balance because you may lose some data.
Starting with Prometheus Metric Types
Metrics can be applied to various components, are a unit of measurement for evaluating an item, and are consistently measured. Examples of common measurements include CPU utilization, memory utilization, and interface utilization. These are numbers about how your resources are performing.
For the metrics side of things, we have runtime, infrastructure, and application metrics, including Prometheus Exporters, response codes, and time-to-serve data. We also have CI/CD pipeline metrics such as build time and failures. Let’s discuss these in more detail.
**The process of exposition**
Exposition is the process of making metrics available to Prometheus. Exposition to Prometheus is done over HTTP. Usually, metrics are exposed under the /metrics path, and a client library handles the request. Prometheus supports both the Prometheus text format and OpenMetrics.
You can produce the exposition format by hand, which is easier with the Prometheus text format. If no suitable library exists for your language, a library is recommended. Most libraries will support both OpenMetrics and Prometheus text formats.
When metrics are defined, they are usually registered with the default registry. If one of the libraries you depend on has Prometheus instrumentation, you will benefit from it automatically. Some users prefer explicitly passing a registry down from the primary function, so you’d have to rely on each library between your application’s primary function and the Prometheus instrumentation to be aware of it. It assumes that all libraries in the dependency chain care about instrumentation and agree on which libraries to use.
**Detailing: Prometheus Metric Types**
The Prometheus client libraries offer four core metric types. These are currently only differentiated in the client libraries (to enable APIs tailored to the usage of the specific types) and in the wire protocol. The Prometheus server does not yet use the type information and flattens all data into untyped time series. This may change in the future.
a) Counters
The first metric type we’ll explore is the Counter. Counters are monotonically increasing values, meaning they only increase over time. These metrics often measure the number of requests served or the total number of events processed. Counters are reset to zero when the Prometheus server restarts, ensuring accurate measurements.
Countermetrics are used to increase measurements. Since they are cumulative, their value can only increase. Exceptionally, the counter’s value is reset to zero when it is restarted. A counter’s value could be more helpful on its own. However, a counter value is often used to compute the delta or rate of change between two timestamps.
Do not use a counter to expose a value that can decrease. For example, do not use a counter for the number of currently running processes; instead, use a gauge.
Client library usage documentation for counters:
b) Gauges
Next up, we have Gauges. Gauges represent a single numerical value that can arbitrarily go up or down. They are commonly used to track metrics like CPU usage or memory consumption. Unlike counters, gauges hold their value until explicitly changed by the exporter.
Gauge metrics measure increases or decreases. This metric type is more familiar since the actual value without additional processing is meaningful. A gauge is, for instance, a metric that measures the temperature, CPU, memory usage, or queue size.
Client library usage documentation for gauges:
c) Histograms
Histograms measure the distribution of values in a given dataset. Prometheus histograms are divided into configurable buckets, allowing you to track metrics such as response times or request sizes. Each bucket captures the number of observations falling into a specific range, making it easier to analyze data distribution.
A histogram represents a distribution of measurements. For example, request durations or response sizes are often measured with them. A histogram counts how many measurements fall into each bucket based on the entire range of measurements.
Client library usage documentation for histograms:
NOTE: Beginning with Prometheus v2.40, there is experimental support for native histograms. A native histogram requires only a one-time series, including a dynamic number of buckets and the sum and count of observations. Native histograms allow much higher resolution at a fraction of the cost. Detailed documentation will follow once native histograms are closer to becoming stable.
d) Summary
The Summary metric type is similar to histograms but focuses on calculating quantiles over a sliding time window. This makes it helpful in measuring request durations or API response times. Summaries provide information about the distribution of values, including the minimum, maximum, and quantiles.
Client library usage documentation for summaries:
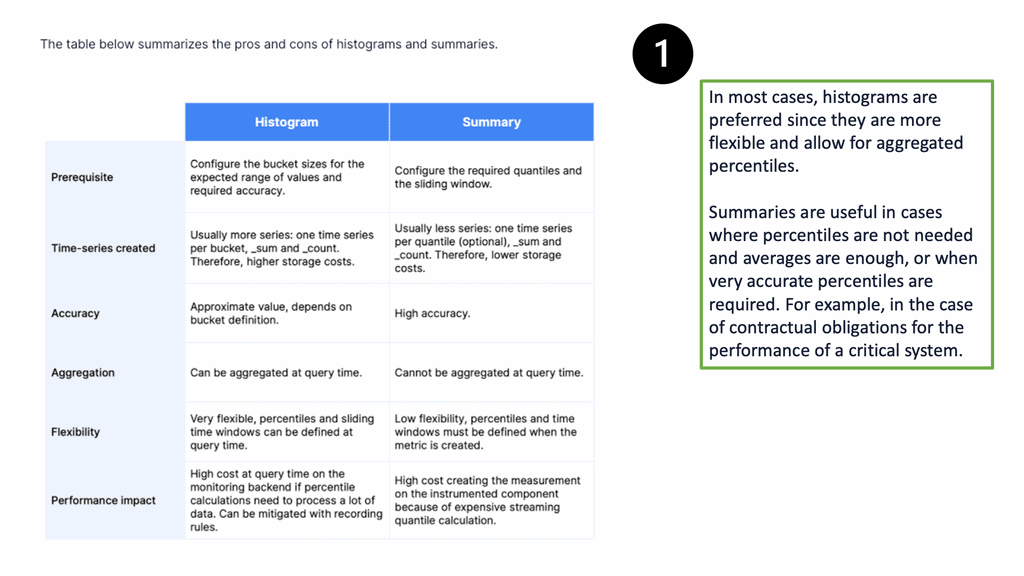
**Summary vs. Histogram**
A critical distinction between summaries and histograms is their storage requirements. Summaries must retain a sample for each observed value, while histograms only store aggregated data points. Therefore, summaries are more memory-intensive but provide more precise quantile calculations.
- Untyped
The untyped metric type is a catch-all category that can be used when none other metric types fit the collected data. It represents a value that can change over time but does not fall into any specific category. Untyped metrics are helpful when you require flexibility and simplicity, but they lack the advanced analysis capabilities of other metric types.
Highlighting Prometheus Monitoring
Previously, Heapsters was used as a monitoring solution that came out of the box with Kubernetes. We now have Prometheus as the de facto standard monitoring system for Kubernetes clusters, bringing many benefits. Firstly, Prometheus monitoring scales with a pull approach and the Prometheus federated options. The challenge is that if we run microservices at scale and the monitoring system pushes metrics out to a metric server, the monitoring system can flood the network.
Also, with a push-based approach, you may need to scale up instead of out, which could be costly. We can have a bunch of different systems we want to monitor. Therefore, the metrics content will differ for the systems and components, but Prometheus collects and exports the same. This provides a welcomed layer of unification for the different systems in the network.
Exporters and Client Libraries
With Prometheus monitoring, you can get metrics from the systems you want to monitor using pre-built exporters and custom client libraries. Prometheus works very well with Docker and Kubernetes but can also work outside the container networking world with non-cloud native applications using exporters.
You can monitor your entire stack with a wide range of exporters and client libraries. We install the code library and gather custom applications and runtime metrics for cloud-native applications. Installing code in the application lets us see the custom metrics that matter most to us.
What are Prometheus Exporters?
Prometheus exporters are software components that expose metrics in a format that Prometheus can scrape. They act as intermediaries between Prometheus and the systems or applications being monitored.
These exporters collect metrics from various sources, including databases, web servers, cloud platforms, and custom applications. By providing a standardized interface, exporters allow Prometheus to collect and store metrics from diverse sources uniformly.
Prometheus exporters work by exposing a web server that serves metrics in a format known as the Prometheus exposition format. This format consists of simple text-based data, usually in the form of key-value pairs. The exporters periodically expose an HTTP endpoint that Prometheus scrapes to collect the metrics. The scraped metrics are then stored in the Prometheus time-series database, where they can be queried and visualized.
Types of Prometheus Exporters:
Prometheus exporters come in various forms, each designed to collect metrics from specific systems or applications. Some famous exporters include:
1. Node Exporter collects system-level metrics such as CPU, memory, disk, and network statistics from Linux or Unix-based systems.
2. Blackbox Exporter: Allows monitoring of network endpoints by performing HTTP, TCP, ICMP, and DNS probes.
3. MySQL Exporter: Collects metrics from MySQL databases, providing insights into query execution time, connection statistics, and more.
4. Redis Exporter: This tool gathers metrics from Redis, a popular in-memory data structure store. It enables monitoring key performance indicators such as memory usage, latency, and throughput.
What are Prometheus Client Libraries?
Prometheus provides client libraries in various programming languages, including, but not limited to, Go, Java, Python, Ruby, and JavaScript. These libraries bridge your application and Prometheus, allowing you to collect and expose relevant metrics effortlessly.
1. Go Library:
Prometheus’ Go client library, known as “client_golang,” is widely used due to its simplicity and robustness. It provides a straightforward API to instrument your Go applications, making it easy to expose custom metrics, collect and record them, and serve them via an HTTP endpoint. You can seamlessly integrate Prometheus monitoring into your Go-based projects with the Go client library.
2. Java Library:
Prometheus offers a dedicated client library for Java-based applications called “client_java.” This library allows you to instrument your Java code using simple annotations, making it effortless to expose metrics. The Java library simplifies monitoring Java applications with features like automatic metric exposition via HTTP endpoints and support for popular Java frameworks like Spring Boot and Micronaut.
3. Python Library:
Prometheus’ Python client library, known as “client_python,” provides a Pythonic way to instrument your Python applications. With its intuitive API, you can easily expose custom metrics, collect and record them, and serve them via an HTTP endpoint. The Python library also supports popular web frameworks like Flask and Django, making it a convenient choice for developers.
4. Ruby Library:
For Ruby developers, Prometheus provides a client library called “client_ruby.” This library allows you to instrument your Ruby applications effortlessly. It offers features like metric collection, recording, and exposing metrics via an HTTP endpoint. The Ruby library integrates well with popular Ruby frameworks like Ruby on Rails, enabling seamless monitoring of Ruby applications.
5. JavaScript Library:
Prometheus’ JavaScript client library, known as “client_js,” enables web developers to instrument their JavaScript-based applications. This library lets you easily expose custom metrics, collect and record them, and serve them via an HTTP endpoint. The JavaScript library is compatible with both browser-based JavaScript and Node.js, making it versatile for monitoring frontend and backend applications.
Additional Metric Types:
Prometheus Metric type: Runtime metrics
Runtime Metrics are statistics collected by the operating system and application host. These include CPU usage, memory load, and web server requests. For example, this could be CPU and memory usage from a Tomcat and JVM from a Java app.
Prometheus Metric type: Infrastructure metrics
We examine CPU utilization, latency, bandwidth, memory, and temperature metrics for Infrastructure metrics. These metrics should be collected over a long period and applied to infrastructure such as networking equipment, hypervisors, and host-based systems.
Prometheus Metric type: Application metrics
Then, we have Application metrics and custom statistics relevant only to the application and not the infrastructure. Application metrics pertain specifically to an application. This may include the number of API calls made during a particular time.
This can be quickly done with web-based applications; here, we can get many status codes that provide information. These metrics are easy to measure, and the response codes are available immediately. For example, an HTTP status code 200 is good, and 400 or more is an issue.
Prometheus Metric type: Time to first byte
Another important metric is the time a web server takes to respond to the data. The important metric here is time to the first byte (TTFB). This measures how long it takes for your application to send data. Time to the first byte refers to the time between the browser requesting a page and when it receives the first byte of information from the server. If this metric exceeds the usual, you may need caching, faster storage, or a better CPU.
Let us take the example of the content delivery network (CDN); what is an excellent time to the first byte? On average, anything with a TTFB under 100 ms is fantastic. Anything between 200 and 500 ms is standard, and anything between 500 ms and 1 second is less than ideal. Anything more significant than 1 second should likely be investigated further.
Prometheus Metric type: CI/CD pipeline metrics
For the CI/CD Pipeline metrics, we want to measure the time to do the static code analysis. Next, we want to count the number of errors while running the pipeline. Finally, we want to measure the build time and build failures. These metrics include the time it takes to build an application, the time it takes to complete tests, and how often builds fail.
Prometheus Metric type: Docker metrics
Docker metrics come from the Docker platform. These may include container health checks, the number of online and offline nodes in a cluster, and the number of containers and actions. These container actions may be stopped, paused, or run. So, we have built-in metrics provided by Docker to give additional visibility to the running containers. When running containers in production, monitoring their runtime metrics, such as CPU and memory usage, is essential.
Docker Metrics
Metrics from the Docker Platform are essential for containers when Docker stops and starts applications for you. You can’t gather one metric type without the other. For example, if you look at the application metrics, you only look at half of the puzzle and may miss the problem.
For example, if one of your applications is performing poorly and the docker platform constantly spins up new containers, you would not see that just under the application metrics. Your application and runtime metrics may seem to be within the standard thresholds. However, combining this with the Docker Platform metrics shows the container stats, showing a spike in container creation.
Exposing application metrics to Prometheus
Application metrics give you additional information. Unlike runtime metrics you get for free, you need to record what you care about explicitly. Here, we have client libraries that Prometheus offers. All the major languages have a Prometheus client library, which provides the metrics endpoint. The client library makes application metrics available to Prometheus, giving you a very high level of visibility into your application.
With Prometheus client libraries, you can see what is happening inside the application. So, we have both Prometheus exporters and Prometheus client libraries that allow Prometheus to monitor everything.
Exposing Docker Metrics to Prometheus
First, Docker Default Networking 101. The Docker Engine interacts with all clients and collects and exports metrics. When you build a Docker image, the Engine records a metric. We need insights into the Docker platform. Here, we can expose Docker metrics to Prometheus. The Docker Engine has a built-in mechanism to export metrics in Prometheus format. So we have, for example, the Docker metrics covering the Engine and container and metrics about images.
Docker metric types: Three types
The types of metrics have three areas. First, we have the Docker Engine, Builds, and Containers.
- The Engine will give you information on the host, such as the CPU count, O/S version, and build of the Docker Engine.
- Then, for Build metrics, it is helpful for information such as the number of builds triggered, canceled, and failed.
- Container metrics also show the number of containers stopped and paused and the number of health checks that are fired and failed.
Wrap up: Prometheus monitoring.
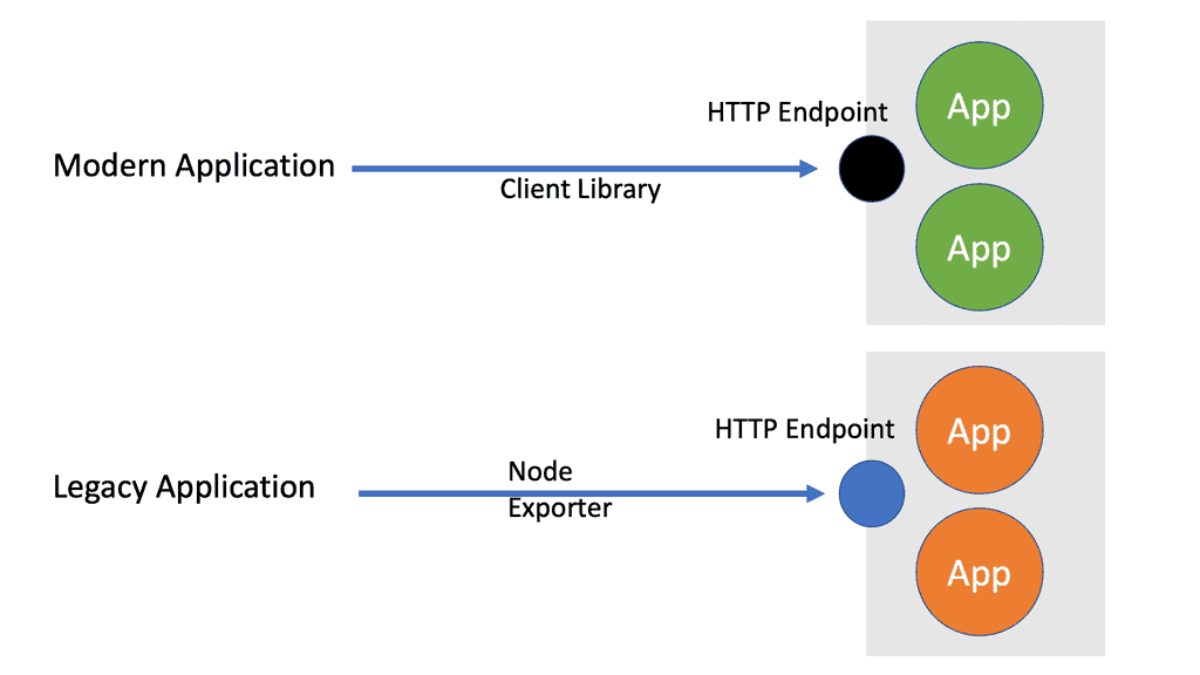
So, for Prometheus monitoring, we have Prometheus exporters that can get metrics for, let’s say, a Linux server and application metrics that can support Prometheus using a client library.
Both have an HTTP endpoint that returns metrics in the standard Prometheus format. Once the HTTP endpoint is up and running on the application ( legacy or cloud-native ), Prometheus will scrape ( collect ) the metric with dynamic or static approaches.
So we have Exporters that can add metrics to systems that don’t have Prometheus support. We also have Prometheus client libraries that can provide Prometheus support in the application. These client libraries can provide out-of-the-box runtime and custom metrics relevant to the applications.