
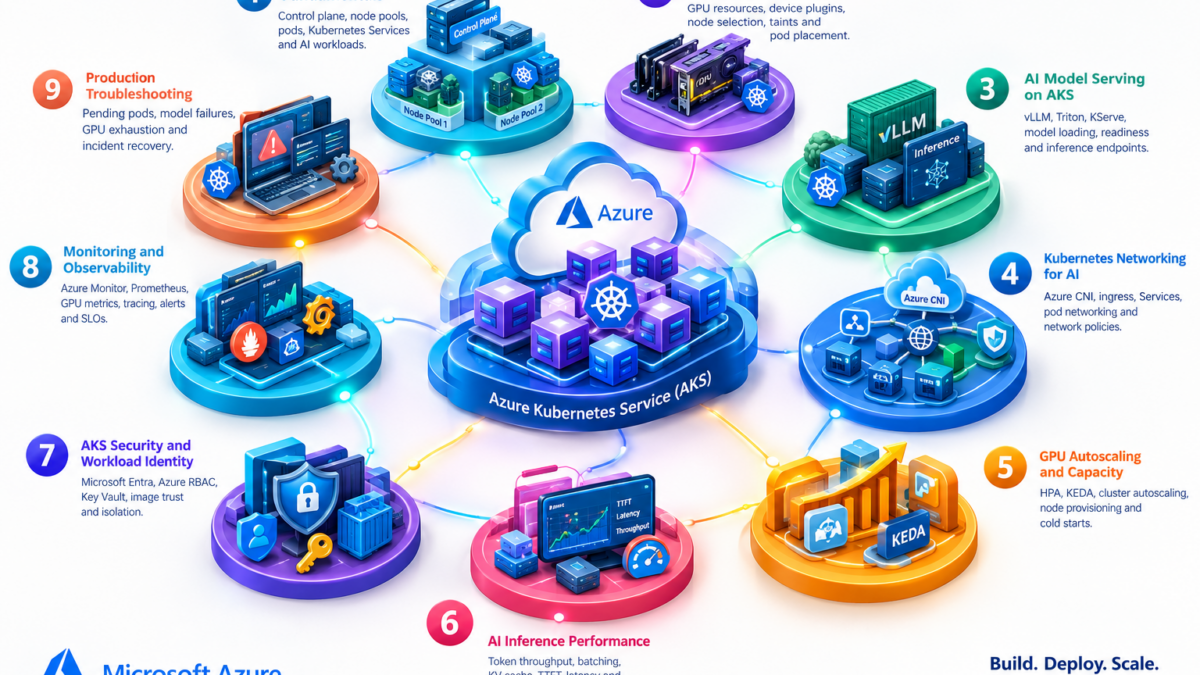
Azure AI Kubernetes and AKS Architecture Explained
Modern AI infrastructure increasingly relies on Kubernetes to orchestrate containerized inference workloads, allocate accelerator resources, expose model endpoints, and scale services according to demand.
Azure Kubernetes Service (AKS) provides managed Kubernetes infrastructure for deploying and operating AI applications across CPU and GPU worker nodes.
Understanding AKS AI architecture requires knowledge of Kubernetes scheduling, GPU device allocation, containerized model serving, cluster networking, autoscaling, security, and production observability.
Inside an Azure AKS AI Inference Cluster
An AKS AI deployment typically combines a managed Kubernetes control plane, application worker nodes, GPU-enabled node pools, model-serving containers, and networking services that expose inference endpoints to applications.
GPU Allocation
Inference Runtime
GPU Allocation
Inference Runtime
GPU Allocation
Inference Runtime
Six Engineering Layers of AKS AI Infrastructure
Production AI inference on Kubernetes depends on several tightly integrated infrastructure layers. Each introduces distinct operational requirements and troubleshooting considerations.
Kubernetes Orchestration
The Kubernetes API, scheduler, and controllers manage workload placement, desired state, and application lifecycle.
GPU Compute
GPU node pools provide accelerator capacity for model execution. Device plugins and resource requests enable scheduling.
Model Serving
Model-serving containers load model weights, process inference requests, and return predictions or generated tokens.
Networking
Azure networking, Kubernetes Services, ingress, DNS, and network policies control application connectivity.
Scaling and Capacity
Pod and node scaling mechanisms respond to supported metrics, workload demand, and available capacity.
Production Operations
Monitoring, security, logging, tracing, and incident response help maintain reliable AI inference services.
Why Kubernetes Matters for AI Engineering
AI inference workloads have characteristics that differ from conventional stateless web applications. Large model weights, accelerator memory, initialization time, token generation, and request concurrency introduce additional operational complexity.
Kubernetes provides a consistent orchestration framework for packaging and operating these workloads, but effective AI deployment still requires careful GPU capacity planning, model-serving configuration, networking design, and performance measurement.
This guide examines AKS from an infrastructure engineering perspective: how GPU workloads are scheduled, how inference packets reach model containers, how scaling responds to demand, and how engineers investigate production failures across Kubernetes, networking, and AI runtimes.
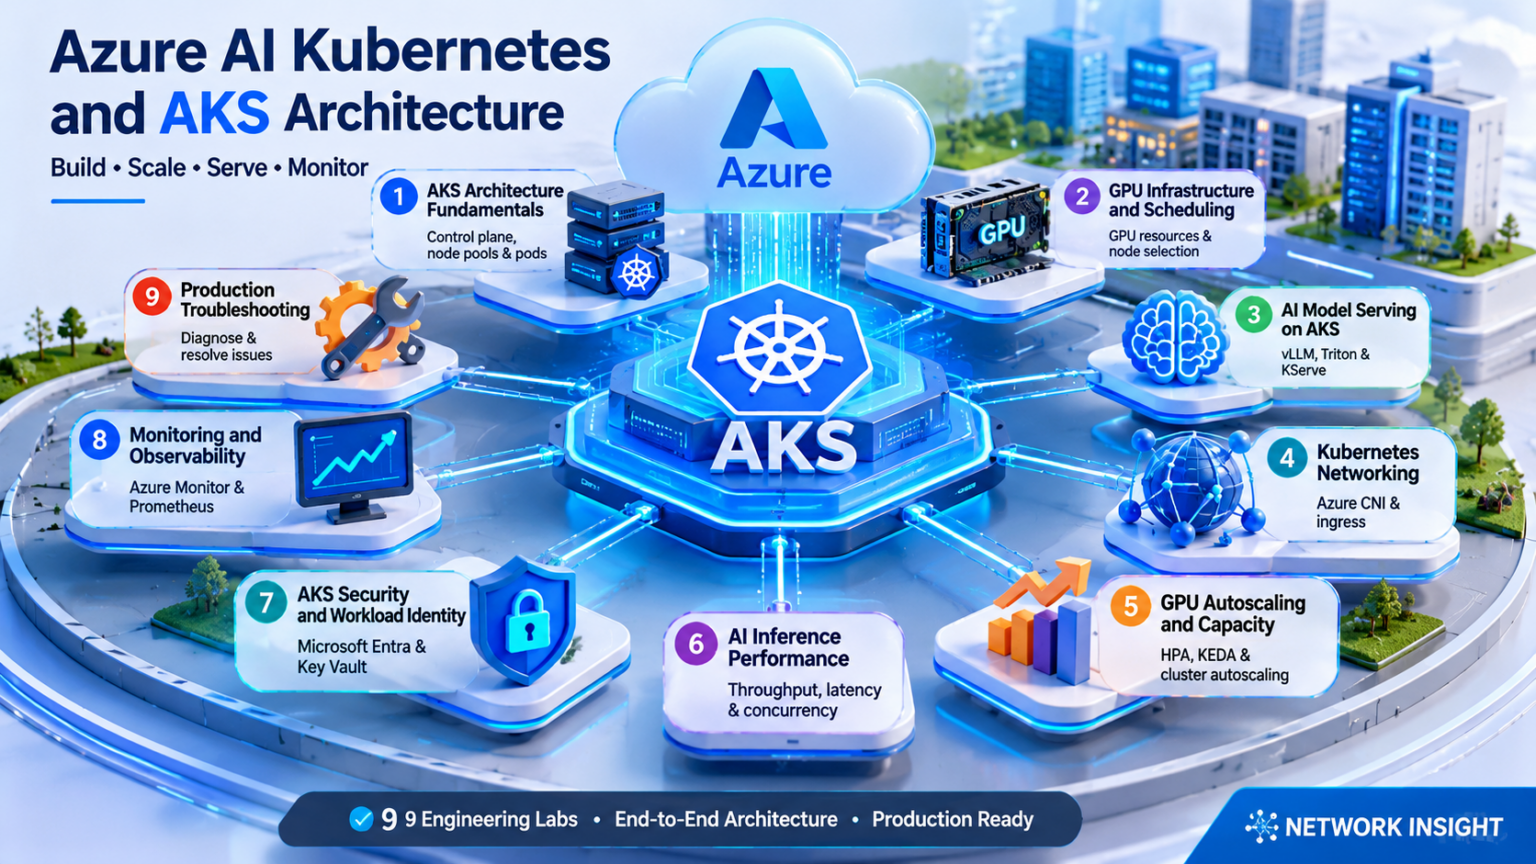
Explore the AKS AI Architecture
Navigate nine engineering layers of Azure Kubernetes Service for AI. Explore GPU scheduling, model serving, Kubernetes networking, autoscaling, inference performance, security, observability, and production troubleshooting.
Azure AKS Architecture Fundamentals for AI Workloads
Azure Kubernetes Service provides a managed Kubernetes environment for deploying, scheduling, networking, and operating containerized AI applications.
The architecture separates a Microsoft-managed Kubernetes control plane from worker nodes that execute application workloads. For AI infrastructure, these worker nodes may include specialized GPU-enabled virtual machines.
Understanding this separation is essential for designing reliable AI inference clusters, troubleshooting scheduling failures, and managing infrastructure capacity.
Understanding the AKS Control Plane and Worker Nodes
An AKS cluster contains Kubernetes control-plane services and one or more worker node pools.
The control plane maintains the desired state of the cluster and coordinates workload scheduling. Worker nodes execute the actual containers.
Managed Control Plane
Microsoft operates the managed Kubernetes control-plane infrastructure, including the API server and core control components.
Worker Nodes
Azure virtual machines provide the compute resources on which Kubernetes pods and application containers execute.
Node Pools
Node pools group nodes with shared configurations, enabling different VM sizes and workload placement policies.
Kubernetes Objects
Deployments, Pods, Services, ConfigMaps, Secrets, and other objects define the applications and their requirements.
Inside the AKS AI Cluster
The following architecture illustrates the logical relationship between the managed control plane, system node pool, CPU application workloads, and GPU inference nodes.
Kubernetes control-plane components schedule and reconcile workloads. They do not execute model inference. Inference runs inside application containers on worker nodes.
How Kubernetes Manages AI Applications
Kubernetes uses declarative configuration to describe the desired state of applications. Controllers continuously work to reconcile the observed state with that configuration.
| Component | Primary Function | AI Engineering Relevance |
|---|---|---|
| API Server | Exposes the Kubernetes API | Receives deployment and workload configuration |
| Scheduler | Selects eligible nodes for unscheduled pods | Places GPU pods on nodes advertising suitable resources |
| Controllers | Reconcile Kubernetes resource state | Maintain desired replicas and react to failures |
| Kubelet | Manages pod execution on a node | Coordinates container lifecycle and resource reporting |
| Container Runtime | Runs application containers | Executes model-serving container images |
| CoreDNS | Provides cluster DNS resolution | Supports service discovery for inference applications |
| Device Plugin | Advertises supported accelerator resources | Enables Kubernetes to allocate GPUs to containers |
System Node Pools and User Node Pools
AKS supports system and user node pools. The distinction helps engineers separate core cluster services from application workloads.
System Node Pools
Intended for critical system pods required by the cluster. They should have adequate CPU, memory, and availability for system services.
User Node Pools
Designed for application workloads. They can use different VM sizes, including supported GPU-enabled instance families.
Production AI clusters commonly use dedicated user node pools for GPU inference so that expensive accelerator resources are reserved for workloads that actually require them.
A separate node pool does not automatically guarantee exclusive workload placement. Use appropriate taints, tolerations, node selectors, affinity rules, and admission controls where workload isolation is required.
Deployments, Pods, Services, and Configuration
AI applications are typically deployed using standard Kubernetes resources. Each resource provides a different part of the workload lifecycle.
Deployments
Manage desired replica counts, rollout strategies, and replacement of application pods.
Pods
Represent the smallest deployable Kubernetes workload units, containing one or more containers.
Services
Provide stable network access to selected pods and distribute traffic through supported service networking mechanisms.
Configuration and Secrets
Provide application configuration and references to sensitive values. Secret handling requires suitable access and protection controls.
A model-serving Deployment may specify two replicas, a GPU resource request, a container image containing the inference runtime, and a Kubernetes Service that exposes the application to authorized clients. Actual scheduling depends on available compatible nodes and accelerator resources.
Why AI Workloads Require Specialized Scheduling
Conventional web applications often scale primarily through CPU and memory allocation. AI inference workloads may additionally require specialized accelerator hardware.
| Characteristic | CPU Application | GPU Inference Application |
|---|---|---|
| Primary Compute | General-purpose processors | CPU plus supported GPU accelerators |
| Scheduling | CPU and memory requests | CPU, memory, GPU requests, and placement constraints |
| Initialization | Often relatively lightweight | May require large model downloads and GPU memory loading |
| Scaling | Additional application replicas | Replicas constrained by GPU capacity and model requirements |
| Monitoring | CPU, memory, request metrics | CPU, memory, GPU utilization, memory, and inference metrics |
Standard Kubernetes GPU allocation is generally based on advertised extended resources such as nvidia.com/gpu. Fractional sharing or GPU partitioning requires supported hardware and additional configuration; it is not implied by ordinary CPU-style requests.
From Deployment Request to Running Model Pod
When an engineer deploys an AI workload, Kubernetes processes the desired configuration and attempts to place the pod on an eligible worker node.
Submit Workload
A Deployment or Pod specification is submitted to the Kubernetes API.
Evaluate Constraints
The scheduler considers resource requests, node eligibility, taints, affinity, and other rules.
Bind Pod to Node
The scheduler selects a suitable node and records the placement.
Start Containers
The kubelet coordinates image retrieval, device allocation, container startup, and readiness reporting.
A successfully scheduled GPU pod is not necessarily ready to serve inference requests. The model may still need to download weights, initialize the runtime, allocate GPU memory, and pass readiness checks.
Investigating AKS Cluster and Workload Problems
Troubleshooting should begin by identifying whether the failure involves the control plane, node capacity, pod scheduling, container startup, or application networking.
| Symptom | Potential Cause | Investigation |
|---|---|---|
| Pod Pending | Insufficient GPU resources or incompatible placement constraints | Inspect pod events, resource requests, and node allocatable resources |
| Node NotReady | Node health, kubelet, runtime, or infrastructure problem | Inspect node conditions and available diagnostics |
| ImagePullBackOff | Image access, registry authentication, or network failure | Review image references, credentials, and pull events |
| CrashLoopBackOff | Repeated container startup failure | Inspect container logs, exit codes, and startup configuration |
| GPU Unavailable | Device plugin, driver, or node compatibility issue | Check GPU resource advertisement and node configuration |
| Inference Unreachable | Service, endpoint, ingress, or network policy problem | Validate service selectors, pod readiness, DNS, and connectivity |
A healthy Kubernetes cluster does not guarantee a healthy AI application. Cluster state, pod readiness, GPU availability, model initialization, and inference endpoint health must be evaluated separately.
Designing AKS for AI Infrastructure
Azure Kubernetes Service provides the orchestration foundation for containerized AI workloads. Its managed control plane coordinates scheduling and desired state, while worker node pools supply CPU and GPU compute resources.
Production AI deployments require appropriate node-pool design, resource requests, workload placement, application readiness, and infrastructure observability.
AKS separates Kubernetes orchestration from workload execution. The control plane schedules and manages workloads; CPU and GPU worker nodes run application containers. Reliable AI inference depends on correct resource allocation, scheduling constraints, node-pool architecture, and model-serving readiness.
AKS AI Cluster Architecture Explorer
Explore the managed Kubernetes control plane, node pools, worker nodes, pods and Services. Deploy a simulated AI inference workload and observe Kubernetes reconciliation after node failure.
Azure AKS Cluster Architecture
Cluster Reconciliation Events
Workload Deployment Configuration
Each replica represents a separate Kubernetes pod. The simplified GPU node can host up to two example AI pods.
Cluster State
Architecture Component Inspector
Click the API server, scheduler, controller or node pool to inspect its responsibilities.
Engineering Assessment
Deploy an AI workload to observe desired and actual state.
GPU Infrastructure and Scheduling on Azure AKS
GPU-enabled Kubernetes clusters require specialized node pools, device discovery, resource allocation, and workload placement controls.
Azure Kubernetes Service allows engineers to deploy supported GPU-enabled Azure virtual machines as worker nodes. Kubernetes can then schedule AI workloads according to advertised accelerator resources and placement constraints.
Reliable GPU scheduling depends on understanding how Kubernetes represents GPU capacity, how the scheduler evaluates node eligibility, and how GPU devices become available to containers.
Understanding GPU-Enabled AKS Node Pools
AKS node pools can use supported GPU-enabled Azure virtual machine sizes. These nodes provide accelerator hardware for machine learning and inference workloads.
The GPU node pool operates within the Kubernetes cluster but may have different VM sizes, operating system requirements, drivers, and scheduling policies from CPU node pools.
GPU Virtual Machines
Azure GPU VM families provide supported accelerator hardware, CPU resources, system memory, and network connectivity.
GPU Node Pools
Dedicated node pools group GPU-enabled worker nodes with compatible infrastructure and configuration.
GPU Device Plugins
Supported device plugins advertise GPU resources to Kubernetes and participate in device allocation for containers.
Model Serving Containers
AI inference containers use assigned GPU devices to execute supported model runtimes and workloads.
How Kubernetes Places AI Pods on GPU Nodes
When an AI workload requests a GPU, the Kubernetes scheduler evaluates nodes that advertise the required accelerator resources.
The scheduler also evaluates CPU and memory availability, node selectors, affinity rules, taints, tolerations, and other placement constraints.
2 GPUs Allocated
2 GPUs Available
4 GPUs Allocated
0 GPUs Available
Node Taint
Pod Not Eligible
Kubernetes does not simply select the node with the lowest GPU utilization. Scheduling is based on advertised allocatable resources, existing requests, and placement constraints. Runtime GPU utilization is a separate performance metric.
Understanding NVIDIA Device Plugins and Extended Resources
Kubernetes uses device plugins to expose specialized hardware resources to the cluster.
For NVIDIA GPU workloads, a compatible device plugin commonly advertises resources such as nvidia.com/gpu on worker nodes.
Device Discovery
The device plugin identifies supported GPU devices available on the worker node.
Resource Advertisement
GPU capacity is exposed through Kubernetes extended resources that the scheduler can evaluate.
Device Allocation
During container startup, the device plugin participates in allocating devices to requesting containers.
Runtime Compatibility
GPU drivers, container runtime integration, and model-serving software must be compatible.
Installing GPU hardware alone does not guarantee that Kubernetes can schedule GPU workloads. Compatible drivers, device plugins, and runtime configuration must be available and healthy.
Declaring Accelerator Requirements in Kubernetes
GPU workloads declare their accelerator requirements using Kubernetes container resource specifications.
A common configuration requests one NVIDIA GPU using the nvidia.com/gpu extended resource.
This example requests one advertised NVIDIA GPU for the model-serving container. The image is illustrative and must be replaced with a real compatible image.
GPU extended resources are integer-valued in standard Kubernetes scheduling. GPU limits must be declared for device allocation; specifying matching requests and limits is valid. Ordinary fractional GPU requests are not supported without a specialized sharing or partitioning mechanism.
Taints, Tolerations, Node Selectors, and Affinity
GPU infrastructure is often significantly more expensive than CPU-only infrastructure. Engineers therefore use scheduling constraints to guide workloads toward appropriate node pools.
| Mechanism | Purpose | GPU Engineering Example |
|---|---|---|
| Node Selector | Require matching node labels | Target nodes labeled for GPU inference |
| Node Affinity | Define required or preferred placement rules | Prefer a supported GPU node family |
| Node Taint | Repel pods without matching tolerations | Reserve GPU nodes from general workloads |
| Pod Toleration | Allow a pod to run on a matching tainted node | Permit approved inference workloads |
| Pod Affinity | Influence placement relative to other pods | Co-locate related components where appropriate |
| Topology Spread | Distribute pods across supported topology domains | Reduce concentration of inference replicas |
A toleration permits a pod to be scheduled onto a matching tainted node, but it does not require that placement. Use node selectors or required node affinity when a workload must target a particular GPU node pool.
Dedicated GPUs, Partitioning, and Sharing
Different AI workloads require different levels of GPU capacity. Some models need dedicated accelerators, while smaller workloads may benefit from supported sharing or partitioning technologies.
Dedicated GPU Allocation
A container receives access to one or more allocated GPU devices. This provides straightforward resource accounting and isolation at the Kubernetes allocation level.
Multi-Instance GPU
On supported NVIDIA hardware, MIG can partition a physical GPU into smaller instances with defined hardware resources.
Time-Slicing
Supported configurations can allow multiple workloads to share GPU execution time. Isolation and performance characteristics differ from MIG.
Multi-GPU Workloads
Large models may require multiple accelerators and model-serving runtimes that support tensor or pipeline parallelism.
GPU partitioning and sharing depend on the specific accelerator, device plugin, driver stack, and supported AKS configuration. Not every Azure GPU VM supports every allocation strategy.
Why GPU Pods Remain Pending
A GPU pod may remain Pending when Kubernetes cannot identify an eligible node that satisfies its resource and placement requirements.
| Failure | Potential Cause | Investigation |
|---|---|---|
| Insufficient nvidia.com/gpu | Requested GPUs exceed available allocatable resources | Inspect node capacity, allocatable resources, and existing pod requests |
| Untolerated taint | Pod lacks a required toleration | Compare node taints with pod tolerations |
| Node affinity mismatch | No node satisfies required labels or affinity | Inspect node labels and pod affinity rules |
| GPU resource not advertised | Device plugin or driver problem | Inspect device plugin health and node GPU resources |
| GPU node unavailable | Capacity, quota, or node provisioning issue | Inspect node pool state and autoscaler events |
| Insufficient CPU or memory | Other resource requests prevent scheduling | Compare pod requests with node allocatable resources |
These commands provide an initial view of node health, pod placement, scheduling events, and resource availability. Replace example pod and node names with actual cluster resources.
A Pending pod usually indicates scheduling or prerequisite problems. A scheduled pod that fails during model initialization may instead have a driver, CUDA, GPU memory, model loading, or application runtime problem.
Planning GPU Resources for AI Inference
GPU capacity planning must consider model size, accelerator memory, concurrent requests, serving runtime requirements, and operational headroom.
Model Memory
Estimate model weights, runtime buffers, KV cache, and other GPU memory requirements.
Serving Throughput
Measure supported request concurrency, token throughput, and latency under realistic workloads.
Node Capacity
Account for GPU count, CPU, system memory, network performance, and storage requirements.
Failure Headroom
Reserve sufficient capacity for node failures, rolling updates, scaling delays, and traffic variation.
A GPU that appears lightly utilized may still be unable to accept another model because its memory is already allocated. Evaluate GPU memory, compute utilization, model footprint, and scheduling resources separately.
Designing Reliable GPU Scheduling on AKS
GPU-enabled AKS clusters combine Azure accelerator infrastructure with Kubernetes scheduling and resource management.
Reliable GPU workload placement depends on compatible hardware, healthy device plugins, accurate resource requests, correct placement constraints, and sufficient cluster capacity.
Kubernetes schedules GPU workloads using advertised accelerator resources and node eligibility rules. GPU scheduling is not equivalent to measuring GPU utilization. Engineers must distinguish schedulable capacity, actual accelerator usage, GPU memory pressure, and model-serving readiness when designing and troubleshooting AKS AI infrastructure.
GPU Pod Scheduling Simulator
Configure a GPU-backed inference pod, inspect Kubernetes scheduling constraints and investigate why a workload is assigned to a GPU node or remains Pending.
GPU Pod Specification
In real Kubernetes, GPU extended resources must be advertised by the relevant device plugin or device-resource integration. The scheduler considers allocatable resources and existing requests, not live GPU utilization.
Scheduling Metrics
AKS GPU Node Pool
Scheduling Decision
Configure the pod and run the scheduler.
Per-Node Scheduling Diagnostics
Scheduling constraints will be evaluated for every node.
Kubernetes Scheduler Event Console
AI Model Serving on Azure AKS
AI model serving transforms a trained or pretrained model into an operational inference service capable of processing application requests.
On Azure Kubernetes Service, model-serving applications run inside containers deployed onto CPU or GPU worker nodes. Kubernetes manages workload placement, replication, service discovery, and application lifecycle, while the model-serving runtime handles model initialization and inference execution.
Production model serving requires coordination between container images, model artifacts, accelerator resources, networking, health probes, and application performance.
Understanding the AI Model Serving Stack
A model-serving system is more than a container exposing an HTTP endpoint. It combines model storage, runtime initialization, accelerator allocation, request processing, and operational controls.
Model Artifacts
Model weights, tokenizer files, configuration, and other assets are retrieved from a supported repository or storage location.
Serving Runtime
A model server loads the model, manages execution, and exposes supported inference APIs.
Compute Resources
CPU, memory, and optionally GPU resources provide the execution environment required by the model.
Inference Endpoint
A Kubernetes Service and optional ingress or gateway provide network access to ready model-serving pods.
Tracing an Inference Request Through AKS
The inference request path begins at the application client and passes through the configured network entry point before reaching a model-serving pod.
The Kubernetes control plane manages deployment state and pod scheduling. Normal inference requests flow through the configured application networking path to model-serving containers; they do not pass through the Kubernetes API server.
vLLM, NVIDIA Triton, and KServe
Different serving technologies address different parts of the AI inference architecture. They should not be treated as interchangeable components.
| Technology | Primary Role | Engineering Focus |
|---|---|---|
| vLLM | LLM inference engine and serving runtime | Continuous batching, KV-cache management, token generation, and supported parallelism |
| NVIDIA Triton | Multi-framework inference serving system | Model execution, scheduling, batching, backend integration, and model repositories |
| KServe | Kubernetes-native model serving orchestration | Declarative serving resources, runtime integration, deployment management, and supported traffic patterns |
| Custom Model Server | Application-specific inference service | Custom APIs, model loading, resource control, and application logic |
A deployment may use KServe to manage serving resources while using a compatible runtime to execute the actual model.
Not every model format, accelerator, or deployment pattern is supported by every serving runtime. Verify model architecture, hardware requirements, container compatibility, and runtime capabilities before selecting a platform.
From Container Startup to Ready Inference Endpoint
Model-serving containers may require substantial initialization time before they can accept production traffic.
Container Startup
Kubernetes starts the container after scheduling, image retrieval, and required resource allocation.
Model Retrieval
The runtime accesses model weights and configuration from local, mounted, or remote storage.
GPU Initialization
The serving runtime initializes accelerator execution, loads model parameters, and allocates required memory.
Readiness Validation
A properly configured readiness probe reports whether the application can accept inference traffic.
A pod can be Running while its model is still loading. Startup and readiness probes should reflect actual application initialization and serving readiness. Large model downloads can significantly increase deployment and scaling time.
Deploying a GPU-Backed Model Server
A basic model-serving Deployment declares the container image, resource requirements, network port, and health-check configuration.
This is an illustrative Deployment manifest. The container image, probe endpoints, model configuration, and resource values must be adapted to the actual serving runtime.
A complete production deployment also requires appropriate model storage access, identity, network controls, logging, security settings, and capacity validation. Probe endpoints such as /health and /ready are application-specific.
Exposing Model Serving Through Kubernetes Services
A Kubernetes Service provides a stable network abstraction for accessing selected model-serving pods.
The Service typically selects pods using labels and forwards traffic to eligible backend endpoints according to the cluster's service networking implementation.
ClusterIP Service
Exposes the model-serving application within the Kubernetes cluster.
LoadBalancer Service
Can provision a supported Azure load-balancing entry point for the Service.
Ingress or Gateway
Provides configurable HTTP routing and potentially TLS termination and additional traffic controls.
Private Inference Access
Uses private network exposure patterns and suitable identity and authorization controls.
A Service existing in Kubernetes does not prove that the model is available. Engineers must verify matching pod labels, ready endpoints, application listeners, network policy, and end-to-end connectivity.
Scaling, Rollouts, and Model Version Management
Production inference platforms need mechanisms for introducing new model versions without unnecessarily disrupting existing application traffic.
Rolling Deployment
Kubernetes can progressively replace old pods with new replicas according to the configured rollout strategy.
Blue-Green Deployment
Separate serving environments allow traffic to switch between validated model versions.
Canary Deployment
A subset of traffic can be directed to a new model version using suitable routing infrastructure.
Model Version Pinning
Explicit image and model versions improve reproducibility, rollback, and auditing.
Rolling updates may temporarily require additional GPU capacity to start replacement replicas. If the cluster lacks sufficient resources, new pods may remain Pending and the rollout may stall.
Investigating Failed AI Inference Deployments
Model-serving failures can occur at several layers, including scheduling, container startup, model retrieval, GPU initialization, application readiness, and network connectivity.
| Symptom | Potential Cause | Engineering Investigation |
|---|---|---|
| Pod Pending | Insufficient GPU capacity or placement mismatch | Inspect pod events, GPU requests, and node eligibility |
| ImagePullBackOff | Registry authentication, image reference, or connectivity failure | Inspect image pull events and registry access |
| Model Download Failure | Storage access, credentials, DNS, or network problem | Review model-loading logs and storage connectivity |
| GPU Out of Memory | Model or runtime memory requirements exceed available GPU memory | Inspect GPU memory metrics and runtime configuration |
| Readiness Probe Failure | Model initialization incomplete or application endpoint unavailable | Inspect probe settings, startup duration, and application logs |
| Inference Timeout | Queueing, model latency, network failure, or overloaded runtime | Correlate request traces, latency, queue depth, and network metrics |
These commands help establish whether the problem is associated with workload deployment, pod execution, container logs, or service endpoint discovery.
Investigate model-serving failures in order: scheduling, container startup, model loading, readiness, service routing, and inference performance. A Kubernetes Running state alone is not proof of a healthy inference service.
Building Reliable Model Serving on AKS
AI model serving on AKS combines Kubernetes orchestration with specialized inference runtimes and GPU compute infrastructure.
Kubernetes provides deployment management, scheduling, and service networking, while model-serving software handles model initialization, request execution, batching, and output generation.
A production inference endpoint depends on more than a Running Kubernetes pod. Reliable model serving requires compatible runtime software, available accelerator resources, successful model initialization, accurate readiness checks, correct service networking, and sufficient capacity for scaling and rollouts.
Model Serving Deployment Lab
Deploy a simulated AI model server on AKS, follow model initialization and readiness checks, inject startup failures, and test rolling deployment behavior.
Model Serving Configuration
The GPU memory setting represents an illustrative per-replica available memory budget. Real model footprints depend on precision, quantization, runtime, KV cache and deployment configuration.
Serving State
Model Serving Deployment Pipeline
Deployment Assessment
Configure a model server and begin the deployment.
Serving Runtime Event Trace
Kubernetes Networking for AI on Azure AKS
AI inference services depend on reliable network connectivity between applications, gateways, Kubernetes Services, and GPU-backed model-serving pods.
Azure Kubernetes Service integrates Kubernetes networking with Azure virtual networks, IP addressing, load balancing, DNS, and network security controls.
For AI infrastructure engineers, understanding the complete inference packet journey is essential for diagnosing connectivity failures, latency, and production application availability.
Understanding the AKS Networking Stack
Kubernetes networking provides communication between pods, nodes, Services, and external applications. AKS connects these abstractions to Azure networking infrastructure.
Azure Virtual Network
Provides the underlying Azure network environment for AKS nodes and supported pod networking configurations.
Pod Networking
Assigns network identities to pods and enables communication according to the configured CNI mode.
Kubernetes Services
Provide stable network destinations for dynamically changing sets of application pods.
Ingress and Gateways
Route application traffic to backend Services using configured HTTP routing policies.
Inside the AKS AI Inference Data Plane
The following diagram illustrates a representative request path through an AKS-hosted model-serving application.
The Kubernetes API server is not normally in the inference packet path. Kubernetes controllers maintain Service and endpoint state, while the configured networking implementation forwards application traffic.
Azure CNI Overlay and Pod Networking
Azure CNI provides networking integration for AKS pods and nodes. Different networking modes have different IP addressing and routing characteristics.
| Networking Model | Pod Addressing | Engineering Consideration |
|---|---|---|
| Azure CNI Overlay | Pod IPs come from a separate overlay address space | Pod-to-external connectivity uses the configured overlay and translation mechanisms |
| Azure CNI Pod Subnet | Pod IPs are allocated from Azure VNet subnet space | Requires suitable subnet and IP capacity planning |
| Azure CNI Powered by Cilium | Supports documented Azure CNI networking configurations | Uses an eBPF-based data plane for supported networking and policy functions |
Overlay networking can reduce consumption of directly allocated VNet pod addresses, while VNet-addressed pods may simplify certain direct connectivity patterns. These are architectural tradeoffs, not universal performance rankings.
Azure CNI Powered by Cilium describes a data-plane technology, not a universally separate pod-addressing model. Supported combinations, restrictions, and migration paths depend on the AKS configuration and version.
Service Discovery and Inference Endpoint Routing
Kubernetes Services decouple application clients from individual pod addresses. As inference pods restart, scale, or move between nodes, Services provide a stable logical destination.
ClusterIP
Internal virtual Service address used by applications inside the cluster.
LoadBalancer
Requests a supported cloud load balancer for Service exposure.
EndpointSlices
Represent the backend endpoints associated with Kubernetes Services.
Service DNS
Allows clients to resolve Kubernetes Service names through cluster DNS.
Readiness conditions influence whether pod endpoints are considered available for normal Service traffic. A Service can exist without having usable ready backends.
Exposing AI Inference APIs
Inference services may be exposed internally or externally depending on application requirements. Common architectures use an ingress controller or Gateway API implementation to route HTTP requests.
Azure Load Balancer
Provides supported Layer 4 load-balancing capabilities for Kubernetes Service exposure.
Ingress Controller
Implements HTTP routing rules and potentially TLS termination, depending on the controller.
Application Gateway
Can provide Layer 7 application routing and additional gateway features through supported integration.
Private Endpoint Exposure
Private ingress or internal load-balancing patterns restrict network exposure to approved connectivity paths.
Long-running inference requests and streaming token responses require compatible proxy timeout, buffering, and connection-handling settings. Defaults designed for ordinary web requests may be unsuitable for some LLM workloads.
How AI Applications Resolve Kubernetes Services
Kubernetes commonly uses CoreDNS for internal Service name resolution.
An application can connect to a model-serving Service using a DNS name such as model-server.ai.svc.cluster.local, assuming the Service exists in the ai namespace and the cluster uses the default DNS domain.
Engineers should distinguish failures in DNS resolution from failures in routing, transport connectivity, and application readiness.
A DNS lookup failure may involve CoreDNS availability, incorrect Service names, namespace configuration, DNS forwarding, or network restrictions. Successful DNS resolution does not prove that the inference application is reachable.
Securing the AI Inference Data Plane
AI model endpoints may process sensitive enterprise information. Their network exposure should therefore be deliberately controlled.
Network Policies
Define supported ingress and egress restrictions between selected workloads.
Private AKS Clusters
Restrict Kubernetes API server access through supported private connectivity patterns.
Private Inference Services
Use internal load balancers, private gateways, and appropriate network routing to avoid unnecessary public exposure.
Controlled Egress
Manage access to model repositories, registries, storage services, and external dependencies.
A private AKS control plane does not automatically make every application endpoint private. Kubernetes API access and inference API exposure are separate architectural decisions.
Investigating Failed Inference Connectivity
Troubleshooting should follow the request path from the client through DNS, gateway routing, Kubernetes Services, network policy, and the model-serving listener.
| Symptom | Potential Cause | Investigation |
|---|---|---|
| DNS lookup fails | Incorrect name, DNS service issue, or blocked DNS traffic | Inspect CoreDNS, Service names, and DNS resolution |
| Service has no ready endpoints | Label mismatch or unready model pods | Inspect Service selectors, EndpointSlices, and readiness probes |
| Connection timeout | Routing, policy, firewall, or application connectivity issue | Check network path, policies, gateway, and backend listener |
| HTTP 502 or 503 | Gateway cannot reach a healthy upstream or no usable backend | Review gateway logs, backend health, and Service endpoints |
| High inference latency | Queueing, network delay, proxy buffering, or slow model execution | Correlate network timing, gateway metrics, and model runtime telemetry |
| Model download fails | DNS, egress, authentication, or storage access problem | Inspect storage connectivity and application logs |
Verify the destination name, confirm Service existence, inspect ready backend endpoints, validate gateway routing, review network policies, and finally test the model application's listening port and inference response.
Designing Reliable AKS Networking for AI
Kubernetes networking connects enterprise applications to model-serving workloads through a combination of Azure networking, pod addressing, Services, ingress or gateways, and application endpoints.
Successful inference requires more than an assigned pod IP. Engineers must verify DNS resolution, ready endpoints, traffic forwarding, security policies, and application availability.
AKS AI networking is a layered data-plane architecture. The Kubernetes control plane maintains resource state, while the configured network data plane forwards inference traffic. Reliable production AI services depend on correct addressing, Service discovery, ingress routing, network security, and end-to-end performance visibility.
AKS AI Packet Journey Simulator
Trace an AI inference request across Azure ingress, Kubernetes Services, Azure CNI pod networking and a GPU model server. Investigate DNS, policy, endpoint and return-path failures.
AKS Inference Network Topology
Packet trace not started.
Network Trace Metrics
Packet and Protocol Inspector
Run a request to inspect each logical network stage.
Network Engineering Event Console
Network Architecture Configuration
Azure CNI Overlay uses pod addresses from an overlay CIDR. Azure CNI Pod Subnet assigns pod IPs from an Azure VNet subnet. Actual routing and enforcement depend on the AKS configuration.
Network Investigation Result
Configure the environment and trace an inference request.
Engineering Investigation
Use the trace to determine which layer owns the failure:
DNS: Does the client resolve the correct endpoint?
Ingress: Does the HTTP route select the correct backend?
Service: Are eligible Ready endpoints available?
Pod Network: Can traffic reach the destination pod?
Policy: Is the connection permitted?
Response: Can the request complete successfully?
GPU Autoscaling and Capacity Management on Azure AKS
AI inference workloads require scaling strategies that account for accelerator capacity, model initialization time, request concurrency, and inference performance.
Azure Kubernetes Service supports Kubernetes autoscaling mechanisms that can adjust application replicas and worker node capacity.
GPU-backed inference introduces additional constraints because new model-serving replicas may require expensive accelerators, substantial memory, and significant initialization time before becoming ready.
Understanding Pod Scaling and Node Scaling
Kubernetes scaling occurs at multiple layers. Application replicas can increase or decrease, while worker node pools provide the compute capacity required to run those replicas.
Horizontal Pod Autoscaler
HPA adjusts supported workload replica counts based on configured resource, custom, or external metrics.
KEDA
Kubernetes Event-Driven Autoscaling supports scaling based on configured event sources and external signals.
Cluster Autoscaler
Adjusts supported node-pool capacity when scheduling demand requires additional nodes or when nodes can be removed safely.
GPU Capacity Management
Ensures that GPU node pools have sufficient accelerator resources for model-serving replicas.
HPA and KEDA primarily influence workload replicas, while Cluster Autoscaler manages node capacity. Increasing the replica count does not guarantee that additional GPU nodes are immediately available.
From Inference Demand to GPU Node Provisioning
A typical scaling sequence begins when an inference metric indicates that additional serving capacity is needed.
A configured pod autoscaler increases desired replicas. If existing nodes lack sufficient schedulable resources, new pods remain Pending and may trigger Cluster Autoscaler activity.
GPU Allocated
Serving Traffic
GPU Allocated
Serving Traffic
Provisioning
Model Starting
New GPU nodes may require VM provisioning, operating system startup, node registration, driver initialization, image retrieval, model loading, and readiness validation. These delays must be included in capacity planning.
Scaling Model-Serving Replicas with HPA
The Horizontal Pod Autoscaler adjusts the replica count of supported Kubernetes workloads according to configured metrics.
HPA commonly uses CPU or memory utilization, but custom and external metrics can be more representative of inference workload demand.
CPU Utilization
Useful for CPU-bound inference components and preprocessing services.
Request Rate
Can indicate incoming inference demand when exposed through a suitable metrics adapter.
Queue Depth
Measures waiting requests and can provide a useful signal for overloaded model-serving systems.
Custom Inference Metrics
Runtime-specific metrics may include concurrency, active requests, or token processing indicators.
This example scales a Deployment using CPU utilization. It is illustrative and may not represent the best scaling signal for GPU-bound inference workloads.
CPU utilization does not directly measure GPU saturation. For GPU-backed model serving, consider workload-specific metrics such as queue depth, request concurrency, and supported runtime performance indicators.
Event-Driven Scaling for AI Inference
KEDA extends Kubernetes scaling by integrating event sources and external metrics.
This can be useful for AI workloads driven by queues, message brokers, or other measurable sources of work.
Queue-Based Scaling
Adjust replicas according to the number of waiting inference jobs.
External Metrics
Integrate supported metrics from monitoring or application systems.
Scale-to-Zero
Supported workloads can scale down to zero replicas when the configuration and application pattern permit it.
Inference Queue Management
Queue-aware scaling can help align model-serving capacity with asynchronous inference demand.
Scaling GPU inference to zero can reduce idle resource costs, but the next request may experience a substantial cold start. This is particularly important for large language models.
Provisioning Additional GPU Worker Nodes
Cluster Autoscaler evaluates unschedulable pods and determines whether supported node pools can provide the required additional capacity.
In AKS, this can result in node-pool scaling when the required VM capacity is available and the autoscaler configuration permits expansion.
Unschedulable Pods
Pending pods may indicate insufficient CPU, memory, GPU, or suitable node capacity.
Node Pool Limits
Minimum and maximum node counts constrain autoscaler behavior.
Azure VM Capacity
New nodes depend on available compatible Azure VM capacity, quotas, and infrastructure constraints.
Scale-Down Decisions
The autoscaler evaluates whether nodes can be removed without violating relevant scheduling and disruption constraints.
Cluster Autoscaler responds to pod scheduling requirements, not directly to GPU utilization percentages. A highly utilized GPU does not automatically cause node scaling unless workload scheduling demand requires it.
Why AI Scaling Can Be Slow
GPU inference scaling may involve several sequential initialization stages before a new replica becomes available.
Node Provisioning
Azure provisions the GPU VM and the node joins the Kubernetes cluster.
Container Startup
Kubernetes retrieves the container image and initializes the application runtime.
Model Loading
Model weights are retrieved, validated, and loaded into the required memory resources.
Readiness Validation
The application becomes eligible for inference traffic after successful readiness checks.
Autoscaling decisions may occur faster than new GPU inference capacity can become ready. Production systems should account for this delay through suitable headroom, queueing, or other capacity management strategies.
Estimating Inference Capacity and Headroom
GPU capacity planning must account for both Kubernetes resource allocation and the actual performance of the inference runtime.
| Capacity Factor | Engineering Question | Operational Impact |
|---|---|---|
| GPU Count | How many accelerators are available per node? | Limits schedulable GPU-backed replicas |
| GPU Memory | How much memory does the model and runtime require? | Determines whether the model fits and supports target concurrency |
| Model Load Time | How long before a new replica becomes ready? | Influences scaling responsiveness |
| Request Concurrency | How many requests can a replica process effectively? | Influences queueing and response latency |
| Token Throughput | How many tokens can the runtime generate under load? | Influences LLM serving capacity |
| Failure Headroom | Can remaining nodes absorb traffic after a failure? | Influences availability and resilience |
GPU utilization, GPU memory consumption, Kubernetes GPU requests, and inference throughput represent different measurements. Reliable capacity planning requires evaluating them together.
Investigating GPU Autoscaling Failures
Scaling failures can occur when autoscaling metrics, Kubernetes scheduling, Azure infrastructure, or model initialization do not behave as expected.
| Symptom | Potential Cause | Investigation |
|---|---|---|
| HPA does not scale | Metrics unavailable, unsuitable target, or replica limits | Inspect HPA conditions and metrics adapter |
| Pods remain Pending | Insufficient GPU resources or scheduling constraints | Inspect pod events, GPU requests, and node eligibility |
| GPU nodes not added | Node-pool limits, quota, Azure capacity, or autoscaler restrictions | Inspect autoscaler diagnostics and node-pool configuration |
| New replicas start slowly | Image retrieval, model download, or GPU initialization delay | Measure startup stages and application readiness |
| High latency after scaling | Insufficient ready capacity or overloaded model runtime | Correlate request queues, replica readiness, and runtime metrics |
| Scale-down blocked | Disruption constraints or pods that cannot be safely relocated | Inspect node utilization, pod placement, and disruption policies |
These commands provide initial visibility into autoscaler decisions, pod scheduling, node availability, and Kubernetes events.
First verify the scaling metric, then the desired replica count, pod scheduling, node-pool capacity, model initialization, and application readiness. This separates autoscaling policy failures from infrastructure and model-serving problems.
Designing Reliable GPU Autoscaling on AKS
GPU autoscaling combines workload demand measurement, Kubernetes replica management, node provisioning, and model-serving readiness.
Effective scaling strategies must account for accelerator resource limits, Azure infrastructure availability, model cold starts, and inference performance targets.
HPA and KEDA influence application replica counts, while Cluster Autoscaler manages supported node-pool capacity. Reliable GPU inference scaling requires suitable demand metrics, schedulable accelerator resources, available Azure GPU capacity, sufficient warm serving headroom, and accurate readiness validation.
GPU Scaling and Capacity Planner
Model inference demand, pod autoscaling, GPU node provisioning and cold-start delays. Investigate the gap between desired replicas and usable serving capacity.
Scaling Configuration
Each synthetic GPU node hosts two model-serving pods. HPA and KEDA represent simplified scaling policies, not actual Kubernetes controller implementations.
Cluster Capacity Metrics
GPU Node Pool Capacity
Inference Demand vs Serving Capacity
One Ready pod is serving the baseline workload.
Scaling Assessment
Evaluate the autoscaling policy or inject a demand spike.
Autoscaling Event Timeline
AI Inference Performance Engineering on Azure AKS
High-performance AI inference requires careful management of GPU execution, memory allocation, request scheduling, batching, and response latency.
For large language models, performance depends on more than raw GPU compute capacity. Prompt length, generated token count, KV-cache utilization, concurrency, and serving runtime configuration all influence application behavior.
Azure Kubernetes Service provides the orchestration infrastructure, while inference runtimes such as vLLM and other compatible serving engines manage model execution and request-level optimization.
Understanding the LLM Inference Lifecycle
A large language model request typically passes through tokenization, prompt processing, autoregressive token generation, and response delivery.
Request Admission
The model server receives the request, validates supported parameters, and places work into its execution pipeline.
Prefill
The runtime processes input tokens and builds attention state required for subsequent generation.
Decode
The model generates output tokens autoregressively, using cached attention state where supported.
Response Delivery
Generated output is returned to the client, potentially using token streaming.
Inside GPU-Accelerated LLM Execution
The following diagram illustrates a conceptual inference pipeline within a GPU-backed model-serving pod.
Kubernetes schedules the model-serving pod onto suitable infrastructure. The inference runtime schedules model execution and manages token generation within the allocated compute resources.
TTFT, Inter-Token Latency, and End-to-End Response Time
LLM inference latency is commonly evaluated using several distinct measurements.
| Metric | Meaning | Engineering Relevance |
|---|---|---|
| Time to First Token | Elapsed time until the first generated token becomes available to the client | Influenced by queueing, prompt processing, runtime scheduling, and network delivery |
| Time Per Output Token | Average generation time per output token under a defined measurement method | Useful for evaluating decode performance |
| Inter-Token Latency | Time between successive streamed tokens | Influences perceived streaming responsiveness |
| End-to-End Latency | Total elapsed time from request initiation to completion | Represents overall application response time |
| Queueing Delay | Time waiting before execution or admission | Can increase sharply under overload |
Latency metrics must be interpreted according to their measurement boundaries. Client-observed TTFT may include network and proxy delays that are absent from server-side measurements.
Why Prompt Processing and Token Generation Behave Differently
Prefill and decode place different demands on GPU compute and memory resources.
Prefill Phase
Processes the input context and computes attention state. Large prompts can increase prefill work and delay the first token.
Decode Phase
Generates tokens sequentially. Runtime efficiency, memory bandwidth, batching, and cache access influence decode performance.
Some serving systems support specialized scheduling techniques such as chunked prefill or disaggregated prefill and decode. Their availability and operational requirements depend on the runtime.
Optimizing prefill performance may improve first-token latency, while optimizing decode execution may improve sustained token generation. The appropriate balance depends on prompt lengths, output lengths, concurrency, and service objectives.
Improving GPU Utilization Through Request Scheduling
Continuous batching allows compatible inference runtimes to dynamically combine work from multiple requests during model execution.
Unlike static batching, which groups requests into fixed batches, continuous batching can admit and remove requests as generation progresses.
Higher Throughput
Combining compatible execution work can improve accelerator utilization and aggregate output throughput.
Dynamic Request Admission
New requests can enter execution according to runtime scheduling policies and available capacity.
Improved Resource Use
Efficient batching can reduce idle accelerator execution opportunities.
Latency Tradeoffs
Aggressive batching can increase queueing or per-request latency under some workloads.
Maximum aggregate token throughput is not always the correct production objective. Interactive applications may prioritize first-token latency and predictable response times.
Understanding GPU Memory Consumption During Generation
Transformer-based autoregressive models commonly use a key-value cache to avoid recomputing previously processed attention state during generation.
KV-cache memory consumption depends on model architecture, precision, sequence length, batch size, and active requests.
Model Weights
GPU memory required to store model parameters used during inference.
KV Cache
Memory allocated for cached attention state across active sequences.
Runtime Buffers
Additional memory used for execution, temporary tensors, and runtime operations.
Memory Headroom
Capacity reserved to accommodate runtime variation, concurrency, and operational stability.
Increasing concurrent requests or context lengths can increase KV-cache demand. GPU memory pressure may therefore limit inference concurrency even when compute utilization is not continuously saturated.
Measuring Inference Serving Capacity
Inference capacity should be measured using representative workloads rather than relying only on theoretical GPU performance.
| Metric | What It Measures | Engineering Use |
|---|---|---|
| Requests per Second | Completed inference requests per second | Measures request-level service capacity |
| Output Tokens per Second | Generated output tokens per unit time | Measures aggregate decode throughput |
| Active Requests | Requests currently being processed | Indicates concurrency and runtime load |
| Queue Depth | Requests waiting for execution | Identifies capacity pressure and overload |
| GPU Utilization | Measured accelerator activity | Helps assess compute usage |
| GPU Memory Usage | Memory consumed by model and runtime state | Helps identify memory capacity limits |
Compare inference systems using consistent prompt lengths, output lengths, concurrency, hardware, runtime versions, and latency objectives. Throughput results without workload context can be misleading.
Investigating Slow or Unstable Inference
Performance problems can originate from request queueing, runtime scheduling, GPU memory pressure, model execution, or application networking.
| Symptom | Potential Cause | Investigation |
|---|---|---|
| High TTFT | Long prompts, queueing, prefill pressure, or network delay | Measure queue time, prefill duration, and client/server timing |
| Slow Token Generation | Decode bottleneck, memory bandwidth pressure, or excessive concurrency | Inspect output token rate and runtime execution metrics |
| GPU Out of Memory | Model weights, KV cache, or runtime allocations exceed available memory | Inspect GPU memory metrics and serving configuration |
| Growing Request Queue | Arrival rate exceeds effective serving capacity | Compare incoming demand with completed throughput |
| Low GPU Utilization | Insufficient work, CPU bottleneck, data preparation, or runtime inefficiency | Correlate GPU activity with request scheduling and CPU metrics |
| Latency Spikes | Traffic bursts, batching changes, resource contention, or network issues | Correlate request traces with runtime and infrastructure telemetry |
Kubernetes resource metrics provide useful context, but detailed GPU and inference performance analysis generally requires additional accelerator and model-runtime telemetry.
Start with client-observed latency, then separate gateway and network delay from queueing, prefill, decode, and response delivery. Correlate these stages with GPU utilization, memory usage, and active request concurrency.
Optimizing AI Inference Performance on AKS
AI inference performance depends on the interaction between model architecture, runtime scheduling, GPU execution, memory management, and request concurrency.
Kubernetes provides the infrastructure foundation, while the inference runtime determines how model execution is scheduled and optimized within allocated resources.
High-performance LLM serving requires balancing time to first token, output token throughput, request concurrency, batching efficiency, and GPU memory usage. Reliable optimization depends on realistic workload benchmarking and visibility into prefill, decode, KV-cache behavior, and end-to-end request latency.
Inference Throughput and Latency Lab
Explore GPU model-serving performance through token throughput, continuous batching, KV-cache pressure, concurrency, time to first token and response latency.
Inference Runtime Configuration
All model footprints and performance values are illustrative. This lab is intended to teach the relationship between concurrency, memory pressure and token generation.
Inference Performance Metrics
Inference Execution Pipeline
GPU Memory Allocation
Run a simulation to calculate estimated memory allocation.
Performance Engineering Assessment
Configure the runtime and execute the workload.
GPU Runtime Engineering Console
AKS Security and Workload Identity for AI Infrastructure
Securing AI workloads on Azure AKS requires identity-aware access, least-privilege authorization, network segmentation, container security, and protection of model artifacts.
Enterprise AI applications frequently access Azure Key Vault, Azure Storage, Azure Container Registry, and other managed services. These connections must be authenticated and authorized without exposing long-lived credentials inside containers.
Microsoft Entra Workload ID enables supported Kubernetes workloads to authenticate using federated identity, reducing reliance on embedded application secrets.
Understanding the AKS AI Security Model
AKS security combines Azure infrastructure controls, Kubernetes security mechanisms, application identity, and model-serving protections.
Identity and Authentication
Establish trusted identities for users, services, and model-serving workloads.
Authorization
Apply least-privilege access through Azure roles, Kubernetes RBAC, and service-specific permissions.
Network Protection
Restrict inbound and outbound connectivity using supported network controls.
Workload Protection
Secure container images, pod execution, model artifacts, and runtime configuration.
How Microsoft Entra Workload ID Secures AI Pods
Microsoft Entra Workload ID uses Kubernetes service account identity and OIDC federation to enable supported workloads to obtain Azure access tokens.
Workload identity avoids storing a long-lived Azure client secret in the application container. The Kubernetes service account, federated credential, identity configuration, and Azure resource permissions must all be configured correctly.
Connecting Kubernetes Service Accounts to Azure Identities
A typical AKS Workload ID configuration associates a Kubernetes service account with an Azure identity through a federated identity credential.
This illustrative configuration assumes that AKS Workload ID is enabled, a compatible Azure identity exists, and the required federated credential has been created.
The service account annotation and pod label do not create an Azure identity or grant access by themselves. The identity must have an appropriate federated credential and the required permissions on target resources.
Azure RBAC Versus Kubernetes RBAC
AKS environments contain multiple authorization layers. Engineers must understand which system controls each operation.
| Authorization Layer | Purpose | Example |
|---|---|---|
| Azure RBAC | Controls access to Azure resources and supported AKS management operations | Permission to manage an AKS resource or read a storage account |
| Kubernetes RBAC | Controls Kubernetes API operations | Permission to list pods in a namespace |
| Azure RBAC for Kubernetes Authorization | Supports Azure role-based authorization for Kubernetes API access when configured | Assigning an AKS Kubernetes authorization role |
| Application Authorization | Controls access to inference APIs and application functions | Allowing an authenticated client to invoke a model endpoint |
Permission to deploy a Kubernetes workload does not automatically grant access to Azure Key Vault, Azure Storage, or protected inference APIs. Each authorization boundary must be configured separately.
Protecting Secrets and Application Configuration
Azure Key Vault provides managed storage for supported secrets, keys, and certificates.
AKS workloads can access Key Vault through supported identity-based application integrations or the Secrets Store CSI Driver with the Azure Key Vault provider.
Identity-Based Access
Applications authenticate using an authorized identity rather than embedding credentials.
Secrets Store CSI Driver
Supports mounting externally managed secrets into pods using a compatible provider configuration.
Secret Rotation
Rotation processes should account for application reload behavior and deployment requirements.
Access Auditing
Monitor supported authentication, authorization, and resource access events.
Mounting a secret into a container still exposes that secret to processes with access to the mounted content. Use appropriate pod security, file permissions, and identity controls.
Securing AI Model Serving Images
AI serving images may include large dependency stacks, GPU libraries, Python packages, and model-serving frameworks.
These components expand the software supply chain and require systematic vulnerability management.
Trusted Registries
Store and distribute approved images through controlled container registries.
Image Scanning
Identify known vulnerabilities in operating system packages and application dependencies.
Immutable References
Pin images by digest where appropriate to improve reproducibility.
Runtime Hardening
Apply supported security contexts, least privilege, and workload isolation controls.
Container scanning does not validate the safety or provenance of model weights. Model artifacts require their own provenance, integrity, access, and risk-management controls.
Securing Shared Accelerator Infrastructure
GPU node pools may host workloads with different operational requirements or trust levels.
Kubernetes namespaces, node pools, scheduling constraints, and pod security controls can contribute to workload separation.
Dedicated Node Pools
Separate workloads with different security or operational requirements.
Taints and Tolerations
Influence which workloads may be scheduled onto selected nodes.
Pod Security Standards
Restrict privileged operations and unsafe container configurations.
Network Segmentation
Restrict communication between workloads using supported network policy mechanisms.
Kubernetes namespaces, taints, and tolerations are not hardware security boundaries. Strong isolation requirements may call for dedicated nodes, clusters, or other supported hardware and platform protections.
Investigating Identity and Authorization Failures
Security-related application failures often appear as authentication errors, authorization denials, registry access failures, or blocked network connections.
| Symptom | Potential Cause | Investigation |
|---|---|---|
| Workload token exchange fails | Incorrect issuer, subject, audience, or identity configuration | Inspect federated credential and service account configuration |
| Azure resource returns 403 | Identity lacks required resource permission | Inspect role assignments and resource authorization settings |
| Kubernetes API returns Forbidden | Missing Kubernetes authorization | Inspect RoleBindings, ClusterRoleBindings, or configured Azure authorization |
| Key Vault access fails | Identity, permission, firewall, DNS, or private connectivity issue | Inspect authentication logs, permissions, and network access |
| ImagePullBackOff | Registry permissions, image reference, or connectivity failure | Inspect pod events and registry access |
| Inference endpoint unreachable | Gateway, firewall, network policy, or service configuration issue | Trace the application network path |
Identify the workload identity, verify service account configuration, inspect token federation, confirm resource authorization, and validate network connectivity. Authentication and authorization failures should be investigated separately.
Designing Secure Enterprise AI Infrastructure on AKS
AKS security depends on multiple coordinated controls, including identity, authorization, workload isolation, network security, supply-chain protection, and operational monitoring.
Microsoft Entra Workload ID provides a supported mechanism for federated authentication between Kubernetes workloads and Azure services, while RBAC and resource-specific permissions enforce authorization.
Secure AI infrastructure requires more than private networking or Kubernetes namespaces. Enterprise AKS deployments should combine federated workload identity, least-privilege authorization, controlled resource access, trusted container images, appropriate workload isolation, and continuous security monitoring.
AKS AI Security Boundary Lab
Investigate workload identity, Microsoft Entra token exchange, Azure resource authorization, Key Vault access, image security and Kubernetes isolation boundaries.
Security Configuration
This model distinguishes Kubernetes RBAC from Azure resource authorization. Microsoft Entra Workload ID enables token exchange, but it does not automatically grant permissions to Azure resources.
Security Evaluation Metrics
AI Workload Security Boundary
Security Decision Inspector
Run the security flow to inspect authentication, authorization and network isolation decisions.
Security Assessment
Select an incident scenario or evaluate the healthy configuration.
Security Event and Audit Console
GPU and Kubernetes Monitoring and Observability on Azure AKS
Production AI infrastructure requires visibility into Kubernetes health, GPU resource consumption, model-serving performance, request latency, and application reliability.
Azure AKS integrates with monitoring services that can collect metrics, logs, and traces from Kubernetes infrastructure and supported application components.
For GPU-backed inference, infrastructure metrics alone are insufficient. Engineers must correlate GPU telemetry with model runtime behavior, request concurrency, and end-to-end inference performance.
Understanding Metrics, Logs, and Traces
Observability combines multiple forms of telemetry to explain how a distributed application behaves.
Metrics
Numeric measurements such as CPU usage, GPU memory, request latency, and token throughput.
Logs
Event records from Kubernetes, containers, GPU components, and inference applications.
Distributed Traces
Track request execution across application, gateway, and model-serving components.
Service Objectives
Define measurable targets for availability, latency, and inference reliability.
Inside the AKS AI Monitoring Pipeline
A production observability architecture collects telemetry from infrastructure, accelerators, and model-serving applications.
Monitoring systems do not automatically expose every GPU or model-serving metric. Engineers must configure supported exporters, application instrumentation, and collection pipelines.
Azure Monitor, Prometheus, and Grafana
Azure provides managed services that can support AKS monitoring, metric collection, log analysis, and visualization.
| Service | Primary Role | AI Infrastructure Use |
|---|---|---|
| Azure Monitor | Azure monitoring platform | Metrics, alerts, diagnostic information, and operational visibility |
| Azure Monitor Managed Service for Prometheus | Managed Prometheus-compatible metrics collection and storage | Kubernetes, GPU, and inference metrics from configured targets |
| Azure Managed Grafana | Managed dashboard and visualization service | GPU dashboards, inference performance, and operational views |
| Log Analytics | Log ingestion, querying, and analysis | Container logs, Kubernetes diagnostics, and incident investigation |
| Application Insights | Application performance monitoring | Request telemetry, dependencies, traces, and application diagnostics |
Managed monitoring services require appropriate workspace, data collection, permissions, and integration configuration. Availability of specific telemetry depends on the enabled features and application instrumentation.
Monitoring NVIDIA GPU Utilization and Memory
GPU telemetry provides visibility into accelerator resource consumption and hardware behavior.
NVIDIA DCGM and compatible exporters can expose supported GPU metrics for collection by Prometheus-based monitoring systems.
GPU Utilization
Indicates measured accelerator activity over a sampling interval.
GPU Memory Usage
Shows accelerator memory consumption associated with model weights, caches, and runtime allocations.
GPU Temperature
Helps identify thermal conditions that may influence hardware behavior.
Power Consumption
Provides additional insight into accelerator activity and supported power measurements.
Kubernetes GPU resource allocation indicates which devices are assigned to workloads. GPU utilization measures observed accelerator activity. These measurements are not interchangeable.
Monitoring LLM Inference Performance
Inference runtimes may expose application-specific metrics that reveal model-serving behavior beyond infrastructure resource usage.
Time to First Token
Measures delay before the first generated token is observed at the defined measurement point.
Token Throughput
Measures generated output tokens over a defined time interval.
Request Queue Depth
Indicates inference requests waiting for available execution capacity.
Active Requests
Shows the number of requests currently being processed by the runtime.
Metric names, labels, units, and availability vary across serving runtimes and software versions. Dashboards and alerts should be validated against the actual runtime metric definitions.
Tracing an AI Inference Request Across Services
Distributed tracing helps engineers understand where time is spent across an inference request path.
A request may pass through an application frontend, API gateway, inference service, and model-serving runtime.
Client Request
Captures the beginning of an inference transaction.
Gateway Processing
Measures routing, authentication, and proxy processing where instrumented.
Inference Execution
Tracks supported application stages such as queueing, model execution, and response handling.
Response Delivery
Measures the final application response and supported streaming behavior.
Distributed tracing requires compatible instrumentation and context propagation. It does not automatically expose individual GPU kernel execution or internal model operations.
Defining Reliability Targets for AI Inference
Service-level objectives establish measurable expectations for application performance and availability.
| SLO Category | Example Indicator | Engineering Purpose |
|---|---|---|
| Availability | Percentage of eligible requests completed successfully | Measures service reliability |
| Latency | Percentage of requests completed within a defined latency threshold | Measures responsiveness |
| First-Token Performance | Percentage of streaming requests meeting a TTFT threshold | Measures interactive response quality |
| Error Rate | Failed requests divided by eligible requests | Identifies application instability |
| Capacity Health | Queue depth or saturation relative to operational thresholds | Supports proactive capacity management |
Service objectives should use clearly defined measurement windows, eligible requests, thresholds, and exclusions. GPU utilization alone is not a customer-facing reliability objective.
Investigating Missing Metrics and Inference Degradation
Observability problems can originate from collection agents, exporters, configuration, permissions, or application instrumentation.
| Symptom | Potential Cause | Investigation |
|---|---|---|
| GPU metrics missing | Exporter unavailable, unsupported GPU metric, or scrape configuration issue | Inspect DCGM exporter and Prometheus collection targets |
| Pod metrics missing | Metrics pipeline or monitoring configuration problem | Inspect monitoring agents and Kubernetes resource metrics availability |
| Inference latency rises | Queueing, GPU pressure, model execution, or network delay | Correlate request traces with runtime and GPU metrics |
| High GPU memory usage | Large model, KV cache, or runtime allocations | Inspect model memory requirements and active concurrency |
| Logs unavailable | Collection agent, permissions, or workspace configuration issue | Inspect log collection configuration and ingestion status |
| Traces incomplete | Missing instrumentation or trace context propagation | Inspect OpenTelemetry configuration and application tracing |
These commands provide Kubernetes operational context. Detailed GPU, Prometheus, and inference runtime metrics require the relevant monitoring components to be configured.
Confirm telemetry production at the source, validate collection and ingestion, inspect metric labels and queries, then correlate infrastructure and application measurements.
Building Production AI Observability on AKS
Production AI observability requires visibility across Kubernetes infrastructure, GPU accelerators, model-serving runtimes, application networking, and customer-facing inference performance.
Azure Monitor, managed Prometheus, Grafana, compatible GPU exporters, and application tracing can provide complementary views of the overall system.
Effective AKS AI observability combines Kubernetes health metrics, GPU telemetry, inference runtime performance, distributed tracing, and clearly defined service objectives. Engineers must correlate these signals to distinguish infrastructure saturation, model-serving bottlenecks, networking delays, and application reliability problems.
GPU and Kubernetes Observability Lab
Correlate GPU metrics, Kubernetes telemetry, inference latency, error rates and distributed traces to diagnose production AI workload degradation.
Observability Scenario
Metrics are synthetic and represent one inference service. A production environment would typically combine Azure Monitor, managed Prometheus, Grafana, application instrumentation and GPU exporter telemetry.
Service Level Objectives
Telemetry Sources
Azure Monitor: Cluster health, logs and alerts.
Prometheus: Scraped workload and infrastructure metrics.
GPU Exporter: Utilization and memory telemetry.
Distributed Tracing: Request-stage timing and correlation.
Grafana: Dashboards and metric visualization.
Inference Observability Dashboard
Distributed Inference Trace
Observability Investigation
Collect metrics and inspect the inference service.
Monitoring and Alert Console
Production Troubleshooting and Reliability on Azure AKS
Production AI infrastructure introduces failure modes across Kubernetes scheduling, GPU hardware, model-serving runtimes, networking, storage, and application dependencies.
A model-serving endpoint can become unavailable even when the Kubernetes cluster itself remains healthy. Pods may be running while inference requests fail because models cannot initialize, GPU memory is exhausted, or upstream services cannot reach the inference application.
Reliable troubleshooting requires engineers to identify the failing layer, correlate operational evidence, and restore service without introducing additional instability.
Understanding Where AI Infrastructure Can Fail
AKS-based AI systems contain multiple interconnected failure domains. Each domain produces different operational symptoms and requires different diagnostic techniques.
Kubernetes Scheduling
Pods may remain Pending because of GPU requests, resource constraints, node selectors, taints, or unavailable capacity.
GPU Infrastructure
GPU devices, drivers, device plugins, or accelerator memory may prevent model execution.
Model Serving
Model initialization, runtime crashes, configuration errors, or excessive concurrency can interrupt inference.
Networking and Dependencies
Service routing, DNS, ingress, network policies, storage, and identity failures can disrupt requests.
A Kubernetes Ready node does not guarantee that GPU inference is functioning. Likewise, a Running pod does not guarantee that the model has loaded successfully or that the endpoint can serve requests.
Tracing an AI Inference Failure Across AKS
A structured incident investigation follows the request path and correlates application behavior with Kubernetes and GPU state.
Avoid immediately restarting every model-serving pod or scaling the entire cluster. Uncontrolled changes can remove healthy capacity, increase model cold starts, and make the incident harder to diagnose.
Investigating Pending GPU Pods
GPU-backed pods require nodes that satisfy their resource requests and scheduling constraints.
A pod may remain Pending even when the cluster contains nodes with apparently available CPU and memory.
Insufficient GPU Resources
Existing nodes may not have enough unallocated advertised GPU resources.
Taints and Tolerations
A GPU node taint may prevent the pod from being scheduled.
Node Affinity
Required node labels or affinity rules may exclude otherwise suitable GPU nodes.
Azure Capacity Constraints
Quota, VM availability, or node-pool limits may prevent new GPU nodes from being created.
The pod description and scheduling events are especially useful for identifying FailedScheduling conditions and resource constraints.
Confirm GPU resource requests, node allocatable resources, scheduling constraints, node-pool limits, and Cluster Autoscaler activity before modifying the workload.
Diagnosing CUDA Out-of-Memory Conditions
GPU memory exhaustion is a common failure mode in large-model inference systems.
Model weights, KV-cache allocations, runtime buffers, and concurrent requests compete for available accelerator memory.
Model Too Large
The selected model may exceed available GPU memory under the configured precision and deployment strategy.
Excessive Concurrency
Too many active sequences can increase KV-cache and runtime memory requirements.
Long Context Windows
Large prompts and long generation contexts can increase attention cache consumption.
Runtime Configuration
Memory allocation policies, batching limits, and model parallelism settings affect capacity.
A CUDA out-of-memory exception indicates a failure to satisfy a GPU memory allocation. Kubernetes OOMKilled generally indicates a container process was terminated because of memory pressure enforced by the operating system or cgroup. These are different failure mechanisms and require different investigations.
Investigating Model Initialization and Runtime Crashes
A model-serving container may start successfully but fail before becoming ready for inference.
Large models introduce additional dependencies, including model artifact retrieval, GPU initialization, runtime compatibility, and memory allocation.
Model Artifact Failure
The application cannot retrieve or validate required model weights.
Driver Compatibility
GPU driver, CUDA compatibility, or runtime configuration may prevent model execution.
Readiness Failure
The model server has not satisfied the configured readiness probe.
CrashLoopBackOff
Repeated container failures can trigger Kubernetes restart backoff behavior.
Separate container startup, model download, GPU initialization, model loading, and readiness validation. This helps identify the precise stage responsible for service unavailability.
Tracing Requests Through AKS Networking
Inference request failures may originate outside the model-serving container.
Kubernetes Services, ingress controllers, application gateways, DNS, network policies, and private connectivity all influence request delivery.
Service Routing
Incorrect selectors or missing ready endpoints may prevent traffic from reaching inference pods.
DNS Resolution
DNS failures can interrupt service discovery and external dependency access.
Network Policies
Restrictive policies may block required communication between components.
Timeout Configuration
Gateway or application timeouts may be shorter than legitimate model execution times.
Increasing timeout values may reduce premature request termination, but it does not resolve overloaded inference runtimes or insufficient GPU capacity. Investigate queueing and execution latency before treating timeouts as a configuration-only problem.
Incident: Inference Latency Increases After Traffic Growth
Consider an AKS deployment running GPU-backed model-serving pods. During a period of increasing application demand, users begin reporting slow responses and intermittent request timeouts.
Initial Symptoms
Request latency increases, inference queues grow, and some requests exceed application timeout limits.
Initial Evidence
Existing inference replicas are processing requests, while additional GPU-backed pods remain Pending.
Root Cause Hypothesis
The configured GPU node pool has insufficient schedulable capacity to host the additional replicas.
Recovery Strategy
Verify autoscaler and Azure capacity, restore schedulable GPU resources, and validate model readiness before increasing served traffic.
Pending pods and high latency alone do not prove that GPU node capacity is the root cause. The investigation must confirm scheduling events, node-pool constraints, autoscaler behavior, and inference runtime metrics.
Designing Resilient AI Inference Infrastructure
Reliable AI infrastructure should tolerate individual pod failures, node disruptions, and temporary capacity constraints without causing unnecessary service outages.
| Reliability Control | Purpose | Engineering Consideration |
|---|---|---|
| Multiple Replicas | Reduce dependence on a single model-serving pod | Ensure sufficient GPU capacity for replica placement |
| Availability Zones | Improve resilience to supported zonal failures | Validate regional GPU SKU availability and topology distribution |
| Pod Disruption Budgets | Limit voluntary disruptions to supported workloads | Do not assume they prevent involuntary failures |
| Readiness Probes | Control whether a pod is eligible for Service traffic | Ensure readiness reflects actual model-serving capability |
| Startup Probes | Allow slow-starting applications additional initialization time | Account for model download and GPU initialization |
| Autoscaling | Adjust serving and infrastructure capacity | Account for GPU provisioning and model cold starts |
| Observability | Detect degradation and support incident investigation | Correlate Kubernetes, GPU, and inference metrics |
| Recovery Procedures | Provide controlled responses to known failure conditions | Test rollback, restoration, and service validation |
Multiple replicas do not provide effective resilience when all replicas depend on a single GPU node or failure domain. Design for appropriate placement, spare capacity, and recoverability within the available Azure infrastructure.
Building Reliable Production AI Systems on AKS
Production troubleshooting requires understanding the relationship between Kubernetes orchestration, GPU infrastructure, model-serving runtimes, application networking, and Azure services.
Engineers should diagnose failures through observable evidence, identify the responsible layer, and validate recovery using both infrastructure health and application-level inference performance.
Reliable AI infrastructure on Azure AKS requires more than healthy Kubernetes nodes. Production systems must maintain schedulable GPU capacity, stable model-serving runtimes, correct network connectivity, suitable scaling policies, and comprehensive observability. Structured incident investigation and tested recovery procedures are essential for dependable enterprise inference services.
AKS AI Production Incident Simulator
Investigate a production inference outage. Inspect Kubernetes evidence, identify the failure domain, apply remediation and verify that the AI service recovers.
Production Incident
Choose a failure, inspect the evidence, then select the remediation you believe will restore service. Incorrect fixes leave the incident unresolved.
Incident Response Metrics
Incident Response Procedure
1. Detect: Identify degraded inference availability.
2. Investigate: Inspect pods, events, logs and endpoints.
3. Diagnose: Select the likely failure domain.
4. Remediate: Apply a targeted configuration change.
5. Verify: Confirm Ready pods and successful requests.
Production AI Service Architecture
Kubernetes Diagnostic Inspector
Incident Investigation Result
Start an incident to begin the investigation.
Incident Event Timeline

- Azure AI Gateway Architecture - November 16, 2026
- Azure AI High-Performance Networking Explained - November 16, 2026
- Azure OpenAI Architecture Explained - November 16, 2026