
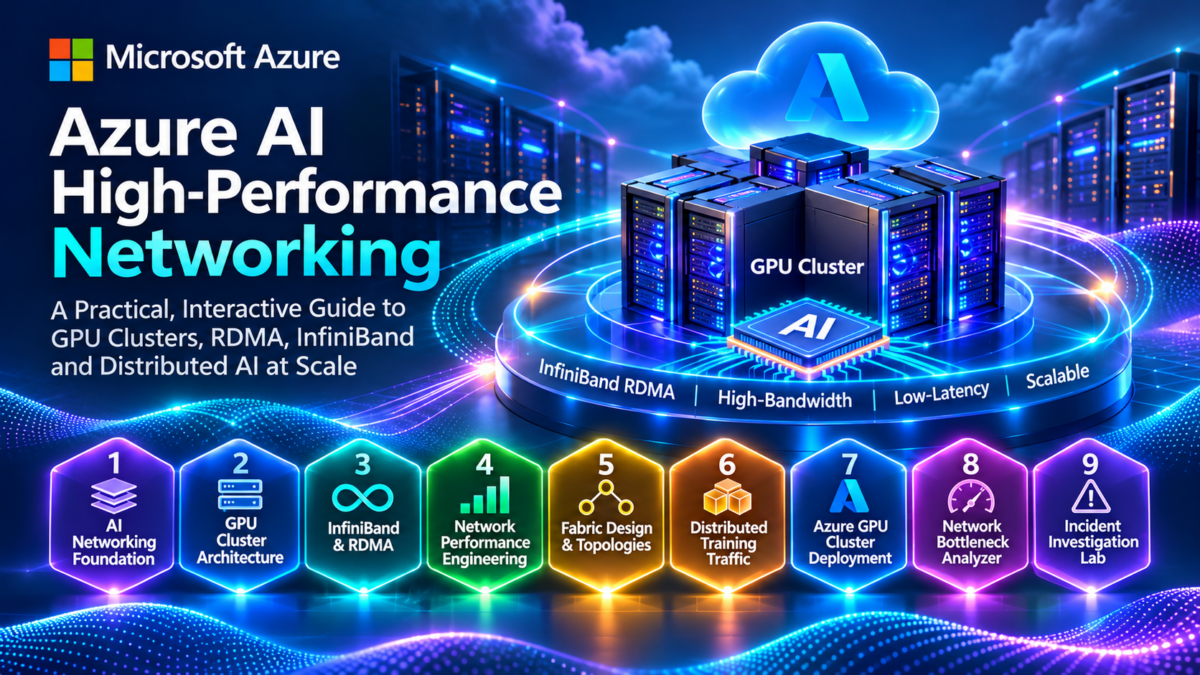
Inside an Azure AI GPU Cluster
Modern AI training systems distribute computation across multiple GPUs, servers, and network-connected compute nodes. High-performance networking allows these accelerators to exchange tensors, gradients, model parameters, and synchronization information at the scale required by demanding AI workloads.
Technologies such as Remote Direct Memory Access (RDMA), InfiniBand, and high-performance GPU collective communication libraries help reduce communication overhead and improve the efficiency of distributed training.
From Local GPU Interconnects to a Cluster-Wide Fabric
Within a GPU server, accelerators communicate through the local interconnect architecture supported by that hardware platform. Across servers, supported RDMA-capable adapters connect compute nodes to the high-performance fabric.
This visualization illustrates a logical GPU cluster rather than the physical topology of a specific Azure VM family. The number of GPUs, adapter configuration, supported local interconnects, and InfiniBand capabilities depend on the selected Azure infrastructure. Management and storage paths are shown as separate logical functions; their actual network implementation varies.
Why AI Training Depends on High-Performance Networking
Distributed training divides model computation across multiple accelerators. GPUs perform mathematical operations locally, but many training strategies require data to move between GPUs and servers.
Data-parallel workloads exchange gradient information, tensor-parallel workloads communicate intermediate tensors, and pipeline-parallel workloads pass activations between processing stages.
Bandwidth
High-bandwidth connections support large tensor transfers and communication-intensive workloads.
Latency
Low communication latency reduces overhead for synchronization and smaller distributed operations.
RDMA
RDMA-capable transports can transfer data between registered memory regions with reduced remote CPU involvement.
Collective Communication
Libraries such as NCCL coordinate communication patterns including AllReduce and AllGather.
Fabric Efficiency
Topology, available path bandwidth, congestion, and oversubscription influence communication performance.
Training Scalability
Efficient communication helps additional GPUs contribute useful computation instead of waiting on synchronization.
Understanding the Three Communication Layers
AI engineers should distinguish communication inside a GPU server, communication between servers, and the collective operations coordinated by distributed training software.
Local GPU Communication
GPUs within a server may communicate using supported high-speed local interconnect technologies, depending on the hardware architecture.
Inter-Node RDMA Networking
Supported RDMA-capable adapters and the high-performance fabric provide communication between compute nodes.
Collective Communication
NCCL and distributed training frameworks organize communication operations across participating accelerators.
AI cluster networking is not simply conventional server-to-server connectivity with faster links. It is a communication system designed to support tightly coordinated accelerator workloads, where bandwidth, latency, transport overhead, topology, and collective communication efficiency directly influence distributed training performance.
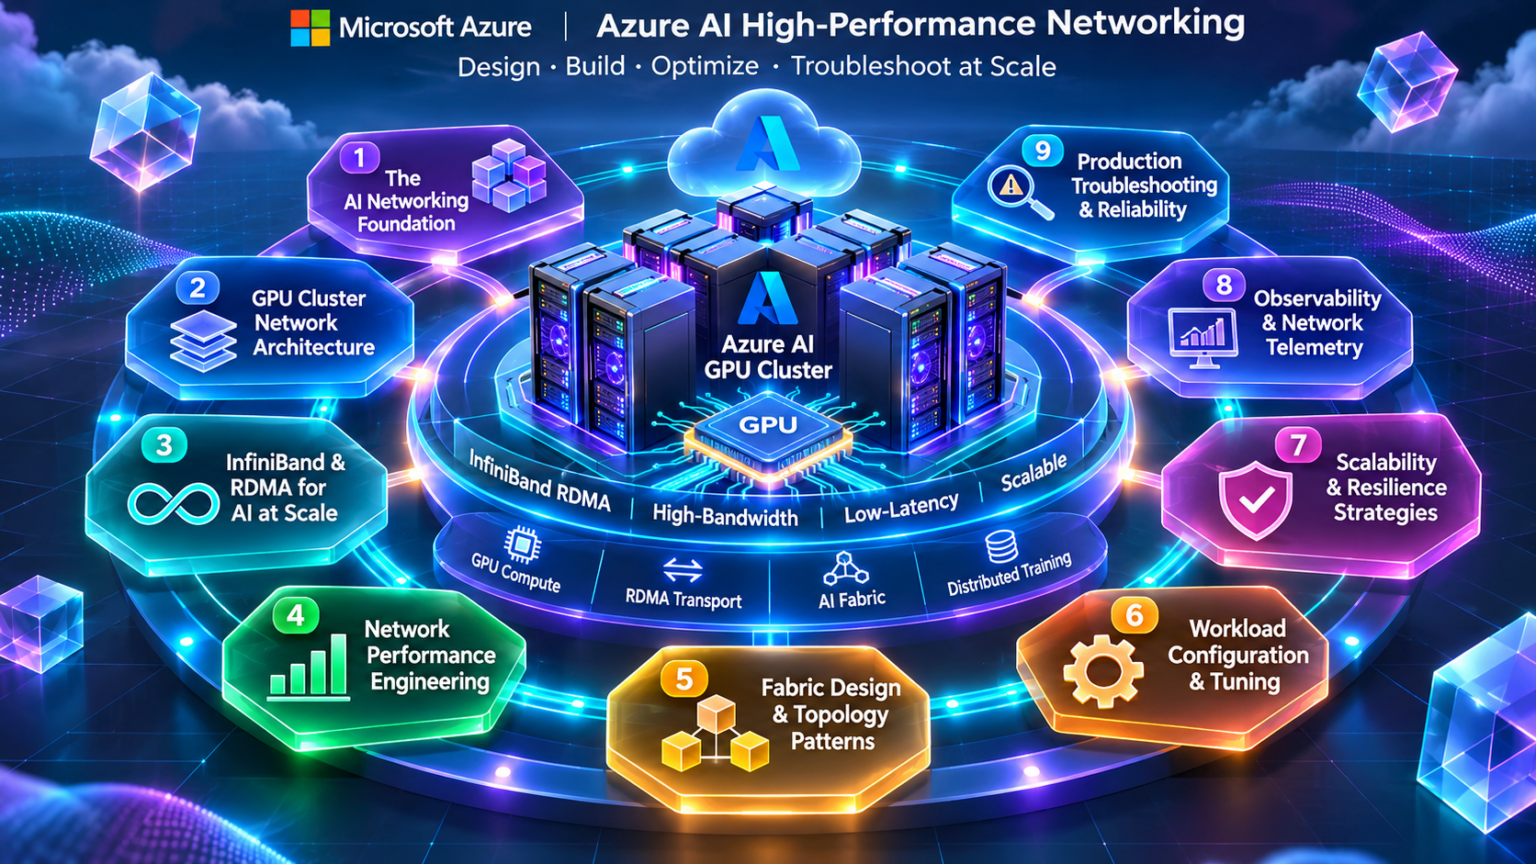
High-Performance Networking Fundamentals
Distributed AI workloads rely on high-performance networking to exchange tensors, gradients, model parameters, and synchronization information across multiple accelerators and compute nodes.
As GPU clusters scale, communication becomes a critical part of overall training performance. Engineers must understand the relationship between local GPU interconnects, RDMA-capable network adapters, fabric topology, communication libraries, and distributed training strategies.
What Is an AI High-Performance Network?
An AI high-performance network is the communication infrastructure used to connect accelerators and compute nodes running distributed machine learning workloads.
Unlike conventional application networks, these fabrics are designed to support demanding communication patterns involving large data transfers, frequent synchronization, and tightly coordinated computation.
GPU Compute Nodes
Servers containing accelerators, host CPUs, memory, local interconnects, and network adapters.
High-Performance Fabric
Network infrastructure connecting compute nodes through supported high-bandwidth, low-latency communication technologies.
RDMA Communication
Supported transports provide direct memory-oriented communication with reduced CPU and software processing overhead.
Distributed Training Software
Frameworks and collective communication libraries coordinate data exchange across participating accelerators.
How GPU Compute Nodes Connect to the Network Fabric
Each GPU compute node combines processing resources with a communication subsystem. Supported RDMA adapters connect the node to the cluster-wide fabric.
Local GPU communication and inter-node communication are separate architectural domains, although distributed training libraries coordinate both.
The network fabric does not replace local GPU interconnects. Local communication and inter-node RDMA communication operate at different physical and logical boundaries.
Understanding Scale-Up Versus Scale-Out Networking
Scale-up communication refers to communication among accelerators within a tightly coupled compute system. Scale-out communication connects multiple compute nodes through the external high-performance network.
| Characteristic | Scale-Up | Scale-Out |
|---|---|---|
| Communication Scope | Accelerators within a local system | Accelerators across compute nodes |
| Typical Interconnect | Supported local GPU interconnect | InfiniBand or other supported RDMA fabric |
| Primary Concern | Local accelerator communication efficiency | Inter-node latency, bandwidth and topology |
| Scaling Boundary | Local system architecture | Cluster fabric and available compute nodes |
| Engineering Challenge | Local contention and communication overhead | Congestion, oversubscription and synchronization |
The precise scale-up boundary can vary across accelerator platforms and rack-scale systems. Do not assume that every GPU architecture uses the same local interconnect design.
Why Network Topology Matters for Distributed AI
High-performance clusters require network topologies capable of supporting substantial communication between many compute nodes.
Leaf-spine and other multi-stage fabric designs can provide multiple communication paths and support large-scale inter-node connectivity.
Path Diversity
Multiple network paths can improve connectivity and distribute traffic when supported by fabric routing.
Bisection Bandwidth
Available bandwidth between groups of nodes influences large-scale collective communication.
Oversubscription
Insufficient upstream bandwidth can create bottlenecks when many accelerators communicate simultaneously.
Fabric routing, adapter capabilities, transport behavior, traffic placement, and collective communication algorithms also affect achievable performance.
How Distributed AI Workloads Use the Network
Different distributed training strategies generate different network traffic patterns. Network requirements depend on how model computation and state are distributed.
Data Parallelism
Workers process different data batches and synchronize gradients or related training state.
Tensor Parallelism
Model operations are distributed across accelerators, often requiring frequent exchange of intermediate tensors.
Pipeline Parallelism
Model stages exchange activations and gradient information across processing boundaries.
Expert Parallelism
Mixture-of-experts workloads may generate substantial token dispatch and exchange traffic between experts.
Understanding the Network Performance Requirements
High-performance AI networks must deliver sufficient bandwidth while minimizing communication delays that can stall distributed computation.
Bandwidth determines how quickly large transfers can complete. Latency affects the overhead of smaller transfers and synchronization operations.
Effective collective communication performance can be lower than nominal link bandwidth because of protocol overhead, topology, congestion, synchronization and workload behavior.
Why RDMA Matters for GPU Cluster Communication
Remote Direct Memory Access enables supported network adapters to transfer data between registered memory regions with reduced remote CPU involvement.
RDMA is particularly useful for high-performance workloads where repeated data movement and software processing overhead would otherwise consume significant resources.
Memory Registration
Communication buffers are registered for use by supported RDMA operations.
Adapter Processing
RDMA-capable adapters perform supported data-transfer operations without ordinary per-byte CPU copying.
Reduced Software Overhead
Kernel-bypass communication paths can reduce overhead compared with conventional socket-based transfers.
GPU Memory Access
Supported GPUDirect RDMA configurations allow compatible adapters to exchange data with GPU memory more directly.
Where AI Cluster Networking Becomes a Bottleneck
Adding more GPUs does not guarantee proportional increases in training performance. Communication overhead can grow as workloads scale.
Engineers must investigate whether computation is delayed by insufficient network bandwidth, congestion, synchronization, or inefficient communication patterns.
| Bottleneck | Potential Symptom | Engineering Investigation |
|---|---|---|
| Bandwidth Saturation | Large transfers take longer | Measure effective throughput and link utilization |
| Network Congestion | Variable communication latency | Inspect fabric counters and congestion indicators |
| Oversubscription | Cross-fabric performance degradation | Compare offered traffic with available path bandwidth |
| Synchronization Delays | GPUs waiting for collective completion | Profile collective operations and worker timing |
| Adapter or Link Problems | Reduced throughput or communication failures | Inspect supported RDMA and fabric diagnostics |
Low GPU utilization can result from networking delays, but also from storage, data loading, CPU processing, or application scheduling. Correlate network telemetry with workload profiling before identifying a cause.
Understanding the Foundations of AI Cluster Networking
High-performance networking is a foundational component of distributed AI infrastructure.
GPU nodes depend on local interconnects for communication within a compute system and supported high-performance fabrics for communication between nodes.
RDMA, network topology, bandwidth, latency, collective communication libraries, and workload placement all influence distributed training performance.
Designing a high-performance AI network requires understanding both the physical communication fabric and the distributed workloads running across it. Efficient GPU scaling depends on matching accelerator communication patterns with appropriate interconnects, sufficient bandwidth, low latency, effective fabric routing, and reliable RDMA communication.
Explore the Azure AI High-Performance Network
Nine engineering layers. One connected GPU architecture. Explore RDMA, InfiniBand, RoCEv2, NCCL, distributed training, Azure infrastructure, performance engineering and production reliability. Select any architecture node to navigate directly to its section.
GPU Cluster Network Architecture Explorer
Design a conceptual GPU cluster and explore the relationship between GPU scale-up links, RDMA-capable adapters, scale-out network fabrics and distributed AI communication demand.
GPU Cluster Design
InfiniBand is documented for supported Azure high-performance GPU configurations. RoCEv2 is included as a separate Ethernet networking architecture comparison, not as an interchangeable fabric option on every Azure GPU VM.
Cluster Engineering Metrics
3D-Inspired GPU Cluster Fabric
GPU scale-up links operate within compute nodes. The scale-out fabric carries communication between nodes.
Network Capacity Assessment
Build the cluster and evaluate communication demand.
Engineering Event Console
RDMA Architecture and Memory Communication
Remote Direct Memory Access (RDMA) enables supported network adapters to transfer data between registered memory regions with reduced CPU involvement and software processing overhead.
RDMA is a foundational communication capability in many high-performance computing and distributed AI environments. Understanding its architecture requires examining memory registration, queue pairs, work requests, completion queues, transport semantics, and adapter-level data movement.
What Is Remote Direct Memory Access?
RDMA allows a suitably configured network adapter to read from or write to registered memory on a remote system, subject to the permissions and transport capabilities established by the communicating applications.
Unlike a conventional communication path that may involve repeated kernel networking operations and CPU-mediated copying, RDMA can use user-space interfaces and adapter-managed data transfers.
Reduced CPU Overhead
Supported RDMA operations reduce the need for CPUs to process every byte transferred.
Kernel Bypass
After setup, supported communication operations can use user-space queue interfaces without ordinary kernel networking processing on each transfer.
Registered Memory
Buffers are registered with appropriate access permissions for adapter operations.
Adapter-Managed Transfers
RDMA-capable network adapters execute supported memory communication operations.
RDMA describes a communication capability. InfiniBand and RoCE are different technologies that can provide RDMA transport. Their underlying network requirements and operational behavior differ.
How Registered Memory Moves Between Compute Nodes
An RDMA application prepares communication resources and registered buffers before posting operations to its queue pair.
The adapter processes supported work requests and communicates with the remote adapter over the configured transport.
The receive queue illustrated on Node B is not consumed by a standard one-sided RDMA Write. Receive work requests are used for appropriate two-sided operations, such as Send/Receive. The remote completion queue is shown as part of the host's RDMA resources, not as an automatic completion of this Write.
Why RDMA Requires Registered Memory
RDMA-capable adapters require access to memory regions that have been registered for supported DMA operations.
Memory registration establishes information the adapter needs to access the buffer and applies permissions to the memory region.
Memory Region
A registered memory region represents a buffer accessible to supported adapter operations.
Local Key (lkey)
Used to validate local memory access for work requests involving a registered buffer.
Remote Key (rkey)
Authorizes permitted remote access to a registered region when the relevant transport operation supports it.
Remote access requires the correct addressing and access information, including an appropriate remote key. Applications must protect this information and manage memory-region lifetimes carefully.
Understanding RDMA Queue Pair Architecture
A queue pair (QP) is a fundamental RDMA communication resource containing a send queue and a receive queue.
Applications post work requests to supported queues. The adapter processes these requests according to the queue pair's transport type and state.
| RDMA Component | Purpose | Engineering Consideration |
|---|---|---|
| Queue Pair | Contains send and receive work queues | Transport type and QP state govern operations |
| Send Queue | Accepts supported outbound work requests | Includes Send, RDMA Read and Write where supported |
| Receive Queue | Holds receive buffers for applicable inbound messages | Used by two-sided Send/Receive semantics |
| Completion Queue | Reports work completions | Applications poll or use supported event notification |
| Protection Domain | Associates compatible RDMA resources | Supports resource isolation and access control |
RDMA operation support depends on transport type and adapter capabilities. For example, reliable connected transport supports capabilities that may not be available with unreliable datagram transport.
How Applications Know an RDMA Operation Has Completed
RDMA operations are generally asynchronous. Applications post work requests and later inspect completion information.
Completion queues contain completion entries describing completed operations and their status.
A successful RDMA operation completion indicates transport-level completion under the applicable semantics. It does not necessarily mean that the remote application has inspected or acted on the transferred data.
RDMA Read, RDMA Write and Send/Receive
RDMA transports provide several communication operations with different initiator and receiver responsibilities.
| Operation | Behavior | Typical Requirement |
|---|---|---|
| RDMA Write | Initiator writes into authorized remote memory | Remote address, rkey and suitable permissions |
| RDMA Read | Initiator reads from authorized remote memory | Remote address, rkey and remote-read permission |
| Send/Receive | Sender transmits a message to a posted receive buffer | Appropriate receive work request and compatible transport |
| Atomic Operations | Supported remote atomic memory operations | Compatible hardware, transport and permissions |
RDMA Read and Write are commonly called one-sided operations because the remote CPU need not post a matching receive for each operation. Send/Receive is two-sided because the receiving endpoint must provide receive buffers.
Connecting RDMA Communication Directly to GPU Memory
In supported configurations, GPUDirect RDMA allows compatible network adapters to access GPU memory without requiring an intermediate copy through ordinary host system memory.
This can reduce unnecessary data movement and improve communication efficiency for distributed GPU workloads.
GPU memory access depends on supported hardware, drivers, adapter capabilities, memory registration mechanisms and platform configuration. Do not assume every Azure GPU VM exposes the same GPUDirect RDMA capabilities.
Understanding RDMA Latency, Throughput and Bottlenecks
RDMA can reduce software overhead, but actual performance still depends on adapter bandwidth, fabric conditions, memory access, message size and application communication patterns.
Engineers should distinguish small-message latency from large-message throughput when benchmarking an RDMA environment.
Message Size
Small transfers emphasize latency and operation overhead. Large transfers emphasize bandwidth.
Queue Depth
The number of outstanding operations influences how effectively the communication path is utilized.
Memory Access
Registration, memory placement, PCIe topology and GPU access can affect transfer efficiency.
Fabric Conditions
Congestion, routing, link health and transport behavior influence observed communication performance.
| Observed Symptom | Potential Cause | Investigation |
|---|---|---|
| High Small-Message Latency | Software, queue or fabric overhead | Benchmark latency and inspect system configuration |
| Low Large-Message Throughput | Link, adapter, memory or congestion bottleneck | Compare measured bandwidth with expected capabilities |
| Completion Errors | Invalid memory access, QP state or transport failure | Inspect work completion status and adapter diagnostics |
| Intermittent RDMA Failure | Fabric instability or resource lifecycle problems | Correlate fabric counters with application logs |
Understanding RDMA as a High-Performance Communication System
RDMA combines registered memory, protection domains, queue pairs, completion queues, and adapter-managed communication to reduce CPU and software overhead.
One-sided RDMA operations enable authorized remote memory access without requiring a matching receive operation for each transfer. Two-sided operations use Send/Receive communication semantics.
GPUDirect RDMA extends this architecture to supported GPU memory configurations, helping high-performance AI workloads reduce unnecessary data movement.
RDMA is more than a faster network connection. It is a memory communication architecture built around registered buffers, hardware work queues, access permissions, and asynchronous completion semantics. Understanding these mechanisms is essential for diagnosing communication performance and reliability in distributed GPU clusters.
RDMA Memory Transfer Visualizer
Explore registered memory, RDMA adapters, queue pairs, work requests and completion queues. Step through RDMA Write, RDMA Read and Send/Receive communication between GPU compute nodes.
RDMA Operation Configuration
RDMA operations use registered memory and adapter-managed queues. One-sided RDMA Read/Write operations differ from two-sided Send/Receive messaging, where the receiver must post a receive work request.
RDMA Transfer Metrics
RDMA Memory and Adapter Architecture
RDMA Engineering Assessment
Register memory and establish the queue pair.
RDMA Work Request Console
InfiniBand Fabric Architecture
InfiniBand is a high-performance networking technology designed to support low-latency, high-bandwidth communication between compute systems.
In supported Azure GPU environments, InfiniBand provides an inter-node communication fabric for distributed training workloads. Its architecture combines Host Channel Adapters, fabric switches, subnet management, local addressing, routing, transport services, and quality-of-service mechanisms.
What Is an InfiniBand Network Fabric?
An InfiniBand fabric is a switched communication network that connects compatible endpoints through Host Channel Adapters and InfiniBand switches.
Unlike a conventional Ethernet/IP network, InfiniBand uses its own link-layer addressing, subnet management, routing mechanisms, transport services, and flow-control architecture.
Host Channel Adapters
HCAs connect compute nodes to the InfiniBand fabric and execute supported communication operations.
Fabric Switches
InfiniBand switches forward packets through the fabric according to configured forwarding information.
Subnet Management
A subnet manager discovers the topology, assigns identifiers, and configures fabric forwarding.
Transport Services
InfiniBand supports communication services including reliable connected and datagram transports.
Both can support RDMA, but InfiniBand uses a dedicated fabric architecture, while RoCEv2 carries RDMA traffic over Ethernet and IP/UDP networks. They have different forwarding, addressing and operational models.
Inside a Multi-Stage InfiniBand Fabric
Large InfiniBand deployments may use multi-stage switching topologies to connect many compute nodes while providing substantial aggregate bandwidth and path diversity.
The following conceptual design illustrates spine and leaf switching layers, GPU nodes with HCAs, and subnet management.
Azure customers do not necessarily control or observe the underlying physical InfiniBand switching topology or subnet management infrastructure. Available configuration and diagnostics depend on the Azure service, VM family, and supported software environment.
Understanding the Role of the InfiniBand HCA
A Host Channel Adapter is the endpoint device connecting a compute system to the InfiniBand fabric.
The HCA supports communication resources such as queue pairs, memory registration, completion queues, and transport operations.
Fabric Connectivity
Connects a host to one or more supported InfiniBand fabric ports.
RDMA Processing
Executes supported RDMA operations through hardware-managed work queues.
Transport Handling
Implements supported InfiniBand transport and packet processing.
An InfiniBand HCA exposes a communication architecture built around RDMA verbs, queue pairs, registered memory and InfiniBand transport services. Conventional Ethernet NICs may support different features, including RoCE on compatible hardware.
How the InfiniBand Subnet Manager Configures the Fabric
InfiniBand subnet management is responsible for discovering and configuring the fabric so that endpoints can communicate.
The subnet manager uses management information to understand the topology and configure the appropriate forwarding behavior.
The InfiniBand subnet manager configures InfiniBand fabric connectivity. This is distinct from BGP or OSPF routing in conventional IP networks.
Understanding InfiniBand Local Identifiers
InfiniBand uses Local Identifiers (LIDs) for forwarding within a subnet. A LID identifies a destination in the local InfiniBand subnet.
Switch forwarding tables map destination LIDs to output ports, allowing packets to traverse the fabric toward the intended endpoint.
| Identifier | Purpose | Scope |
|---|---|---|
| LID | Local InfiniBand forwarding identifier | InfiniBand subnet |
| GUID | Globally unique identifier for supported fabric entities | Device or port identity |
| GID | Global identifier used by applicable addressing and transport mechanisms | Global addressing context |
| QP Number | Identifies a queue pair at an endpoint | Endpoint communication resource |
| P_Key | Identifies an InfiniBand partition membership context | Fabric partitioning |
An InfiniBand switch receives a packet with a destination LID. Its forwarding table determines the output port used to send the packet toward that destination. This simplified example assumes ordinary unicast forwarding within a configured subnet.
How InfiniBand Switches Forward Traffic
InfiniBand fabric routing determines how traffic moves through switches between communicating endpoints.
The subnet manager or associated routing configuration calculates paths and programs the forwarding tables used by switches.
Topology Discovery
The management system learns the connected switches, endpoints and fabric links.
Path Computation
Routing algorithms determine forwarding paths according to the fabric design.
Forwarding Tables
Switches use programmed forwarding information to select output ports.
Traffic Distribution
Suitable path assignment strategies help distribute communication across available fabric resources.
InfiniBand path selection and forwarding should not be assumed to behave identically to IP ECMP. Routing behavior depends on InfiniBand fabric management and the available forwarding mechanisms.
InfiniBand Partitions, Service Levels and Virtual Lanes
InfiniBand provides mechanisms for partitioning communication domains and managing different classes of traffic.
Partition keys (P_Keys) help enforce communication membership, while service levels and virtual lanes support traffic handling and quality-of-service behavior.
Partition Keys
P_Keys define partition membership and participate in fabric access enforcement.
Service Levels
Service levels provide a classification mechanism for traffic treatment.
Virtual Lanes
Virtual lanes provide separate flow-control resources within supported InfiniBand links.
InfiniBand uses link-level credit-based flow control. Virtual lanes provide distinct flow-control resources and can support traffic isolation and deadlock-avoidance strategies.
Diagnosing InfiniBand Fabric Performance Problems
InfiniBand fabric issues can affect distributed training throughput, collective communication latency, and application reliability.
Troubleshooting requires correlating adapter state, link health, fabric counters, routing information, and application-level behavior.
| Symptom | Potential Cause | Investigation |
|---|---|---|
| Link Not Active | Port, physical link or configuration problem | Inspect supported HCA port state and diagnostics |
| Reduced Bandwidth | Link speed, congestion or placement limitations | Compare measured throughput and fabric capabilities |
| High Collective Latency | Congestion, synchronization or communication imbalance | Correlate NCCL profiling with fabric metrics |
| Communication Failure | QP errors, fabric disruption or resource problems | Inspect work completions and relevant system logs |
| Intermittent Performance | Changing fabric conditions or workload placement | Compare repeated tests and available telemetry |
Some fabric diagnostics or management operations may not be available to Azure VM customers. Use supported guest-level diagnostics and Azure documentation rather than assuming unrestricted access to fabric switches or subnet manager controls.
Understanding InfiniBand as a Managed Communication Fabric
InfiniBand combines Host Channel Adapters, switches, subnet management, local identifiers, routing, transport services, partitioning, and flow-control mechanisms.
The subnet manager establishes forwarding connectivity, while switches forward packets according to configured fabric information.
In distributed GPU environments, fabric design and health influence communication throughput, latency, collective operation performance, and training reliability.
InfiniBand is a complete switched networking architecture, not merely an RDMA feature or a faster Ethernet connection. Engineers must understand HCAs, subnet management, LIDs, forwarding tables, partitions, service levels, virtual lanes, and fabric diagnostics to reason effectively about high-performance GPU cluster communication.
InfiniBand Fabric Design Lab
Build an InfiniBand fabric, discover HCAs and switches, assign local identifiers, inspect forwarding paths and investigate link failures in a GPU cluster network.
InfiniBand Fabric Configuration
The subnet manager discovers fabric ports, assigns LIDs and programs forwarding information. This lab models simplified deterministic routing; real InfiniBand subnet managers use more detailed topology discovery and routing algorithms.
Fabric Engineering Metrics
Interactive InfiniBand Fabric Topology
InfiniBand Routing Assessment
Build the fabric and run subnet management.
InfiniBand Engineering Console
RoCEv2 and Ethernet AI Networking
RDMA over Converged Ethernet version 2 (RoCEv2) enables supported RDMA communication across Ethernet networks using IP and UDP encapsulation.
RoCEv2 is an important technology in high-performance Ethernet environments because it combines RDMA communication capabilities with routable IP networking. However, efficient operation requires careful attention to congestion control, traffic classification, buffering, flow control, and fabric design.
What Is RDMA over Converged Ethernet?
RoCEv2 carries RDMA transport traffic over UDP/IP and Ethernet. This allows compatible endpoints to exchange RDMA messages across appropriately configured IP networks.
RoCEv2 differs from native InfiniBand because it uses Ethernet and IP forwarding infrastructure rather than an InfiniBand subnet with LID-based forwarding.
Ethernet Infrastructure
RoCEv2 uses compatible Ethernet networking equipment and RDMA-capable endpoints.
Routable IP Transport
UDP/IP encapsulation allows RoCEv2 traffic to traverse suitable Layer 3 networks.
RDMA Operations
Compatible adapters support memory-oriented communication using RDMA verbs and queues.
Congestion Engineering
Network configuration must address congestion, buffering, packet loss and flow control.
Supported Azure GPU VM families may provide native InfiniBand connectivity for distributed training. RoCEv2 is discussed here as a separate Ethernet RDMA architecture. Do not assume that an Azure InfiniBand-backed deployment uses RoCEv2 or exposes equivalent Ethernet fabric controls.
How RoCEv2 Connects GPU Nodes Across an Ethernet Fabric
RoCEv2 endpoints use RDMA-capable network adapters connected through Ethernet switches. Depending on the network design, traffic can traverse Layer 2 or Layer 3 forwarding paths.
High-performance Ethernet AI fabrics commonly require substantial bandwidth, predictable latency, suitable traffic engineering, and congestion-management mechanisms.
RDMA traffic can be sensitive to congestion and packet loss. Modern Ethernet AI designs use suitable endpoint and switch mechanisms to control congestion rather than assuming that Ethernet automatically provides lossless communication.
Understanding the RoCEv2 Packet Stack
RoCEv2 encapsulates InfiniBand-derived transport information within UDP/IP packets carried by Ethernet frames.
The network forwards traffic using the applicable Ethernet and IP headers, while the compatible RDMA endpoints process the encapsulated transport information.
UDP provides the IP encapsulation mechanism; it does not itself implement RDMA reliability. Reliable communication semantics, when used, are handled by the appropriate RDMA transport mechanisms.
How PFC Controls Congestion on Ethernet Links
Priority Flow Control (PFC), defined by IEEE 802.1Qbb, allows an Ethernet device to pause transmission for selected traffic priorities.
PFC can help limit packet loss under certain conditions, but it must be engineered carefully because excessive pausing can propagate congestion and affect unrelated flows sharing the same priority.
Traffic Priority
Ethernet traffic is classified into priorities that can receive different flow-control treatment.
Pause Signaling
A congested receiver can request its directly connected peer to pause a selected priority.
Congestion Propagation
Persistent pause conditions can contribute to head-of-line blocking and congestion spreading.
PFC acts on directly connected Ethernet links. It does not replace end-to-end rate control or congestion-aware traffic engineering. Some modern RoCE deployments minimize or avoid reliance on PFC where supported.
How ECN Signals Network Congestion
Explicit Congestion Notification (ECN) allows compatible network devices to indicate congestion by marking packets rather than necessarily discarding them.
In an appropriately configured RoCEv2 environment, congestion information can be used by endpoint congestion-control mechanisms to adjust transmission behavior.
ECN provides congestion indication that can drive endpoint rate adjustment. PFC provides link-local pause behavior. A fabric may use both, one, or other mechanisms according to its design.
Understanding Data Center Quantized Congestion Notification
Data Center Quantized Congestion Notification (DCQCN) is a congestion-control approach developed for RoCE environments.
DCQCN uses congestion feedback associated with ECN marking to regulate the sending rate of compatible RDMA endpoints.
Congestion Point
A network device detects congestion and marks eligible packets according to policy.
Notification Point
The receiver participates in conveying congestion feedback to the sender.
Reaction Point
The sending endpoint adjusts its transmission rate according to the congestion-control algorithm.
Rate Recovery
The endpoint can increase its rate again as congestion conditions improve.
DCQCN is one important approach, not the only possible RoCE congestion-control algorithm. Available mechanisms depend on NIC hardware, firmware, switch capabilities and deployment configuration.
Designing an Ethernet Network for AI Workloads
High-performance Ethernet AI networks require more than high-speed physical interfaces.
Fabric engineers must account for path diversity, oversubscription, buffer behavior, traffic bursts, load balancing, congestion feedback, and the communication patterns generated by distributed workloads.
| Design Area | Engineering Objective | Potential Risk |
|---|---|---|
| Fabric Topology | Provide sufficient path capacity and connectivity | Oversubscribed paths |
| Traffic Classification | Apply suitable QoS treatment to RDMA traffic | Incorrect priority mapping |
| ECN Configuration | Provide timely congestion indication | Late or excessive marking |
| PFC Configuration | Control selected link-local loss conditions where needed | Pause storms and head-of-line blocking |
| Load Distribution | Use available paths efficiently | Flow collisions and uneven utilization |
| Telemetry | Observe congestion, loss and throughput | Hidden performance degradation |
Diagnosing RoCEv2 Network Performance Problems
RoCEv2 troubleshooting requires visibility into both the RDMA endpoints and the Ethernet/IP network.
A performance problem may originate from congestion, queue configuration, packet loss, priority mapping, NIC behavior, or workload communication patterns.
| Symptom | Potential Cause | Investigation |
|---|---|---|
| Reduced RDMA Throughput | Congestion or insufficient path bandwidth | Inspect throughput, ECN marks and link utilization |
| Frequent PFC Pauses | Persistent congestion or buffer pressure | Inspect per-priority pause counters |
| High Latency Variation | Queue buildup or traffic contention | Correlate queue telemetry with workload activity |
| Packet Loss | Buffer exhaustion or configuration problems | Inspect drop counters and QoS configuration |
| Unbalanced Traffic | Hash collisions or poor path distribution | Compare per-link utilization and flow placement |
High PFC activity, ECN marking, packet loss, and low throughput can be related, but they are not interchangeable indicators. Use correlated telemetry and controlled tests to establish the actual bottleneck.
Understanding RoCEv2 as an Ethernet RDMA Architecture
RoCEv2 extends RDMA communication into Ethernet and IP networks through UDP/IP encapsulation.
Efficient operation depends on compatible adapters, suitable Ethernet fabric capacity, congestion-control mechanisms, traffic classification, and reliable monitoring.
PFC, ECN and DCQCN address different aspects of congestion management and must be understood as separate but potentially complementary mechanisms.
RoCEv2 enables high-performance RDMA communication over Ethernet, but achieving consistent AI workload performance requires careful engineering of the complete network fabric. Bandwidth, topology, congestion feedback, queue behavior, endpoint rate control and operational telemetry must work together to support distributed accelerator workloads.
RoCEv2 Congestion and Flow-Control Simulator
Explore Ethernet RDMA congestion through queue occupancy, ECN marking, congestion feedback and priority-based flow control. Investigate incast workloads and the consequences of oversubscribed links.
RoCEv2 Fabric Configuration
ECN marks congestion-capable packets when configured thresholds are reached. A compatible RoCE congestion-control mechanism can react to feedback. PFC pauses a traffic priority to prevent buffer exhaustion but can propagate congestion and create head-of-line blocking.
Congestion Engineering Metrics
Ethernet RDMA Congestion Architecture
Congestion Assessment
Configure the fabric and generate traffic.
RoCEv2 Engineering Console
NCCL and GPU Collective Communication
NVIDIA Collective Communications Library (NCCL) provides optimized communication primitives for exchanging data between GPUs within a server and across distributed compute nodes.
Distributed AI training depends on collective operations that coordinate data movement among participating accelerators. NCCL supports operations such as AllReduce, AllGather, ReduceScatter and Broadcast, using communication algorithms selected according to the workload and available hardware topology.
What Is NCCL?
NCCL is a communication library designed for high-performance GPU-to-GPU data exchange.
It provides collective communication operations and point-to-point primitives that can operate across supported GPU interconnects and network transports.
GPU Collectives
Coordinates operations involving multiple participating GPUs, including reductions and data distribution.
Topology Awareness
Considers supported hardware topology and available communication paths.
Multiple Transports
Uses supported local GPU communication and inter-node networking mechanisms.
Distributed Training
Supports communication patterns used by frameworks implementing distributed machine learning.
NCCL is a communication library. It coordinates GPU communication using supported underlying interconnects and network transports. The physical fabric may include local GPU links, PCIe connectivity, and compatible inter-node networking.
How GPUs Coordinate Communication Across a Cluster
A collective operation involves a group of participating processes or GPUs executing compatible communication operations.
The collective's semantics define how data is combined, gathered, distributed or synchronized between participants.
Communication
Participating ranks must invoke compatible collective operations in the required order. Incorrect participation or mismatched operations can cause hangs, errors or communication failures.
How AllReduce Combines Data Across GPUs
AllReduce applies a reduction operation across data contributed by participating ranks and makes the reduced result available to every participant.
In distributed training, AllReduce is commonly used to combine gradient information across data-parallel workers.
Local Contribution
Each rank supplies its input data for the reduction operation.
Reduction and Distribution
The communication algorithm combines values and distributes the result to all participants.
How AllGather Reconstructs Distributed Data
AllGather collects data contributed by each participating rank and makes the combined collection available to every participant.
This operation is useful when model or tensor data is distributed across multiple GPUs and must be assembled for subsequent computation.
AllGather can be used in distributed model architectures when tensor partitions must be assembled across ranks. Exact communication patterns depend on the framework and parallelization strategy.
How ReduceScatter Combines and Distributes Tensor Partitions
ReduceScatter performs a reduction across participating ranks and distributes different portions of the reduced result to different ranks.
This operation can reduce the need for every participant to retain the complete reduced tensor.
ReduceScatter is important in communication patterns where reduced tensor data is partitioned across ranks, including certain sharded training strategies.
How Broadcast Distributes Data from One Rank
Broadcast distributes data from a designated root rank to all other participating ranks.
It can be used to distribute model state, configuration data, or other information that must be consistent across participants.
Understanding NCCL Communication Algorithms
Collective communication can be implemented using different algorithms depending on message size, hardware topology, available bandwidth, latency and the selected collective.
Ring-based algorithms organize communication through logical sequences of ranks. Tree-based algorithms organize communication through hierarchical paths.
| Characteristic | Ring | Tree |
|---|---|---|
| Communication Structure | Logical circular sequence of ranks | Hierarchical communication paths |
| Typical Strength | Efficient bandwidth utilization for suitable large transfers | Reduced communication depth for suitable operations |
| Performance Sensitivity | Number of steps and available bandwidth | Tree depth, path contention and message size |
| Topology Consideration | Efficient rank ordering and link use | Efficient hierarchical path placement |
| Selection | NCCL may select algorithms based on supported capabilities and runtime conditions | |
NCCL supports multiple communication algorithms and protocols. Actual selection depends on NCCL version, hardware, topology, operation type and runtime configuration. Ring and tree are important examples, not an exhaustive list.
Understanding Collective Communication Bottlenecks
NCCL performance depends on the interaction between collective algorithms, GPU memory access, local interconnects, network adapters, and the cluster fabric.
A slow collective operation does not automatically indicate a physical network fault. Workload imbalance, rank synchronization, memory pressure, topology and software configuration can also influence performance.
Message Size
Small and large collective operations have different latency and bandwidth behavior.
Rank Placement
Process placement relative to GPUs, network adapters and compute nodes can influence performance.
Network Capacity
Inter-node bandwidth, congestion and fabric topology affect communication efficiency.
Synchronization
Uneven worker progress can cause some ranks to wait for others during collectives.
| Symptom | Potential Cause | Investigation |
|---|---|---|
| Slow AllReduce | Bandwidth, algorithm or topology limitation | Benchmark collective throughput and inspect topology |
| NCCL Timeout | Rank mismatch, process failure or communication problem | Inspect rank logs and communication diagnostics |
| Variable Collective Latency | Congestion or uneven workload progress | Correlate network metrics and per-rank timing |
| Low Scaling Efficiency | Communication overhead growing relative to computation | Compare single-node and multi-node training profiles |
Detailed NCCL logging can produce substantial output and affect performance measurements. Enable appropriate diagnostics during controlled investigations and disable unnecessary verbosity afterward.
Understanding GPU Collective Communication
NCCL provides communication primitives used by distributed GPU workloads to combine, gather, scatter and distribute data.
AllReduce, AllGather, ReduceScatter and Broadcast have distinct data movement semantics and support different distributed computation strategies.
Communication algorithms, rank placement, interconnect topology, network capacity and synchronization behavior all influence the performance of collective operations.
Distributed AI training performance depends not only on GPU computation, but also on how efficiently accelerators exchange information. Understanding NCCL collective semantics, communication algorithms, hardware topology and diagnostic techniques allows engineers to distinguish network bottlenecks from workload synchronization and software-level problems.
NCCL Collective Communication Simulator
Explore collective GPU communication patterns, compare ring and tree algorithms, and step through AllReduce, AllGather, ReduceScatter and Broadcast operations used in distributed AI training.
Collective Communication Configuration
NCCL selects communication algorithms and transport paths based on hardware topology, collective type, message size and runtime settings. This lab visualizes simplified ring/tree patterns, not the complete NCCL implementation.
Collective Engineering Metrics
GPU Collective Communication Topology
Collective Algorithm Assessment
Build a collective and advance through its phases.
NCCL Engineering Console
Distributed AI Training Network Architecture
Distributed AI training divides computation across multiple GPUs and compute nodes. The selected parallelization strategy determines how data, gradients, activations, model parameters, and tokens move through the network.
High-performance networking engineers must understand these communication patterns because data parallelism, tensor parallelism, pipeline parallelism and expert parallelism impose different bandwidth, latency and placement requirements.
Why Distributed AI Training Requires Network-Aware Design
Large AI models and datasets often require computation to be distributed across many accelerators.
Although additional GPUs increase available compute capacity, they also introduce communication requirements that can limit scaling efficiency.
Compute Distribution
Model computation is divided across participating GPUs and worker processes.
Data Movement
Workers exchange tensors, gradients, activations and model state.
Synchronization
Communication operations coordinate progress and maintain required training consistency.
Scaling Efficiency
Communication overhead influences how effectively additional accelerators improve training throughput.
Doubling the number of GPUs does not necessarily double training throughput. Network communication, synchronization, data loading, memory access and workload imbalance can reduce scaling efficiency.
How GPU Workers Exchange Data Across the Fabric
A distributed training cluster consists of GPU workers connected through local interconnects and an inter-node communication fabric.
Communication libraries and distributed training frameworks coordinate data exchange between participating ranks.
The diagram presents multiple collective operations for architectural context. A particular training workload does not necessarily use every operation, and the exact implementation depends on its framework and model.
How Data Parallelism Synchronizes Model Training
Data parallelism distributes different training data across workers that maintain corresponding model computations.
Each worker computes gradients from its local data. The training system then coordinates gradient synchronization or equivalent state updates.
Gradient Communication
Workers exchange gradient information to coordinate model updates.
Network Requirement
Communication bandwidth and collective efficiency influence the time spent synchronizing training state.
How Tensor Parallelism Splits Model Computation
Tensor parallelism partitions selected model computations across multiple accelerators.
GPUs cooperate on operations involving distributed tensors, which can require frequent communication during forward and backward computation.
Tensor-parallel groups may exchange intermediate data frequently. Placement on fast local GPU interconnects can be beneficial where supported, although the optimal arrangement depends on model size and available hardware.
How Pipeline Parallelism Moves Activations Between Stages
Pipeline parallelism divides a model into sequential processing stages placed on different accelerators or groups of accelerators.
Forward computation passes activations between stages. Backward computation transfers the corresponding gradient information in the reverse direction.
Activation Transfers
Forward-pass activations cross stage boundaries according to the pipeline schedule.
Pipeline Bubbles
Scheduling gaps can leave some accelerators idle while other stages are processing data.
How Mixture-of-Experts Models Generate All-to-All Traffic
Mixture-of-experts (MoE) architectures activate selected expert components for different tokens or inputs.
When experts are distributed across accelerators, tokens may need to move between workers before expert computation and return afterward.
Token routing decisions can produce imbalanced communication and computation across experts. Effective network design must consider traffic bursts and workload distribution rather than assuming uniform demand.
Combining Data, Tensor, Pipeline and Expert Parallelism
Large distributed training deployments frequently combine several parallelization strategies.
Hybrid parallelism allows engineers to distribute computation and model state across multiple dimensions, but introduces additional communication and placement considerations.
| Parallelism Type | Primary Communication | Network Consideration |
|---|---|---|
| Data Parallelism | Gradient or training-state synchronization | Collective bandwidth and synchronization efficiency |
| Tensor Parallelism | Frequent intermediate tensor exchange | Low latency and high bandwidth between group members |
| Pipeline Parallelism | Activation and gradient transfers between stages | Stage placement and communication scheduling |
| Expert Parallelism | Token dispatch and result redistribution | All-to-All traffic and load imbalance |
| Hybrid Parallelism | Multiple communication patterns simultaneously | Placement, contention and fabric capacity planning |
Communication-intensive groups should be placed with awareness of local GPU interconnects, node boundaries, adapter capabilities, and available fabric bandwidth. The best mapping depends on the model architecture and deployment constraints.
Diagnosing Network Bottlenecks in Distributed Training
Distributed training performance depends on both computation and communication.
Engineers should measure training throughput, communication duration, collective performance, per-rank progress, and network telemetry to identify bottlenecks.
| Symptom | Potential Cause | Investigation |
|---|---|---|
| Slow Gradient Synchronization | Collective bandwidth or congestion | Profile AllReduce and inspect network throughput |
| Slow Tensor Parallel Operations | Latency or unfavorable rank placement | Inspect GPU topology and collective timing |
| Pipeline Idle Time | Stage imbalance or scheduling gaps | Profile pipeline stage utilization and microbatches |
| MoE Communication Delays | All-to-All contention or expert imbalance | Measure token routing and per-rank traffic |
| Low Multi-Node Scaling | Communication, storage or workload overhead | Compare single-node and multi-node profiles |
A long collective operation can reflect network transfer time, but also delayed rank participation or workload imbalance. Correlate communication traces with compute timelines before concluding that the fabric is responsible.
Designing Networks for Distributed AI Training
Distributed AI training generates communication patterns determined by how model computation and state are partitioned.
Data parallelism emphasizes synchronization, tensor parallelism can require frequent tensor exchange, pipeline parallelism transfers activations between stages, and expert parallelism can generate substantial All-to-All traffic.
Hybrid training combines these requirements, making network-aware placement, sufficient fabric capacity and workload profiling essential engineering practices.
The optimal AI network architecture depends on the communication patterns generated by the training workload. Engineers must understand how parallelization strategies influence bandwidth demand, latency sensitivity, synchronization and GPU placement to design efficient distributed training environments.
Distributed Training Traffic Explorer
Compare data, tensor, pipeline and expert parallelism. Discover how GPU placement, training strategy and workload characteristics influence communication paths across a distributed AI network.
Distributed Training Configuration
Data parallelism synchronizes gradients. Tensor parallelism exchanges intermediate tensor results. Pipeline parallelism transfers activations and gradients between stages. Expert parallelism routes tokens between distributed experts.
Training Communication Metrics
Distributed GPU Communication Architecture
Training Network Assessment
Build the model and simulate communication.
Training Communication Console
Azure GPU Cluster Networking and Infrastructure
Azure GPU infrastructure combines accelerator-equipped virtual machines, high-performance interconnects, storage systems, orchestration, and operational services to support distributed AI workloads.
The architecture of an Azure GPU cluster depends on the selected VM family, supported GPU configuration, inter-node networking capabilities, workload placement, and storage requirements. Engineers must evaluate these components together rather than treating GPU compute as an isolated resource.
Understanding Azure GPU Cluster Architecture
An Azure GPU cluster consists of compute resources configured to execute accelerator workloads, together with the communication and storage infrastructure required by those workloads.
Distributed training may require communication between GPUs within the same node and between GPUs on different nodes.
GPU Compute Nodes
Azure GPU-capable VM configurations provide accelerator resources for training and inference.
Local GPU Interconnect
Supported hardware configurations provide local GPU communication through available interconnect technologies.
Inter-Node Networking
Supported HPC-oriented configurations can provide high-performance RDMA networking.
Storage and Orchestration
Data access, job scheduling, monitoring and deployment automation support cluster operations.
GPU count, accelerator model, local GPU topology, network adapter capabilities, RDMA support and storage characteristics differ between Azure VM families and specific SKUs. Always validate the capabilities of the exact configuration.
Inside an Azure Distributed GPU Infrastructure Deployment
The following conceptual architecture illustrates the major infrastructure layers involved in distributed GPU training.
Compute nodes perform accelerator workloads, local interconnects support intra-node communication, and supported high-performance network interfaces connect nodes to the inter-node fabric.
Distributed training communication, ordinary IP networking, management traffic and storage access may use different logical or physical paths. Do not assume that every Azure service or storage endpoint connects directly to the InfiniBand fabric.
Selecting Azure GPU Compute for Distributed AI
Azure offers multiple GPU-oriented VM families designed for different accelerator workloads.
Some configurations emphasize large-scale training and high-performance inter-node communication, while others are designed primarily for inference, visualization or general GPU workloads.
| VM Category | Typical Workload | Networking Consideration |
|---|---|---|
| ND-Series GPU VMs | Selected high-performance AI training and accelerator workloads | Check exact SKU for InfiniBand/RDMA and GPU interconnect capabilities |
| NC-Series GPU VMs | GPU compute, training or inference depending on generation | Capabilities differ significantly across configurations |
| NV-Series GPU VMs | Graphics, visualization and selected GPU workloads | Not a substitute for a validated distributed-training fabric |
| Other Supported GPU Configurations | Workload-specific accelerator use cases | Validate GPU, networking, quota and regional availability |
VM-family names are broad categories rather than complete hardware specifications. Verify the current Azure VM documentation for the exact accelerator model, number of GPUs, network interfaces, supported RDMA capabilities and regional availability.
InfiniBand, RDMA and Accelerated Networking
Azure networking capabilities must be evaluated according to the intended communication workload.
Accelerated Networking improves supported VM network data paths, while RDMA-capable high-performance networking provides specialized communication capabilities for compatible workloads.
Accelerated Networking
Improves supported Azure virtual network data paths through hardware acceleration.
InfiniBand Networking
Available on selected HPC-oriented configurations for high-performance inter-node communication.
RDMA Communication
Enables supported memory-oriented data transfer operations through compatible network hardware.
Azure Accelerated Networking and InfiniBand-based RDMA are distinct capabilities. Enabling Accelerated Networking does not automatically provide an RDMA fabric or InfiniBand connectivity.
Why Compute Placement Influences Network Performance
Distributed training communication depends on the relationship between GPU placement, local interconnect topology and inter-node networking.
Communication between GPUs on the same node may use local hardware paths, while communication between nodes requires an appropriate network transport.
Intra-Node Locality
Place communication-intensive work with awareness of local GPU interconnect capabilities.
Inter-Node Locality
Consider network topology, supported placement options and fabric connectivity for distributed jobs.
Rank Mapping
Align distributed processes with GPUs and network resources where supported by the framework.
Capacity Planning
Account for regional availability, quota, allocation constraints and cluster size.
Availability zones, proximity placement groups, capacity reservations and other Azure placement mechanisms have different purposes and support conditions. None should be assumed to guarantee a particular InfiniBand topology without documented support for the selected service.
Connecting GPU Training to Data and Checkpoint Storage
Distributed AI training depends on efficient access to datasets, model artifacts and checkpoints.
Storage performance can become a bottleneck even when GPU compute and inter-node communication are operating correctly.
Dataset Access
Training workers read and preprocess data from supported storage systems.
Checkpoint Storage
Model state and optimizer information may be saved periodically for recovery.
Data Staging
Caching and staging strategies can reduce repeated remote storage access.
Fast GPU-to-GPU networking does not guarantee fast dataset loading or checkpoint operations. Storage throughput, latency, client configuration and access patterns must be measured independently.
Planning an Azure Distributed GPU Cluster Deployment
Azure GPU deployments require coordinated planning across compute, networking, storage, security and orchestration.
The deployment workflow should validate both infrastructure availability and the application-level communication required by distributed training.
GPU drivers, CUDA libraries, NCCL, OFED or other supported RDMA components must be compatible with the selected Azure VM environment. Follow the relevant Microsoft and hardware-vendor installation guidance.
Validating Azure GPU Cluster Networking
Before running large-scale training, engineers should validate the compute and networking capabilities of the deployed environment.
Validation should progress from device discovery to communication benchmarks and full distributed workload tests.
| Validation Area | Objective | Example Tool |
|---|---|---|
| GPU Discovery | Confirm GPU visibility and device health | nvidia-smi |
| GPU Topology | Inspect visible GPU interconnect relationships | nvidia-smi topo -m |
| RDMA Devices | Inspect supported RDMA adapter capabilities | ibv_devinfo |
| InfiniBand Ports | Inspect available HCA port status | ibstat |
| RDMA Performance | Measure communication bandwidth and latency | Compatible perftest utilities |
| NCCL Performance | Measure GPU collective communication | nccl-tests |
| Training Performance | Validate end-to-end workload scaling | Framework profiling and telemetry |
Azure may manage the underlying InfiniBand switches and subnet infrastructure. Guest-level diagnostics do not necessarily provide access to physical fabric configuration or administrative controls.
Understanding Azure GPU Infrastructure as a Complete System
Azure GPU infrastructure combines accelerator compute, local interconnects, high-performance networking, storage and orchestration.
Successful distributed AI deployment requires selecting compatible VM configurations, validating communication capabilities, planning placement and storage, and benchmarking actual workload performance.
Engineers must distinguish between accelerated IP networking, RDMA-capable inter-node communication, local GPU interconnects, and storage data paths.
A high-performance Azure GPU cluster is an integrated compute and communication system. GPU hardware alone does not determine distributed training performance. VM capabilities, network topology, RDMA support, software compatibility, placement, storage throughput and operational validation must be engineered together.
Azure GPU Cluster Deployment Designer
Design an Azure GPU cluster and validate compute, RDMA networking, fabric placement, storage connectivity and deployment readiness for distributed AI workloads.
Azure GPU Deployment Configuration
Azure GPU VM families differ in GPU count, interconnects, RDMA support and availability. Production deployment requires checking the exact VM SKU, region, quotas, networking capabilities and supported cluster deployment method.
Deployment Engineering Metrics
Azure GPU Cluster Network Architecture
Deployment Readiness Checks
Deployment Assessment
Build the cluster and validate its architecture.
Azure Infrastructure Engineering Console
AI Network Performance Engineering
High-performance AI networking requires careful measurement of bandwidth, latency, congestion, topology, communication efficiency, and workload scaling.
GPU cluster performance depends on more than nominal network interface speed. Engineers must understand how the communication fabric behaves under realistic distributed training workloads, including collective communication, bursty traffic, synchronization and competing data flows.
Understanding AI Network Performance Metrics
Network performance is determined by several related but distinct engineering metrics.
Bandwidth determines available transfer capacity, latency influences communication responsiveness, and congestion affects how consistently traffic can traverse the fabric.
Bandwidth
The rate at which data can be transferred across a link or communication path.
Latency
The elapsed time associated with a communication operation or network transfer.
Throughput
The amount of useful data successfully transferred per unit of time.
Congestion
Contention for network resources that can increase queueing delays or reduce effective performance.
A link's nominal bandwidth represents its rated capacity. Application throughput depends on protocol overhead, available path capacity, congestion, endpoint performance and workload behavior.
Visualizing GPU Communication and Network Contention
The following conceptual architecture illustrates GPU communication across a shared high-performance network fabric.
Multiple communication flows can compete for network capacity. When offered traffic exceeds available forwarding resources, queues may grow and communication latency can increase.
Even when every GPU node has a fast network interface, shared switch links or other network resources can become congested when multiple workers communicate simultaneously.
Understanding Effective Network Transfer Capacity
High-performance networks are commonly described using interface bandwidth, but effective application throughput may be lower.
Packet overhead, protocol processing, communication patterns, endpoint limitations and congestion can all influence the achieved data rate.
Physical link utilization, RDMA payload throughput, NCCL bus bandwidth and application training throughput represent different measurements. They should not be compared as interchangeable metrics.
Why Low Latency Matters for Distributed AI
Latency is particularly important for communication patterns involving frequent small transfers, synchronization and dependent operations.
The total latency observed by a distributed application includes more than propagation delay through the physical network.
Endpoint Latency
Software and hardware processing influence communication startup time.
Network Traversal
Fabric topology, link characteristics and forwarding contribute to transfer delay.
Queueing Delay
Congestion can increase waiting time before packets are forwarded.
Synchronization
Distributed ranks may wait for other participants before collective operations complete.
Understanding Fabric-Wide Communication Capacity
Bisection bandwidth describes the communication capacity across a partition dividing a network into two groups.
It is useful when evaluating whether a fabric can support communication-intensive workloads that exchange large volumes of data between different portions of a cluster.
A fabric can provide high per-node bandwidth while still having insufficient aggregate capacity across important network cuts. This becomes significant when many GPU workers communicate across the cluster simultaneously.
How Oversubscription Limits GPU Cluster Performance
Oversubscription occurs when the aggregate potential demand from connected endpoints exceeds the available upstream network capacity.
Oversubscription can be acceptable for some workloads, but communication-heavy AI training may require substantial aggregate fabric capacity to avoid persistent contention.
Queue Buildup
Traffic arriving faster than it can be transmitted creates queue pressure.
Incast Traffic
Many senders targeting a shared receiver or bottleneck can create concentrated bursts.
Congestion Effects
Congestion can increase latency, trigger flow control, or cause packet loss depending on the fabric.
Native InfiniBand and Ethernet-based RoCEv2 use different forwarding and flow-control architectures. Performance analysis must use the mechanisms and telemetry supported by the actual network transport.
Measuring the Cost of Communication in AI Training
Distributed training performance depends on how effectively computation and communication overlap.
Some communication can execute while GPUs perform computation, but synchronization dependencies may expose communication delays on the critical path.
High GPU utilization does not necessarily imply efficient distributed training. Measure useful training throughput, iteration time, communication overhead and scaling efficiency together.
Building an AI Network Performance Investigation Workflow
Effective performance troubleshooting correlates application behavior with communication library, adapter and network measurements.
Engineers should avoid diagnosing a network bottleneck solely from low GPU utilization or a slow collective operation.
| Metric | What It Reveals | Investigation |
|---|---|---|
| Link Utilization | Traffic relative to interface capacity | Compare per-link demand and available bandwidth |
| RDMA Throughput | Endpoint communication performance | Benchmark supported RDMA operations |
| NCCL Collective Time | Duration of collective operations | Compare message sizes, ranks and algorithms |
| Queue and Congestion Counters | Pressure on forwarding resources | Inspect transport-specific telemetry |
| GPU Activity | Accelerator workload behavior | Correlate compute and communication timelines |
| Training Iteration Time | End-to-end workload performance | Compare baseline and scaled deployments |
Synthetic bandwidth tests, NCCL benchmarks and real training workloads exercise different communication patterns. A healthy synthetic benchmark does not guarantee optimal application performance.
Understanding AI Network Performance as a System
AI network performance depends on bandwidth, latency, effective throughput, topology, bisection capacity, oversubscription, congestion and workload communication patterns.
Engineers must distinguish nominal link capacity from achieved throughput, and network delay from synchronization or application overhead.
Effective troubleshooting combines network telemetry, RDMA measurements, NCCL profiling and training-level performance analysis.
High-performance AI networking is an end-to-end engineering discipline. Fast interfaces are only one component of an efficient GPU cluster. Fabric capacity, congestion behavior, communication algorithms, accelerator placement, workload synchronization and accurate telemetry determine how effectively distributed AI systems scale.
AI Network Bottleneck Analyzer
Analyze GPU cluster network capacity, latency, oversubscription and collective communication pressure. Discover which part of the fabric is limiting distributed AI training performance.
AI Fabric Performance Configuration
Fabric capacity must be evaluated against collective communication patterns, bisection bandwidth, link utilization and latency. Nominal adapter speed alone does not determine distributed training performance.
Network Engineering Metrics
GPU Network Fabric Heatmap
Performance Telemetry
Bottleneck Assessment
Configure the fabric and analyze the workload.
Performance Engineering Console
Production Troubleshooting and Reliability
Production GPU clusters require reliable communication across accelerators, RDMA adapters, network fabrics, storage systems, and distributed training software. A failure in any of these components can interrupt training or reduce cluster performance.
Troubleshooting requires correlating application errors with GPU health, NCCL diagnostics, RDMA device state, network telemetry, workload placement and infrastructure events.
Understanding Where AI Cluster Failures Occur
Distributed GPU communication spans several hardware and software layers. Failures can originate at the application, communication library, accelerator, adapter, fabric or infrastructure level.
GPU and Compute Failures
GPU faults, memory errors, driver problems or process failures can interrupt distributed workloads.
NCCL Communication Failures
Collective mismatches, rank failures, timeouts or communication initialization problems.
RDMA and Fabric Failures
Adapter errors, link problems, congestion or fabric-level communication degradation.
Infrastructure Failures
Storage delays, scheduling problems, node unavailability or operational configuration errors.
An NCCL timeout may be caused by a network problem, but it can also result from a failed worker, mismatched collective, GPU fault or application deadlock. Investigation must establish causality rather than assuming that the last reported error identifies the original failure.
Visualizing Failures Across the GPU Communication Stack
The following conceptual incident illustrates how a communication failure can affect one GPU worker and propagate into distributed training errors.
Engineers should investigate both the affected worker and the shared infrastructure used by the collective operation.
A red adapter indicator or failed collective does not prove that the network caused the incident. A GPU process failure may produce downstream communication errors across otherwise healthy links.
Diagnosing NCCL Communication Timeouts
NCCL timeouts indicate that an operation did not complete within an expected period enforced by the surrounding runtime or framework.
The root cause may involve incorrect collective participation, failed ranks, GPU execution problems or underlying communication failures.
Rank Mismatch
Different ranks execute incompatible collective sequences or fail to participate correctly.
Worker Failure
A process, GPU or node stops progressing, preventing a collective from completing.
Communication Failure
Transport errors or unavailable communication paths disrupt required data exchange.
Performance Stall
Severe delays or workload imbalance can cause operations to exceed configured timeouts.
Increasing a framework timeout may be appropriate for legitimate long-running operations, but it does not repair a failed rank, broken transport, incorrect collective sequence or unhealthy device.
Understanding RDMA Communication Errors
RDMA communication depends on compatible adapters, registered memory, queue-pair state, transport configuration and functioning network connectivity.
Failures can originate from invalid work requests, memory access violations, queue-pair errors, transport failures or adapter-level problems.
| Failure Area | Potential Cause | Investigation |
|---|---|---|
| Queue Pair Error | Transport or work-request failure | Inspect completion status and QP state |
| Memory Access Error | Invalid memory registration, address or access key | Validate memory regions and permissions |
| Connection Failure | Endpoint configuration or path problem | Verify addressing, connectivity and supported transport |
| Port Not Active | Link or fabric initialization issue | Inspect adapter and port state |
| Low RDMA Throughput | Endpoint, topology or network bottleneck | Run controlled bandwidth and latency tests |
Error behavior depends on the RDMA transport, queue-pair type, work-request semantics and device implementation. Do not assume that all RDMA failures produce identical completion statuses or recovery behavior.
Diagnosing Link, Port and Fabric-Level Problems
InfiniBand communication depends on healthy links, initialized ports, valid addressing and correctly functioning fabric forwarding.
Physical link problems, port errors, fabric congestion or control-plane issues can disrupt communication between nodes.
Link State
Verify that expected adapter ports are active and operating with supported link parameters.
Error Counters
Inspect available link error and port health counters for abnormal changes.
Fabric Control
Investigate addressing, routing and subnet-management issues where administrative visibility exists.
Azure manages portions of the physical high-performance networking infrastructure. Customers may have guest-level diagnostics without administrative access to physical switches or subnet managers. Escalation through the appropriate Azure support process may be necessary.
Investigating Slow Distributed Training Without Complete Failure
Some production incidents do not produce complete communication failures. Instead, training jobs continue running but achieve lower throughput or increased iteration time.
These incidents require performance correlation across compute, communication and infrastructure metrics.
| Symptom | Possible Explanation | Diagnostic Action |
|---|---|---|
| Slow AllReduce | Collective communication bottleneck | Compare NCCL benchmarks and rank placement |
| Uneven Rank Progress | Compute imbalance or delayed workers | Correlate per-rank timelines |
| Reduced RDMA Bandwidth | Adapter, path or congestion limitation | Compare controlled RDMA measurements |
| High Iteration Time | Compute, storage or communication overhead | Profile complete training iteration |
| Intermittent Slowdown | Bursty traffic, contention or variable workload behavior | Correlate telemetry over time |
Without a known-good performance baseline, it can be difficult to distinguish normal workload variation from an infrastructure regression. Preserve benchmark results, configuration versions and representative training metrics.
Building a Repeatable GPU Cluster Troubleshooting Workflow
A structured investigation helps engineers avoid changing multiple variables simultaneously and obscuring the original failure.
Begin with the application symptom, establish the affected scope, collect evidence, and isolate the failing layer through controlled tests.
Restarting a distributed job, rebooting a node or resetting a device can remove valuable diagnostic evidence. Capture logs, counters, timestamps and relevant configuration information before disruptive recovery actions whenever operationally feasible.
Designing Reliable Distributed GPU Operations
Reliability engineering extends beyond repairing individual failures. It includes observability, repeatable deployments, fault detection, checkpointing, controlled recovery and incident learning.
Observability
Collect GPU, communication, adapter and workload metrics with correlated timestamps.
Configuration Control
Track driver, runtime, library, workload and deployment changes.
Checkpoint and Recovery
Use supported training checkpoint mechanisms to reduce the impact of interrupted jobs.
Incident Review
Document root causes, detection gaps and corrective actions after production incidents.
A redundant network path does not necessarily allow an in-progress distributed training job to survive the loss of a rank or compute node. Application recovery behavior depends on the framework, job design and checkpointing strategy.
Building Reliable AI Networking Operations
Production AI networking reliability requires visibility across GPUs, communication libraries, RDMA adapters, fabric connectivity, storage and orchestration.
NCCL timeouts, RDMA errors and degraded training throughput are symptoms that must be investigated using correlated evidence.
Effective engineers establish baselines, isolate failures systematically, preserve diagnostic evidence and validate recovery before returning workloads to normal operation.
Reliable distributed AI training depends on more than high-performance network hardware. Engineers must combine GPU diagnostics, NCCL analysis, RDMA troubleshooting, fabric telemetry, workload profiling and structured incident response to maintain production performance and availability.
AI Cluster Network Incident Investigation Lab
Investigate production GPU cluster failures using simulated NCCL logs, RDMA telemetry, network paths and training metrics. Diagnose the root cause, apply remediation and verify recovery.
Production Incident Configuration
Investigate the evidence before submitting a diagnosis. An NCCL timeout is often a symptom, not the underlying cause. Correlate framework errors with RDMA counters, link health and workload behavior.
Incident Telemetry
GPU Cluster Incident Topology
Investigation Evidence
Incident Investigation Assessment
Select a scenario and begin the investigation.
Production Troubleshooting Console

- Azure AI Gateway Architecture - November 16, 2026
- Azure AI High-Performance Networking Explained - November 16, 2026
- Azure OpenAI Architecture Explained - November 16, 2026