
Monitoring and Distributed Systems
By utilizing distributed architectures, the cloud native ecosystem allows organizations to build scalable, resilient, and novel software architectures. However, the ever-changing nature of distributed systems means that previous approaches to monitoring can no longer keep up. The introduction of containers made the cloud flexible and empowered distributed systems.
Nevertheless, the ever-changing nature of these systems can cause them to fail in many ways. Distributed systems are inherently complex, and, as systems theorist Richard Cook notes, “Complex systems are intrinsically hazardous systems.”
Cloud-native systems require a new approach to monitoring, one that is open-source compatible, scalable, reliable, and able to control massive data growth. However, cloud-native monitoring can’t exist in a vacuum; it must be part of a broader observability strategy.
**Gaining Observability**
Key Features of Observability:
1. High-dimensional data collection: Observability involves collecting a wide variety of data from different system layers, including metrics, logs, traces, and events. This comprehensive data collection provides a holistic view of the system’s behavior.
2. Distributed tracing: Observability allows tracing requests as they flow through a distributed system, enabling engineers to understand the path and identify performance bottlenecks or errors.
3. Contextual understanding: Observability emphasizes capturing contextual information alongside the data, enabling teams to correlate events and understand the impact of changes or incidents.
Benefits of Observability:
1. Faster troubleshooting: By providing detailed insights into system behavior, observability helps teams quickly identify and resolve issues, minimizing downtime and improving system reliability.
2. Proactive monitoring: Observability allows teams to detect potential problems before they become critical, enabling proactive measures to prevent service disruptions.
3. Improved collaboration: With observability, different teams, such as developers, operations, and support, can have a shared understanding of the system’s behavior, leading to improved collaboration and faster incident response.
**Gaining Monitoring**
On the other hand, monitoring focuses on collecting and analyzing metrics to assess a system’s health and performance. It involves setting up predefined thresholds or rules and generating alerts based on specific conditions.
Key Features of Monitoring:
1. Metric-driven analysis: Monitoring relies on predefined metrics collected and analyzed to measure system performance, such as CPU usage, memory consumption, response time, or error rates.
2. Alerting and notifications: Monitoring systems generate alerts and notifications when predefined thresholds or rules are violated, enabling teams to take immediate action.
3. Historical analysis: Monitoring systems provide historical data, allowing teams to analyze trends, identify patterns, and make informed decisions based on past performance.
Benefits of Monitoring:
1. Performance optimization: Monitoring helps identify performance bottlenecks and inefficiencies within a system, enabling teams to optimize resources and improve overall system performance.
2. Capacity planning: By monitoring resource utilization and workload patterns, teams can accurately plan for future growth and ensure sufficient resources are available to meet demand.
3. Compliance and SLA enforcement: Monitoring systems help organizations meet compliance requirements and enforce service level agreements (SLAs) by tracking and reporting on key metrics.
Observability & Monitoring: A Unified Approach
While observability and monitoring differ in their approaches and focus, they are not mutually exclusive. When used together, they complement each other and provide a more comprehensive understanding of system behavior.
Observability enables teams to gain deep insights into system behavior, understand complex interactions, and troubleshoot issues effectively. Conversely, monitoring provides a systematic approach to tracking predefined metrics, generating alerts, and ensuring the system meets performance requirements.
Combining observability and monitoring can help organizations create a robust system monitoring and management strategy. This integrated approach empowers teams to quickly detect, diagnose, and resolve issues, improving system reliability, performance, and customer satisfaction.
Application Latency & Cloud Trace
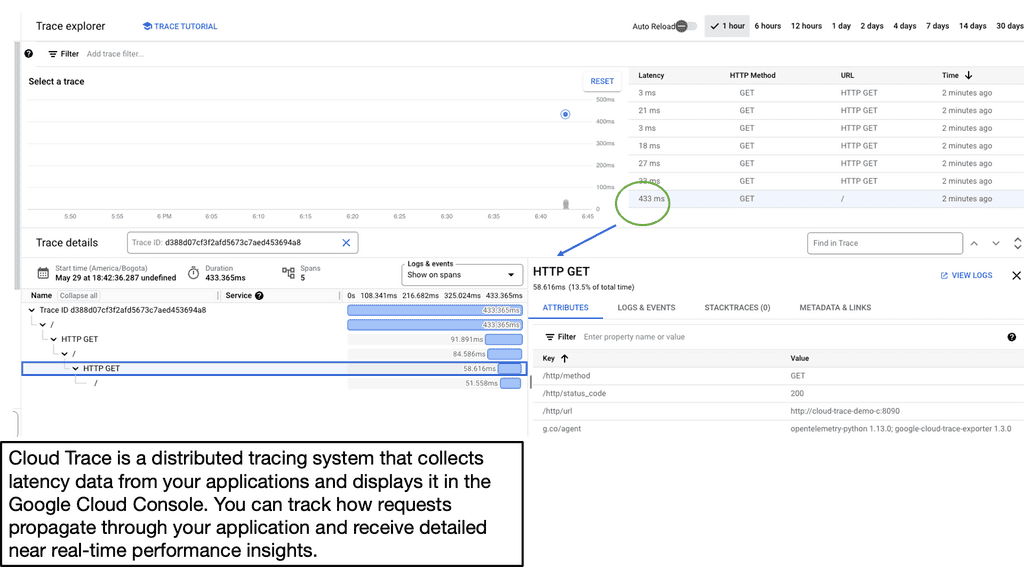
A: – Latency, in simple terms, refers to the delay between sending a request and receiving a response. It can be caused by various factors, such as network congestion, server processing time, or inefficient code execution. Understanding the different components contributing to latency is essential for optimizing application performance.
B: – Google Cloud Trace is a powerful diagnostic tool provided by Google Cloud Platform. It allows developers to visualize and analyze latency data for their applications. By instrumenting code and capturing trace data, developers gain valuable insights into the performance bottlenecks and can take proactive measures to improve latency.
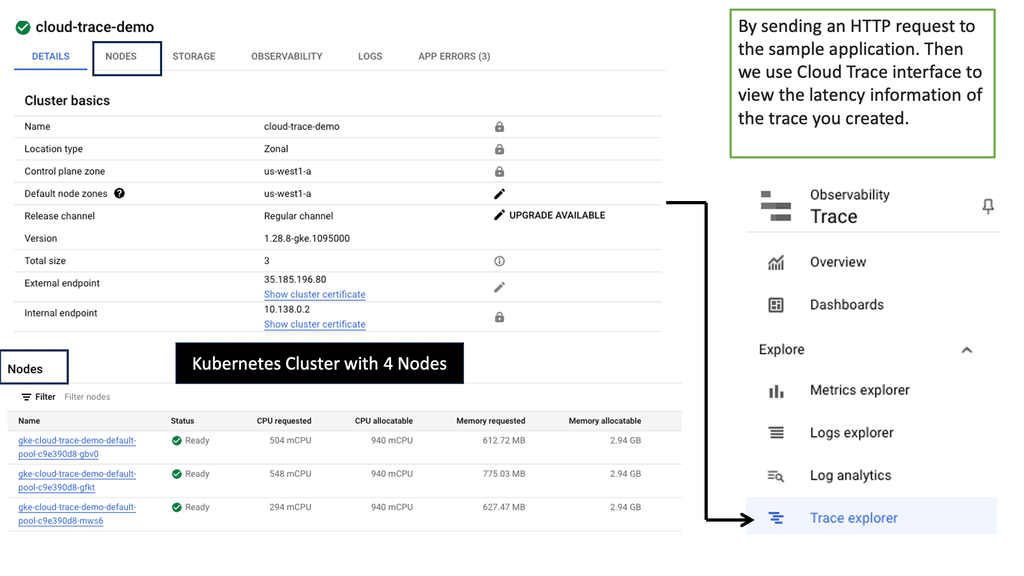
C: – To start capturing traces in your application, you need to integrate the Cloud Trace API into your codebase. Once integrated, Cloud Trace collects detailed latency data, including information about the various services and resources used to process a request. This data can then be visualized and analyzed through the user-friendly Cloud Trace interface.
The Starting Point: Observability vs Monitoring
You need to measure and gather the correct event information in your environment, which will be done with several tools. This will let you know what is affecting your application performance and infrastructure. As a good starting point, there are four golden signals for Latency, saturation, traffic, and errors. These are Google’s Four Golden Signals. The four most important metrics to keep track of are:
- Latency: How long it takes to serve a request
- Traffic: The number of requests being made.
- Errors: The rate of failing requests.
- Saturation: How utilized the service is.
So now we have some guidance on what to monitor and let us apply this to Kubernetes to, for example, let’s say, a frontend web service that is part of a tiered application, we would be looking at the following:
- How many requests is the front end processing at a particular point in time,
- How many 500 errors are users of the service received, and
- Does the request overutilize the service?
We already know that monitoring is a form of evaluation that helps identify the most practical and efficient use of resources. With monitoring, we observe and check the progress or quality of something over time. Within this, we have metrics, logs, and alerts. Each has a different role and purpose.
**Monitoring: The role of metrics**
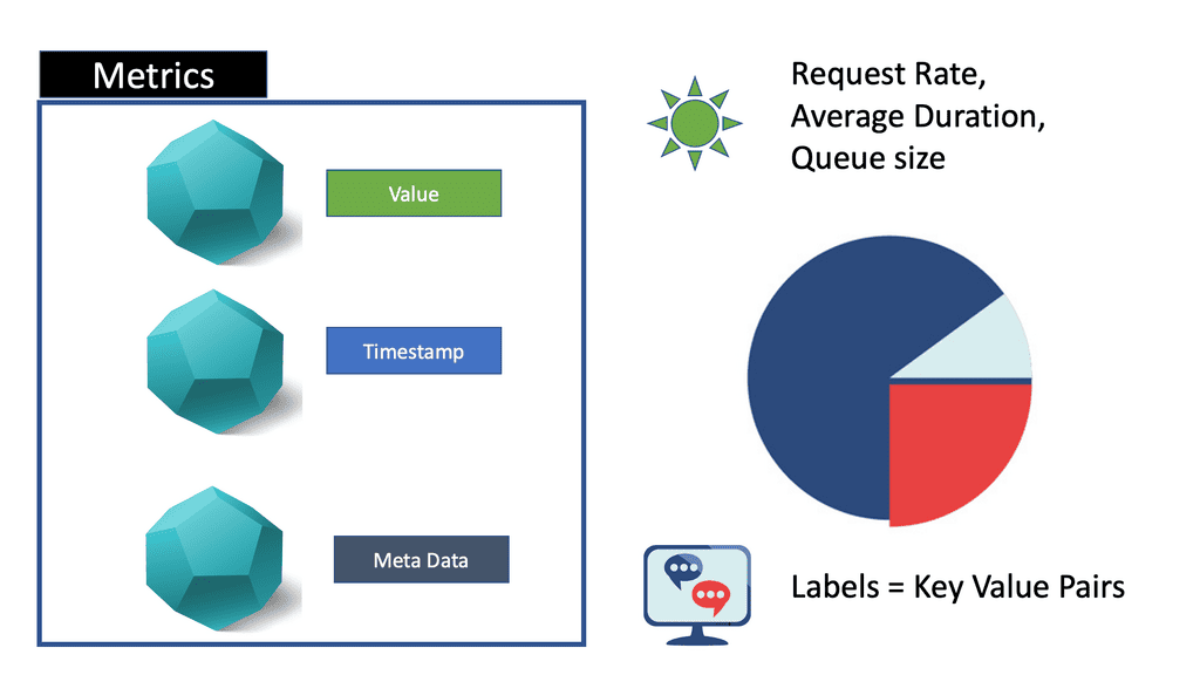
Metrics are related to some entity and allow you to view how many resources you consume. Metric data consists of numeric values instead of unstructured text, such as documents and web pages. Metric data is typically also a time series, where values or measures are recorded over some time.
Available bandwidth and latency are examples of such metrics. Understanding baseline values is essential. Without a baseline, you will not know if something is happening outside the norm.
Note: Average Baselines
What are the average baseline values for bandwidth and latency metrics? Are there any fluctuations in these metrics? How do these values rise and fall during normal operations and peak usage? This may change over different days, weeks, and months.
If you notice a rise in these values during normal operations, this would be deemed abnormal and should act as a trigger that something could be wrong and needs to be investigated. Remember that these values should not be gathered as a once-off but can be gathered over time to understand your application and its underlying infrastructure better.
**Monitoring: The role of logs**
Logging is an essential part of troubleshooting application and infrastructure performance. Logs give you additional information about events, which is important for troubleshooting or discovering the root cause of the events. Logs will have much more detail than metrics, so you will need some way to parse the logs or use a log shipper.
A typical log shipper will take these logs from the standard out in a Docker container and ship them to a backend for processing.
Note: Example Log Shipper
FluentD or Logstash has pros and cons. The group can use it here and send it to a backend database, which could be the ELK stack ( Elastic Search). Using this approach, you can add different things to logs before sending them to the backend. For example, you can add GEO IP information. This will add richer information to the logs that can help you troubleshoot.
Understanding VPC Flow Logs
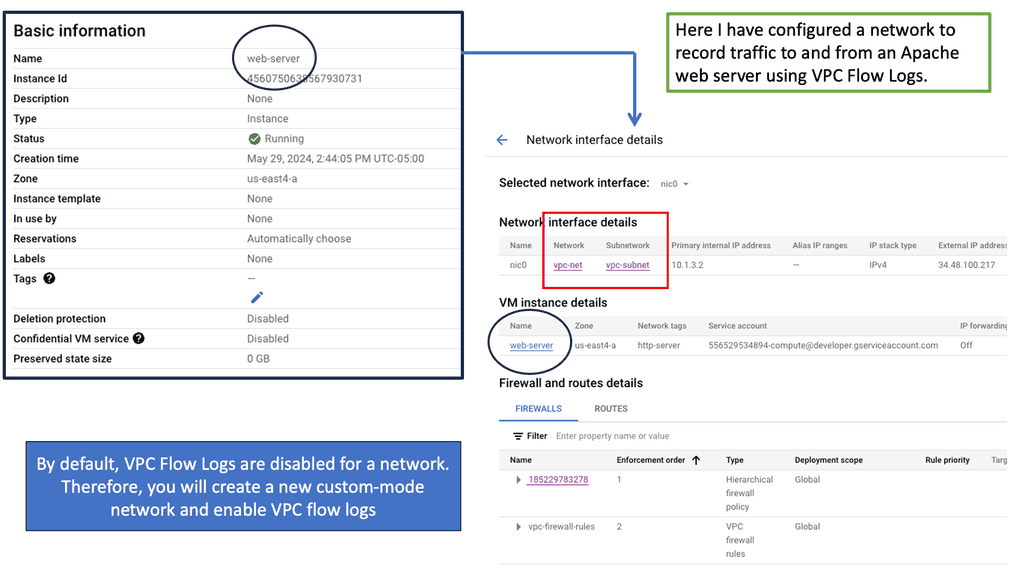
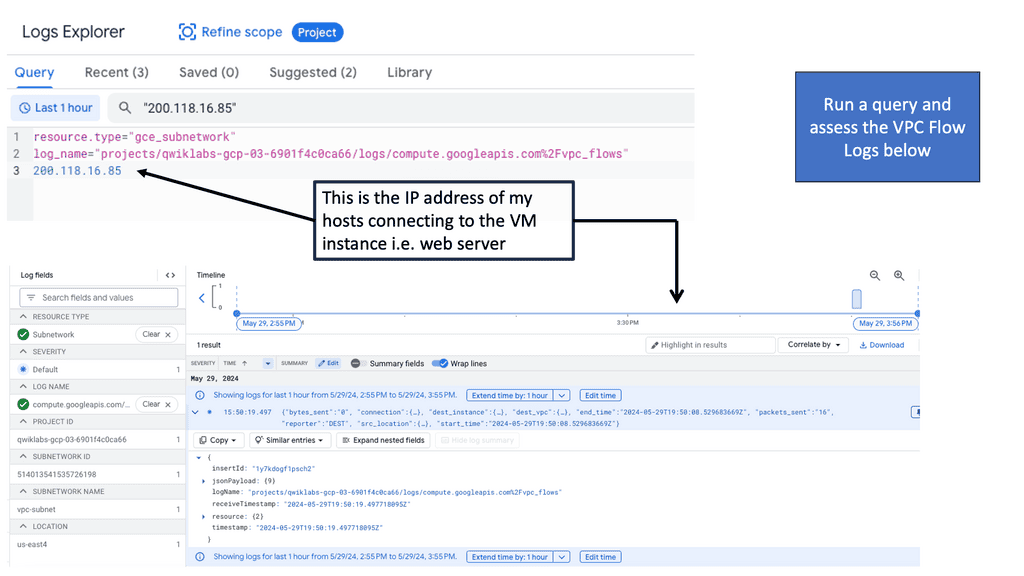
VPC Flow Logs is a feature provided by Google Cloud that captures network traffic metadata within a Virtual Private Cloud (VPC) network. This metadata includes source and destination IP addresses, protocol, port, and more. By enabling VPC Flow Logs, administrators can gain visibility into the network traffic patterns and better understand the communication flow within their infrastructure.
We can leverage data visualization tools to make the analysis more visually appealing and easier to comprehend. Google Cloud provides various options for creating interactive and informative dashboards, such as Data Studio and Cloud Datalab. These dashboards can display network traffic trends, highlight critical metrics, and aid in identifying patterns or anomalies that might require further investigation.
**Monitoring: The role of alerting**
Then we have the alerting, and it would be best to balance how you monitor and what you alert on. So, we know that alerting is not always perfect, and getting the right alerting strategy in place will take time. It’s not a simple day-one installation and requires much effort and cross-team collaboration.
You know that alerting on too much can cause alert fatigue. We are all too familiar with the problems alert fatigue can bring and the tensions it can create in departments.
To minimize this, consider Service Level Objectives (SLOs) for alerts. SLOs are measurable characteristics such as availability, throughput, frequency, and response times. They are the foundation for a reliability stack. Also, it would be best if you considered alert thresholds. If these are too short, you will get a lot of false positives on your alerts.
Monitoring is not enough.
Even with all of these in place, monitoring is not enough. Due to the sheer complexity of today’s landscape, you need to consider and think differently about the tools you use and how you use the intelligence and data you receive from them to resolve issues before they become incidents. That monitoring by itself is not enough.
The tool used to monitor is just a tool that probably does not cross technical domains, and different groups of users will administer each tool without a holistic view. The tools alone can take you only half the way through the journey. Also, what needs to be addressed is the culture and the traditional way of working in silos. A siloed environment can affect the monitoring strategy you want to implement. Here, you can look at an observability platform.
The Foundation of GKE-Native Monitoring
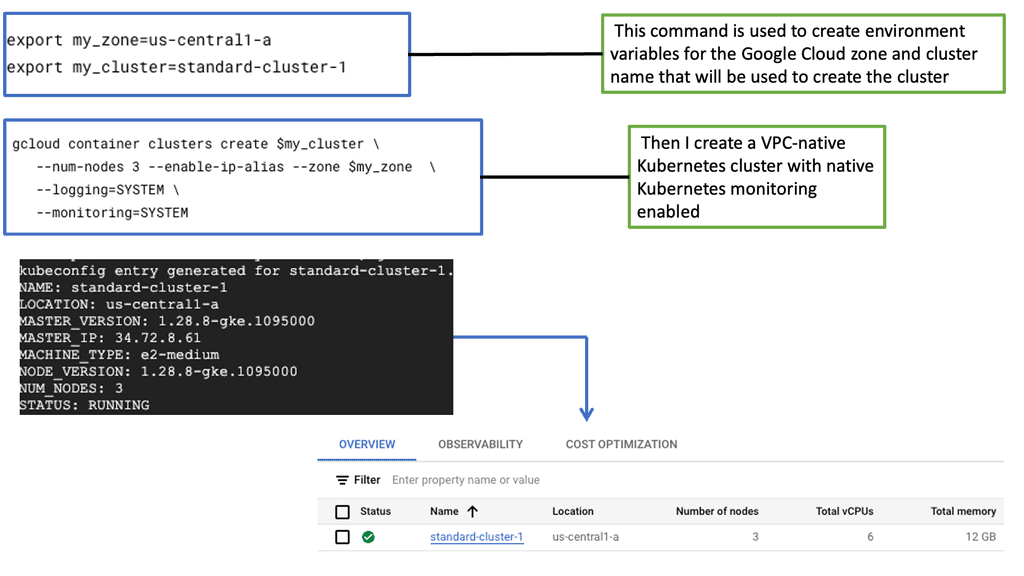
GKE-Native Monitoring builds upon the robust foundation of Prometheus and Stackdriver, providing a seamless integration that simplifies observability within GKE clusters. By harnessing the strengths of these industry-leading monitoring solutions, GKE-Native Monitoring offers a robust and comprehensive monitoring experience.
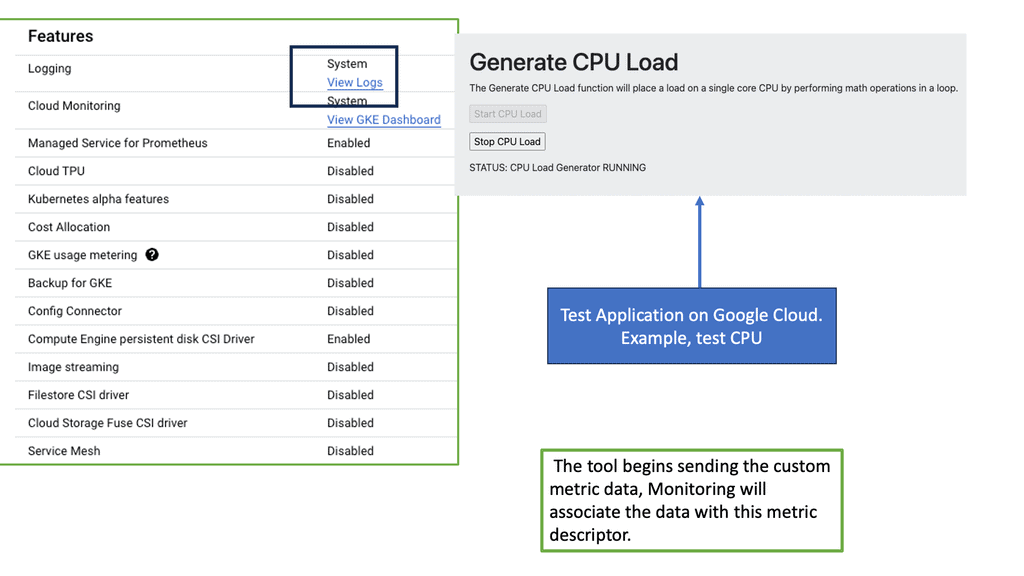
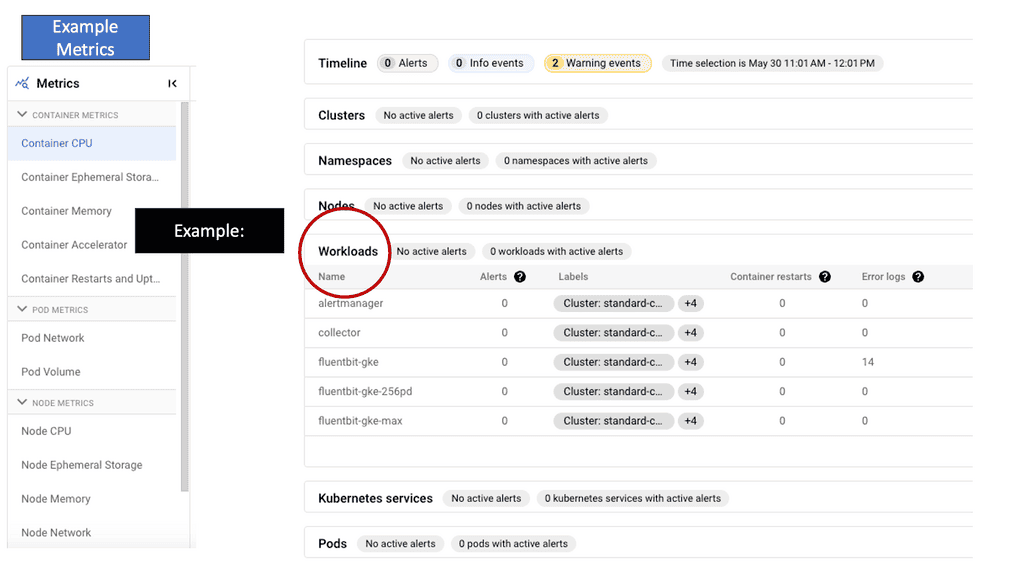
Under the umbrella of GKE-Native Monitoring, users gain access to a rich set of features designed to enable fine-grained visibility and control. These include customizable dashboards, real-time metrics, alerts, and horizontal pod autoscaling. With these tools, developers and operators can easily monitor the health, performance, and resource utilization of their GKE clusters.
Observability vs Monitoring
When it comes to observability vs. monitoring, we know that monitoring can detect problems and tell you if a system is down, and when your system is UP, Monitoring doesn’t care. Monitoring only cares when there is a problem. The problem has to happen before monitoring takes action. It’s very reactive. So, if everything is working, monitoring doesn’t care.
On the other hand, we have an observability platform, which is a more proactive practice. It’s about what and how your system and services are doing. Observability lets you improve your insight into how complex systems work and quickly get to the root cause of any problem, known or unknown.
Observability is best suited for interrogating systems to explicitly discover the source of any problem, along any dimension or combination of dimensions, without first predicting. This is a proactive approach.
## Pillars of Observability
This is achieved by combining logs, metrics, and traces. So, we need data collection, storage, and analysis across these domains while also being able to perform alerting on what matters most. Let’s say you want to draw correlations between units like TCP/IP packets and HTTP errors experienced by your app.
The Observability platform pulls context from different sources of information, such as logs, metrics, events, and traces, into one central context. Distributed tracing adds a lot of value here.
Also, when everything is placed into one context, you can quickly switch between the necessary views to troubleshoot the root cause. Viewing these telemetry sources with one single pane of glass is an excellent key component of any observability system.
## Known and Unknown vs Unknown and Unknown
Monitoring automatically reports whether known failure conditions are occurring or are about to occur. In other words, it is optimized for reporting on unknown conditions about known failure modes, which are referred to as known unknowns. In contrast, Observability is centered around discovering if and why previously unknown failure modes may be occurring, in other words, to find unknown unknowns.
The monitoring-based approach of metrics and dashboards is an investigative practice that relies on humans’ experience and intuition to detect and understand system issues. This is okay for a simple legacy system that fails in predictable ways, but the instinctual technique falls short for modern systems that fail in unpredictable ways.
With modern applications, the complexity and scale of their underlying systems quickly make that approach unattainable, and we can’t rely on hunches. Observability tools differ from traditional monitoring tools because they enable engineers to investigate any system, no matter how complex. You don’t need to react to a hunch or have intimate system knowledge to generate a hunch.
Monitoring vs Observability: Working together?
Monitoring helps engineers understand infrastructure concerns, while observability helps engineers understand software concerns. So, Observability and Monitoring can work together. First, the infrastructure does not change too often, and when it fails, it will fail more predictably. So, we can use monitoring here.
This is compared to software system states that change daily and are unpredictable. Observability fits this purpose. The conditions that affect infrastructure health change infrequently and are relatively more straightforward to predict.
We have several well-established practices to expect, such as capacity planning and the ability to remediate automatically (e.g., auto-scaling in a Kubernetes environment). All of these can be used to tackle these types of known issues.
Monitoring and infrastructure problems
Due to its relatively predictable and slowly changing nature, the aggregated metrics approach monitors and alerts perfectly for infrastructure problems. So here, a metric-based system works well. Metrics-based systems and their associated alerts help you see when capacity limits or known error conditions of underlying systems are being reached.
Now, we need to look at monitoring the Software and have access to high-cardinality fields. These may include the user ID or a shopping cart ID. Code that is well-instrumented for Observability allows you to answer complex questions that are easy to miss when examining aggregate performance.
Observability and monitoring are essential practices in modern software development and operations. While observability focuses on understanding system behaviour through comprehensive data collection and analysis, monitoring uses predefined metrics to assess performance and generate alerts.
By leveraging both approaches, organizations can gain a holistic view of their systems, enabling proactive measures, faster troubleshooting, and optimal performance. Embracing observability and monitoring as complementary practices can pave the way for more reliable, scalable, and efficient systems in the digital era.
Understanding Monitoring & Observability
A: Understanding Monitoring: Monitoring collects data and metrics from a system to track its health and performance. It involves setting up various tools and agents that continuously observe and report on predefined parameters. These parameters include resource utilization, response times, and error rates. Monitoring provides real-time insights into the system’s behavior and helps identify potential issues or bottlenecks.
B: Unveiling Observability: Observability goes beyond traditional monitoring by understanding the system’s internal state and cause-effect relationships. It aims to provide a holistic view of the system’s behavior, even in unexpected scenarios. Observability encompasses three main pillars: logs, metrics, and traces. Logs capture detailed events and activities, metrics quantify system behavior over time, and traces provide end-to-end transaction monitoring. By combining these pillars, observability enables deep system introspection and efficient troubleshooting.
C: The Power of Contextual Insights: One of the key advantages of observability is its ability to provide contextual insights. Traditional monitoring may alert you when a specific metric exceeds a threshold, but it often lacks the necessary context to debug complex issues. With its comprehensive data collection and correlation capabilities, Observability allows engineers to understand the context surrounding a problem. Contextual insights help in root cause analysis, reducing mean time to resolution and improving overall system reliability.
D: The Role of Automation: Automation plays a crucial role in monitoring and observability. In monitoring, automation can help set up alerts, generate reports, and scale the monitoring infrastructure. On the other hand, observability requires automated instrumentation and data collection to handle the vast amount of information generated by modern systems. Automation enables engineers to focus on analyzing insights rather than spending excessive time on data collection and processing.
**Observability: The First Steps**
The first step towards achieving modern observability is to gather metrics, traces, and logs. From the collected data points, observability aims to generate valuable outcomes for decision-making. The decision-making process goes beyond resolving problems as they arise. Next-generation observability goes beyond application remediation, focusing on creating business value to help companies achieve their operational goals. This decision-making process can be enhanced by incorporating user experience, topology, and security data.
**Observability Platform**
A full-stack observability platform monitors every monitored host in your environment. Depending on the technologies used, an average of 500 metrics are generated per computational node. AWS, Azure, Kubernetes, and VMware Tanzu are some platforms that use observability to collect important key performance metrics for services and real-user monitored applications.
Within a microservices environment, dozens, if not hundreds, of microservices call one another. Distributed tracing can help you understand how the different services connect and how your requests flow.
**Pillars of Observability**
The three pillars of observability form a strong foundation for making data-driven decisions, but there are opportunities to extend observability. User experience and security details must be considered to gain a deeper understanding. A holistic, context-driven approach to advanced observability enables proactively addressing potential problems before they arise.
**The Role of Monitoring**
To understand the difference between observability and monitoring, we need first to discuss the role of monitoring. Monitoring is the evaluation that helps identify the most practical and efficient use of resources. So, the big question I put to you is what to monitor. This is the first step to preparing a monitoring strategy.
To fully understand if monitoring is enough or if you need to move to an observability platform, ask yourself a couple of questions. Firstly, consider what you should be monitoring, why you should be monitoring it, and how you should be monitoring it.
Observability vs Monitoring
Observability tells you why something is happening. Monitoring tells you what is happening.
This is one of the most important distinctions in modern systems — especially for cloud, microservices, Kubernetes, SD‑WAN, and SASE environments. Below is a structured, high‑clarity breakdown you can drop directly into your architecture notes or blog.
Concise Takeaway
Monitoring detects known problems using predefined dashboards and alerts. Observability lets you ask new questions and debug unknown problems using correlated metrics, logs, and traces.
Core Difference
Monitoring
Answers known questions
Uses predefined alerts
Focuses on symptoms
Works well for static systems
Example: “CPU > 80% — alert.”
Observability
Answers unknown questions
Uses rich telemetry (metrics, logs, traces)
Focuses on root cause
Works for dynamic, distributed systems
Example: “Why did latency spike only for users in Dublin?”
Key Components Compared
Monitoring Components
Dashboards
Threshold Alerts
Health Checks
Basic Metrics (CPU, memory, disk)
Monitoring is about detecting failures.
Observability Components
Metrics
Logs
Traces
Correlation
Context Propagation
SLOs
Observability is about understanding system behavior.
Why Observability Is More Powerful
Observability allows engineers to:
debug issues without adding new dashboards
trace requests across microservices
correlate identity, network, and application behavior
understand cloud and SaaS performance
detect anomalies before users notice
support auto‑scaling and SLO‑driven reliability
troubleshoot SD‑WAN and SASE path issues
Monitoring cannot do this because it only sees surface‑level symptoms.
Modern Architecture Context
In Microservices
Monitoring: “Service A is slow.” Observability: “Service A is slow because Service B’s database is overloaded.”
In Kubernetes
Monitoring: “Pod restart count is high.” Observability: “Pod restarts are caused by node pressure triggered by a spike in p99 latency.”
In SD‑WAN / SASE
Monitoring: “Packet loss detected.” Observability: “Packet loss is caused by ISP congestion between Dublin and London, impacting Zoom traffic.”
In Cloud
Monitoring: “API error rate increased.” Observability: “API errors correlate with IAM permission failures after a misconfigured deployment.”
Outcome
Observability delivers:
faster root‑cause analysis
better reliability
stronger SLO enforcement
improved user experience
deeper insight into distributed systems
intelligent auto‑scaling decisions
unified visibility across cloud, SD‑WAN, and SASE
Monitoring alone is no longer enough — observability is the foundation of modern operations.
Observability & Service Mesh
What is a Cloud Service Mesh?
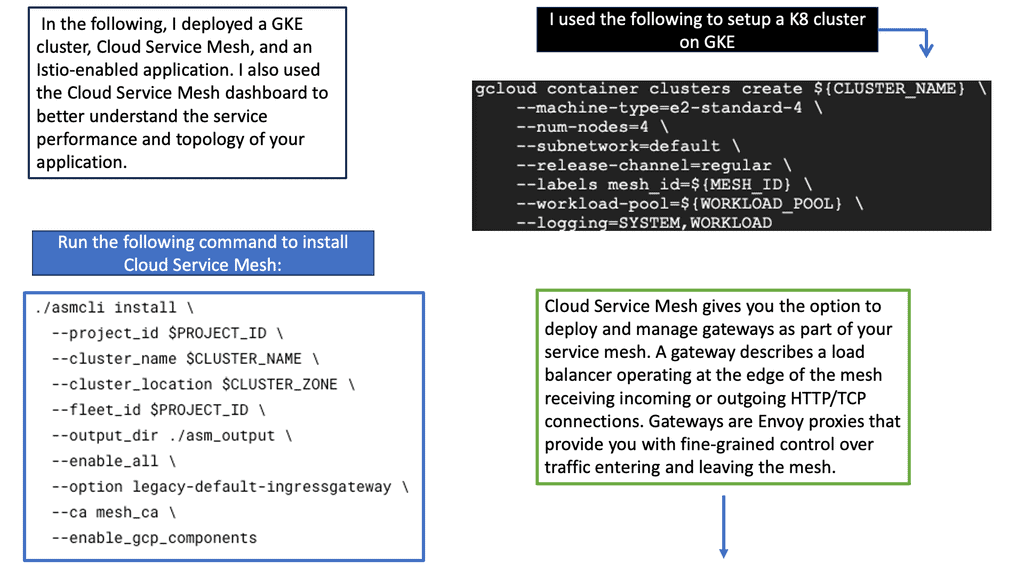
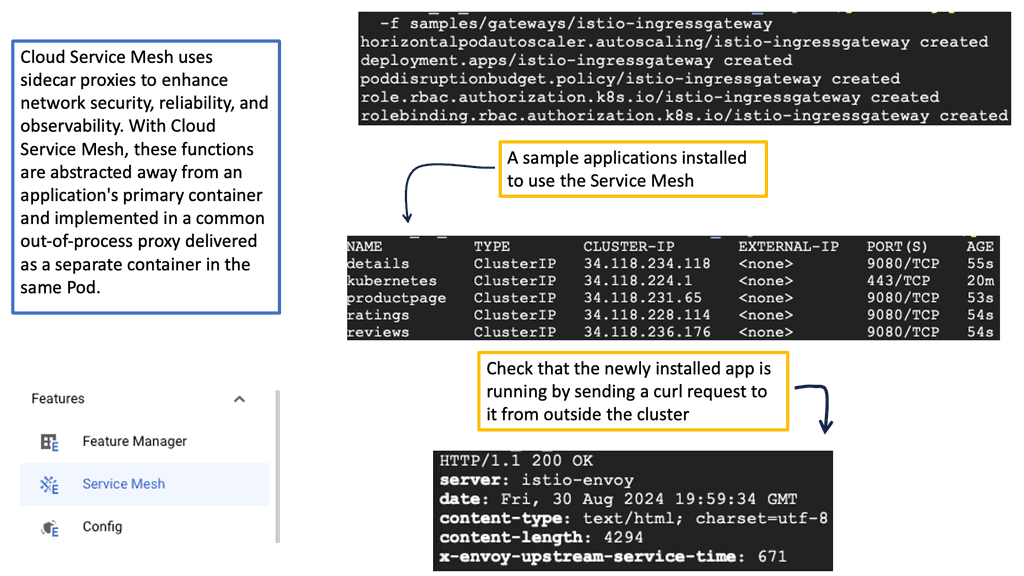
A Cloud Service Mesh is a design pattern that helps manage and secure microservices interactions. Essentially, it acts as a dedicated layer for controlling the network traffic between microservices. By introducing a service mesh, developers can offload much of the responsibility for service communication from the application code itself, making the entire system more resilient and easier to manage.
### Key Benefits of Implementing a Cloud Service Mesh
#### Enhanced Security
One of the primary advantages of a Cloud Service Mesh is the enhanced security it offers. With features like mutual TLS (mTLS) for encrypting communications between services, a service mesh ensures that data is protected as it travels through the network. This is particularly important in a multi-cloud or hybrid cloud environment where services might be spread across different platforms.
#### Improved Observability
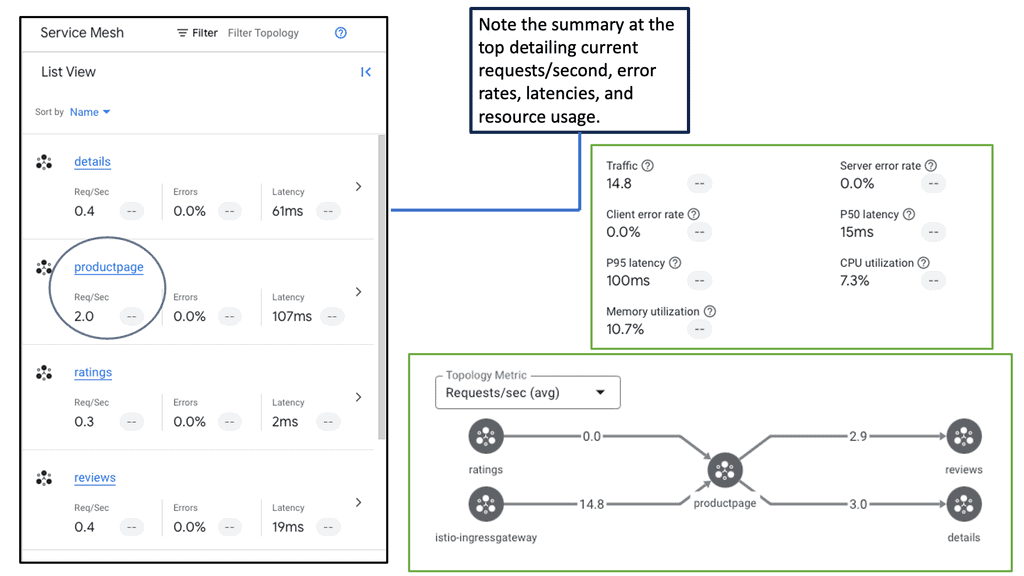
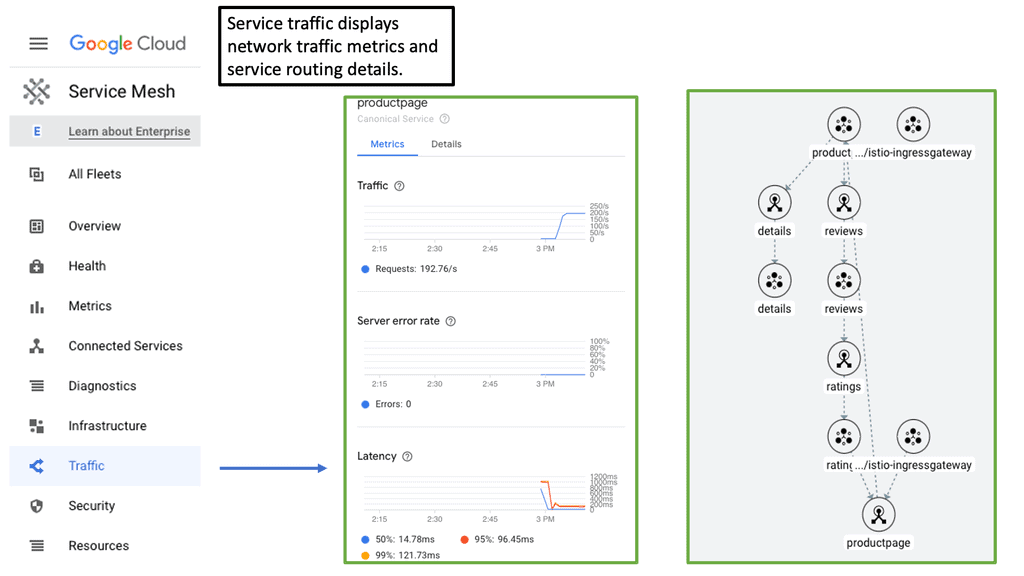
Observability is another critical benefit. A Cloud Service Mesh provides granular insights into service performance, helping developers identify and troubleshoot issues quickly. Metrics, logs, and traces are collected systematically, offering a comprehensive view of the entire microservices ecosystem.
#### Traffic Management
Managing traffic between services becomes significantly easier with a Cloud Service Mesh. Features like load balancing, traffic splitting, and failover mechanisms are built-in, ensuring that service-to-service communication remains efficient and reliable. This is particularly beneficial for applications requiring high availability and low latency.
### Popular Cloud Service Mesh Solutions
Several solutions have emerged as leaders in the Cloud Service Mesh space. Istio, Linkerd, and Consul are among the most popular options, each offering unique features and benefits. Istio, for example, is known for its robust policy enforcement and telemetry capabilities, while Linkerd is praised for its simplicity and performance. Consul, on the other hand, excels in multi-cloud environments, providing seamless service discovery and configuration.
### Challenges and Considerations
While the benefits are compelling, implementing a Cloud Service Mesh is not without its challenges. Complexity can be a significant hurdle, particularly for organizations new to microservices architecture. The additional layer of infrastructure requires careful planning and management. Moreover, there is a learning curve associated with configuring and maintaining a service mesh, which can impact development timelines.
Example Product: Cisco AppDynamics
### Real-Time Monitoring: Keeping an Eye on Your Applications
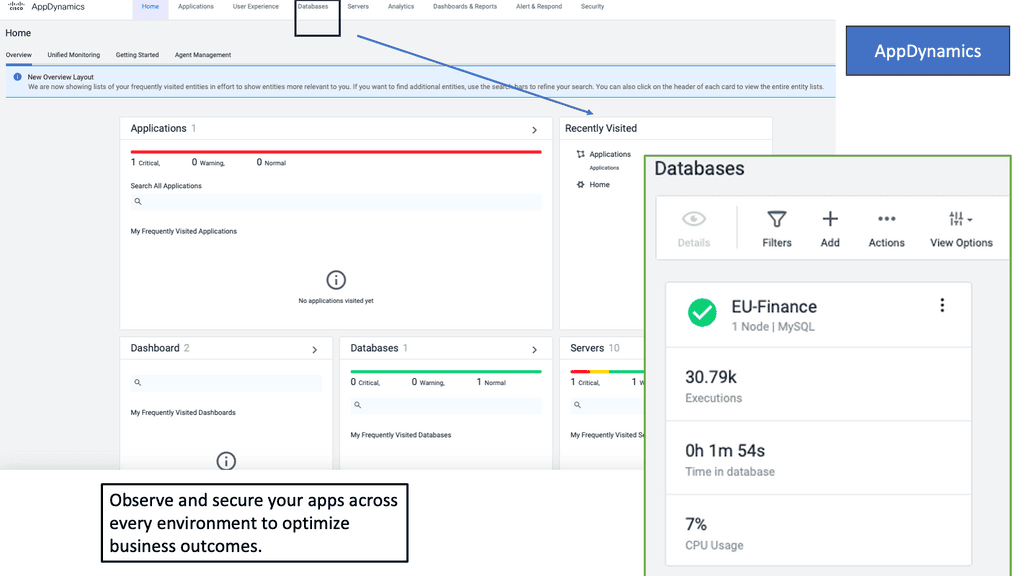
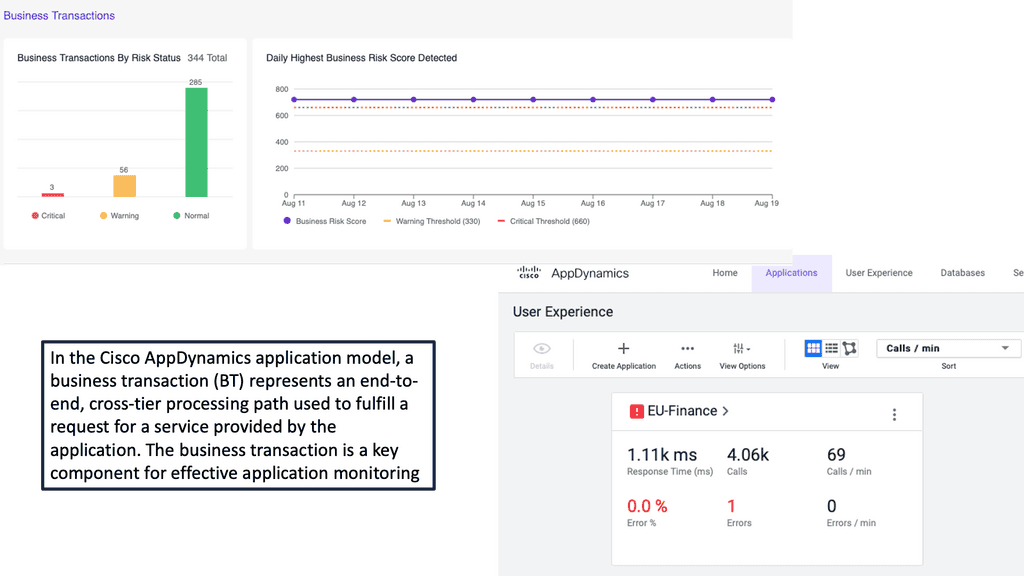
One of the standout features of Cisco AppDynamics is its real-time monitoring capabilities. By continuously tracking the performance of your applications, AppDynamics provides instant insights into any issues that may arise. This allows businesses to quickly identify and address performance bottlenecks, ensuring that their applications remain responsive and reliable. Whether it’s tracking transaction times, monitoring server health, or keeping an eye on user interactions, Cisco AppDynamics provides a comprehensive view of your application’s performance.
### Advanced Analytics: Turning Data into Actionable Insights
Data is the lifeblood of modern businesses, and Cisco AppDynamics excels at turning raw data into actionable insights. With its advanced analytics engine, AppDynamics can identify patterns, trends, and anomalies in your application’s performance data. This empowers businesses to make informed decisions, optimize their applications, and proactively address potential issues before they impact users. From root cause analysis to predictive analytics, Cisco AppDynamics provides the tools you need to stay ahead of the curve.
### Comprehensive Diagnostics: Troubleshooting Made Easy
When performance issues do arise, Cisco AppDynamics makes troubleshooting a breeze. Its comprehensive diagnostics capabilities allow you to drill down into every aspect of your application’s performance. Whether it’s identifying slow database queries, pinpointing code-level issues, or tracking down problematic user interactions, AppDynamics provides the detailed information you need to resolve issues quickly and efficiently. This not only minimizes downtime but also ensures a seamless user experience.
### Enhancing User Experiences: The Ultimate Goal
At the end of the day, the ultimate goal of any application is to provide a positive user experience. Cisco AppDynamics helps businesses achieve this by ensuring that their applications are always performing at their best. By providing real-time monitoring, advanced analytics, and comprehensive diagnostics, AppDynamics enables businesses to deliver fast, reliable, and engaging applications that keep users coming back for more. In a competitive digital landscape, this can be the difference between success and failure.
Google Cloud Monitoring
Example: What is Ops Agent?
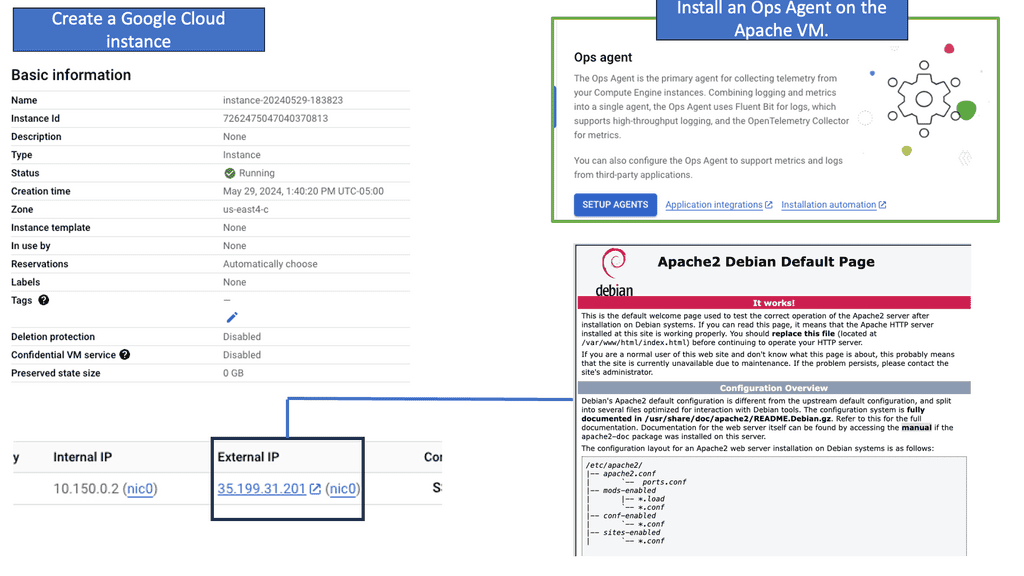
Ops Agent is a lightweight, flexible monitoring agent explicitly designed for Compute Engine instances. It allows you to collect and analyze essential metrics and logs from your virtual machines, providing valuable insights into your infrastructure’s health, performance, and security.
To start monitoring your Compute Engine instance with Ops Agent, you must install and configure it properly. The installation process is straightforward and can be done through the Google Cloud Console or the command line. Once installed, you can configure Ops Agent to collect specific metrics and logs based on your requirements.
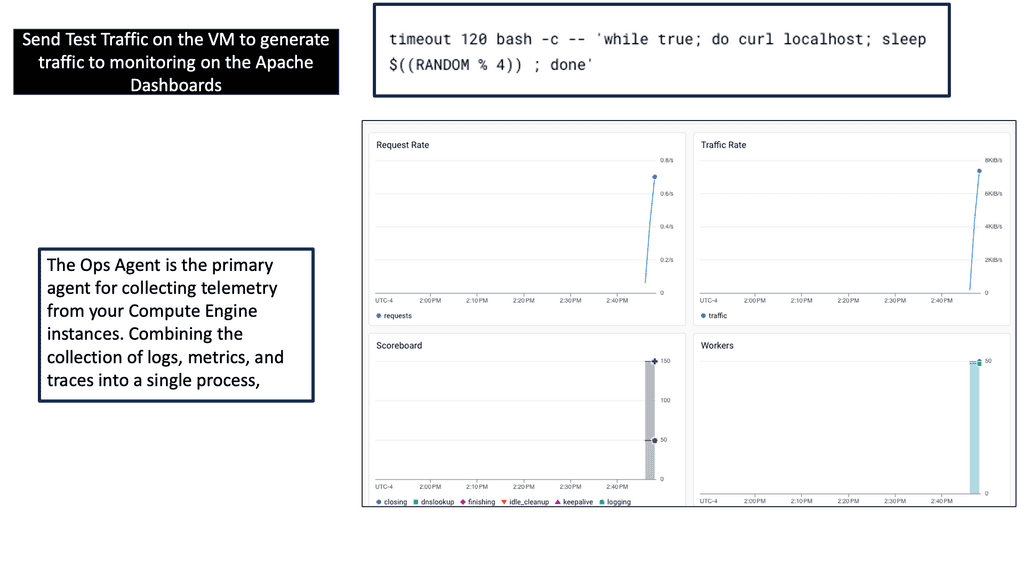
Ops Agent offers a wide range of metrics and logs that can be collected and monitored. These include system-level metrics like CPU and memory usage, network traffic, disk I/O, and more. Additionally, Ops Agent allows you to gather application-specific metrics and logs, providing deep insights into the performance and behavior of your applications running on the Compute Engine instance.
 Options: Open source or commercial
Knowing this lets you move into the different tools and platforms available. Some of these tools will be open source, and others commercial. When evaluating these tools, one word of caution: does each tool work in a silo, or can it be used across technical domains? Silos are breaking agility in every form of technology.