Baseline Engineering
In today's fast-paced digital landscape, network performance plays a vital role in ensuring seamless connectivity and efficient operations. Network baseline engineering is a powerful technique that allows organizations to establish a solid foundation for optimizing network performance, identifying anomalies, and planning for future scalability. In this blog post, we will explore the ins and outs of network baseline engineering and its significant benefits.
Network baseline engineering is the process of establishing a benchmark or reference point for network performance metrics. By monitoring and analyzing network traffic patterns, bandwidth utilization, latency, and other key parameters over a specific period, organizations can create a baseline that represents the normal behavior of their network. This baseline becomes a crucial reference for detecting deviations, troubleshooting issues, and capacity planning.
Proactive Issue Detection: One of the primary advantages of network baseline engineering is the ability to proactively detect and address network issues. By comparing real-time network performance against the established baseline, anomalies and deviations can be quickly identified. This allows network administrators to take immediate action to resolve potential problems before they escalate and impact user experience.
Improved Performance Optimization: With a solid network baseline in place, organizations can gain valuable insights into network performance patterns. This information can be leveraged to fine-tune configurations, optimize resource allocation, and enhance overall network efficiency. By understanding the normal behavior of the network, administrators can make informed decisions to improve performance and provide a seamless user experience.
Data Collection: The first step in network baseline engineering is collecting relevant data, including network traffic statistics, bandwidth usage, application performance, and other performance metrics. This data can be obtained from network monitoring tools, SNMP agents, flow analyzers, and other network monitoring solutions.
Data Analysis and Baseline Creation: Once the data is collected, it needs to be analyzed to identify patterns, trends, and normal behavior. Statistical analysis techniques, such as mean, median, and standard deviation, can be applied to determine the baseline values for various performance parameters. This process may involve using specialized software or network monitoring platforms.
Maintaining and Updating the Network Baseline: Networks are dynamic environments, and their behavior can change over time due to various factors such as increased user demands, infrastructure upgrades, or new applications. It is essential to regularly review and update the network baseline to reflect these changes accurately. By periodically reevaluating the baseline, organizations can ensure its relevance and effectiveness in capturing the network's current behavior.
Network baseline engineering is a fundamental practice that empowers organizations to better understand, optimize, and maintain their network infrastructure. By establishing a reliable baseline, organizations can proactively detect issues, enhance performance, and make informed decisions for future network expansion. Embracing network baseline engineering sets the stage for a robust and resilient network that supports the ever-growing demands of the digital age.
Matt Conran
Highlights: Baseline Engineering
1. Understanding Baseline Engineering
Baseline engineering serves as the bedrock for any engineering project. It involves creating a reference point or baseline from which all measurements, evaluations, and improvements are made. By establishing this starting point, engineers gain insights into the project’s progress, performance, and potential deviations from the original plan.
Baseline engineering follows a systematic and structured approach. It starts with defining project objectives and requirements, then data collection and analysis. This data provides a snapshot of the initial conditions and helps engineers set realistic targets and benchmarks. Through careful monitoring and periodic assessments, deviations from the baseline can be detected early, enabling timely corrective actions.
2. Traditional Network Infrastructure
Baseline Engineering was easy in the past; applications ran in single private data centers, potentially two data centers for high availability. There may have been some satellite PoPs, but generally, everything was housed in a few locations. These data centers were on-premises, and all components were housed internally. As a result, troubleshooting, monitoring, and baselining any issues was relatively easy. The network and infrastructure were pretty static, the network and security perimeters were known, and there weren’t many changes to the stack, for example, daily.
3. Distributed Applications
However, nowadays, we are in a completely different environment. We have distributed applications with components/services located in many other places and types of places, on-premises and in the cloud, with dependencies on both local and remote services. We span multiple sites and accommodate multiple workload types.
In comparison to the monolith, today’s applications have many different types of entry points to the external world. All of this calls for the practice of Baseline Engineering and Chaos engineering kubernetes so you can fully understand your infrastructure and scaling issues.
Managed Instance Groups
**Introduction to Managed Instance Groups**
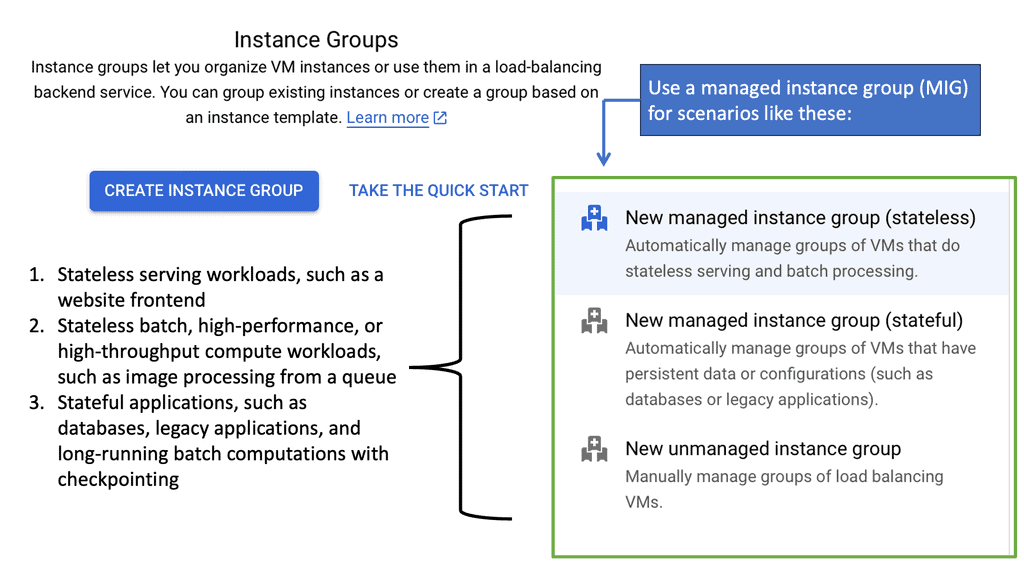
In the fast-evolving world of cloud computing, maintaining scalability, reliability, and efficiency is essential. Managed instance groups (MIGs) on Google Cloud offer an innovative solution to achieve these goals. Whether you’re a seasoned cloud engineer or new to the Google Cloud ecosystem, understanding MIGs can significantly enhance your infrastructure management capabilities.
—
**The Role of Managed Instance Groups in Baseline Engineering**
Baseline engineering focuses on establishing a stable foundation for software development and operations. Managed instance groups play a crucial role in this process by automating the deployment and scaling of virtual machines (VMs). By setting up MIGs, baseline engineering can achieve consistent performance, reduce manual intervention, and enhance the system’s resilience to changes in demand. This automation allows engineers to focus on optimizing and innovating rather than maintaining infrastructure.
—
**Automating Scalability and Load Balancing**
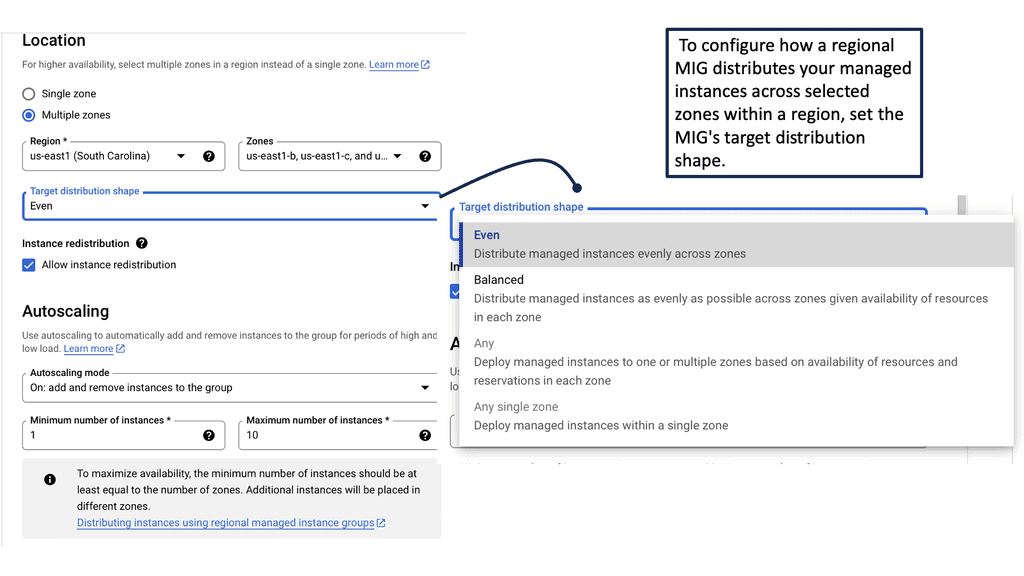
One of the standout features of managed instance groups is their ability to automate scalability and load balancing. As your application experiences varying levels of traffic, MIGs automatically adjust the number of instances to meet the demand. This capability ensures that your application remains responsive and cost-efficient, as you only use the resources you need. Additionally, Google Cloud’s load balancing solutions work seamlessly with MIGs, distributing traffic evenly across instances to maintain optimal performance.
—
**Achieving Reliability with Health Checks and Autohealing**
Reliability is a cornerstone of any cloud-based application, and managed instance groups provide robust mechanisms to ensure it. Through health checks, MIGs continuously monitor the status of your VMs. If an instance fails or becomes unhealthy, the autohealing feature kicks in, replacing it with a new, healthy instance. This proactive approach minimizes downtime and maintains service continuity, contributing to a more reliable application experience for end-users.
—
**Optimizing Costs with Managed Instance Groups**
Cost management is a critical consideration in cloud computing, and managed instance groups help optimize expenses. By automatically scaling the number of instances based on demand, MIGs eliminate the need for overprovisioning resources. This dynamic resource allocation ensures that you are only paying for the compute capacity you need. Moreover, when combined with Google Cloud’s pricing models, such as sustained use discounts and committed use contracts, MIGs allow for significant cost savings.
Google Data Centers – Service Mesh
**What is Cloud Service Mesh?**
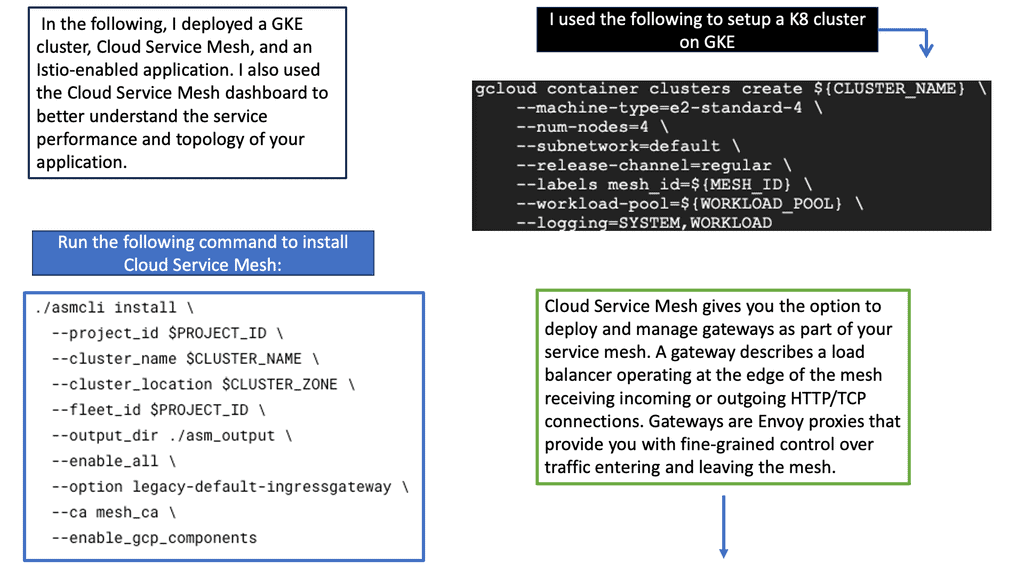
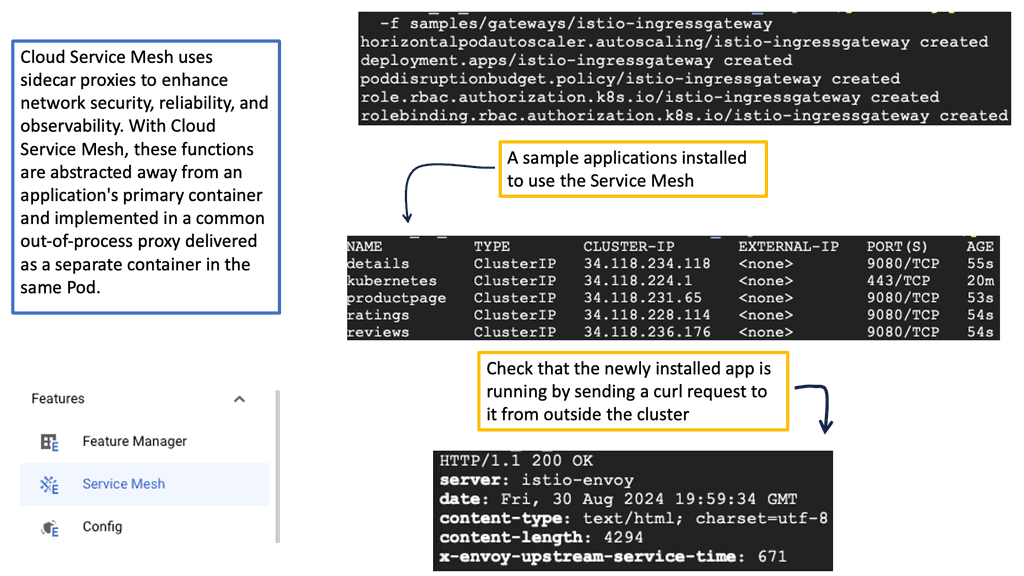
A cloud service mesh is a dedicated infrastructure layer designed to manage service-to-service communication within a microservices architecture. It provides a way to control how different parts of an application share data with one another. Essentially, it acts as a network of microservices that make up cloud applications and ensures that communication between services is secure, fast, and reliable.
**Benefits of Cloud Service Mesh**
1. **Enhanced Security**: One of the primary advantages of a cloud service mesh is the improved security it offers. By managing communication between services, it can enforce security policies, authenticate service requests, and encrypt data in transit. This reduces the risk of data breaches and unauthorized access.
2. **Increased Reliability**: Cloud service meshes enhance the reliability of service interactions. They provide load balancing, traffic routing, and failure recovery, ensuring that services remain available even in the face of failures. This is particularly crucial for applications that require high availability and resilience.
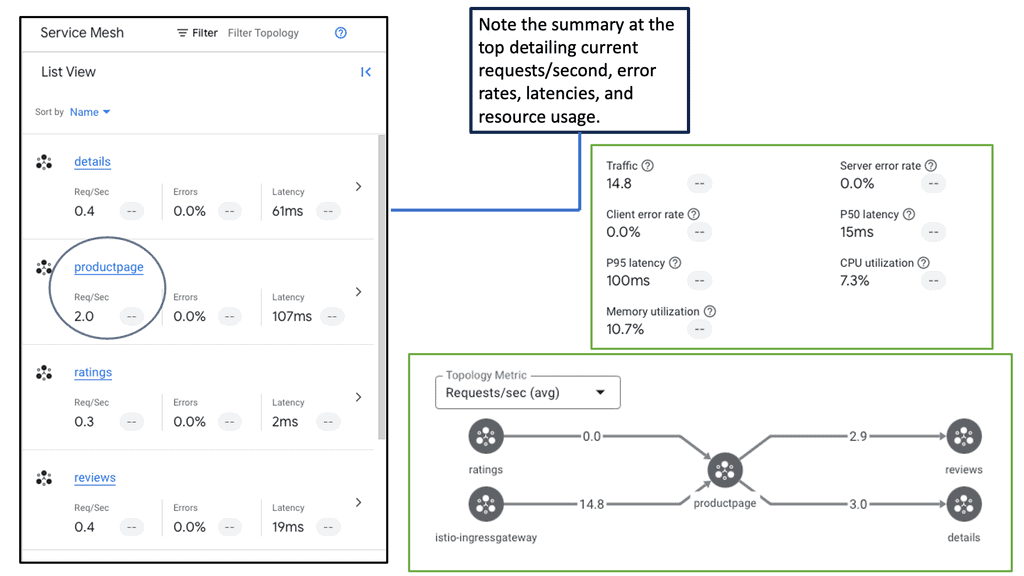
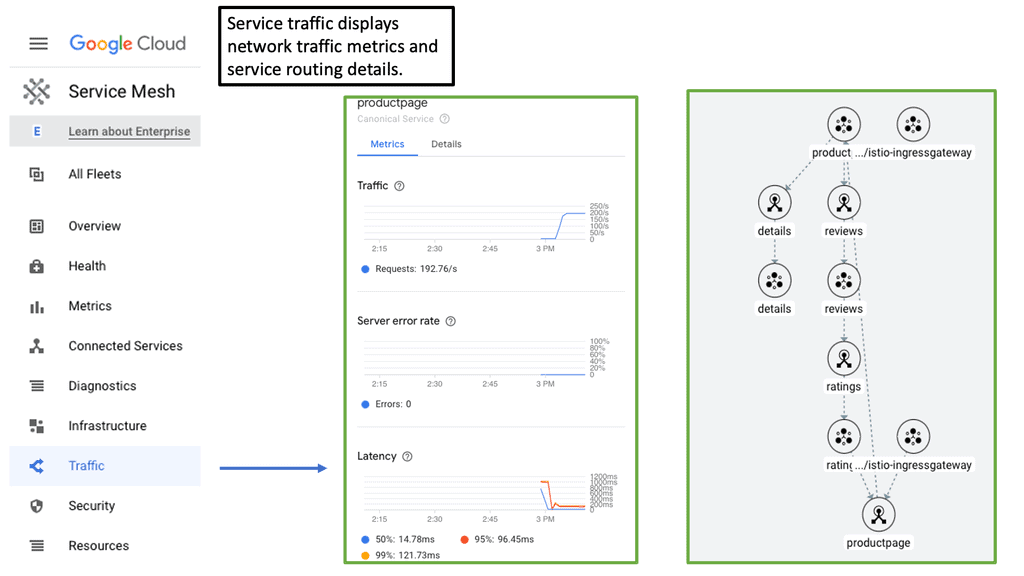
3. **Improved Observability**: With a cloud service mesh, engineering teams can gain greater visibility into the interactions between services. This includes monitoring performance metrics, logging, and tracing requests. Such observability helps in identifying and troubleshooting issues more efficiently, leading to faster resolution times.
**Impact on Baseline Engineering**
Baseline engineering involves establishing a standard level of performance, security, and reliability for an organization’s infrastructure. The introduction of a cloud service mesh has significantly impacted this field by providing a more robust foundation for managing microservices. Here’s how:
1. **Standardization**: Cloud service meshes help in standardizing the way services communicate, making it easier to maintain consistent performance across the board. This is especially important in complex systems with numerous interdependent services.
2. **Automation**: Many cloud service meshes come with built-in automation capabilities, such as automatic retries, circuit breaking, and service discovery. This reduces the manual effort required to manage service interactions, allowing engineers to focus on more strategic tasks.
3. **Scalability**: By managing service communication more effectively, cloud service meshes enable organizations to scale their applications more easily. This is crucial for businesses that experience varying levels of demand and need to adjust their resources accordingly.
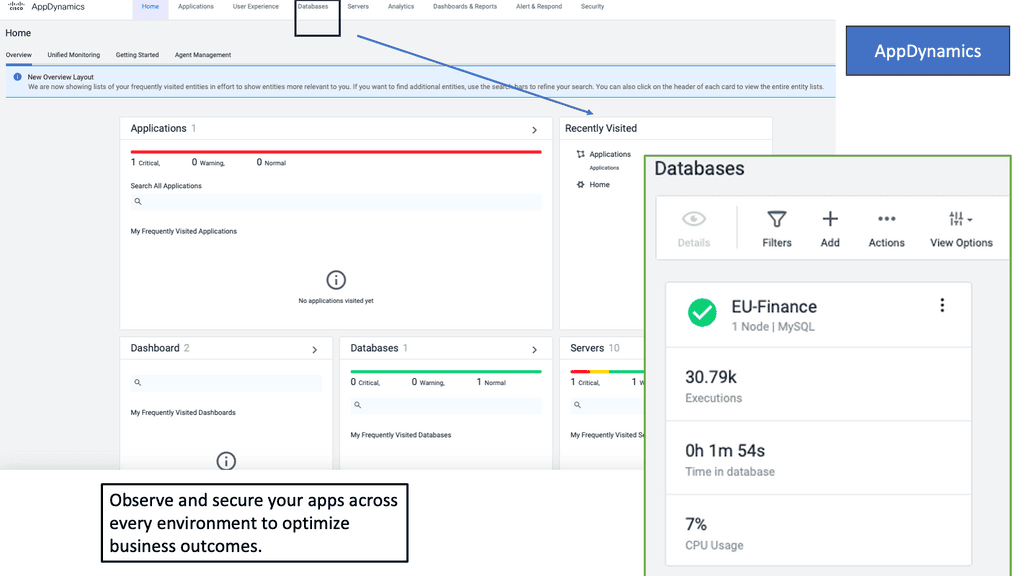
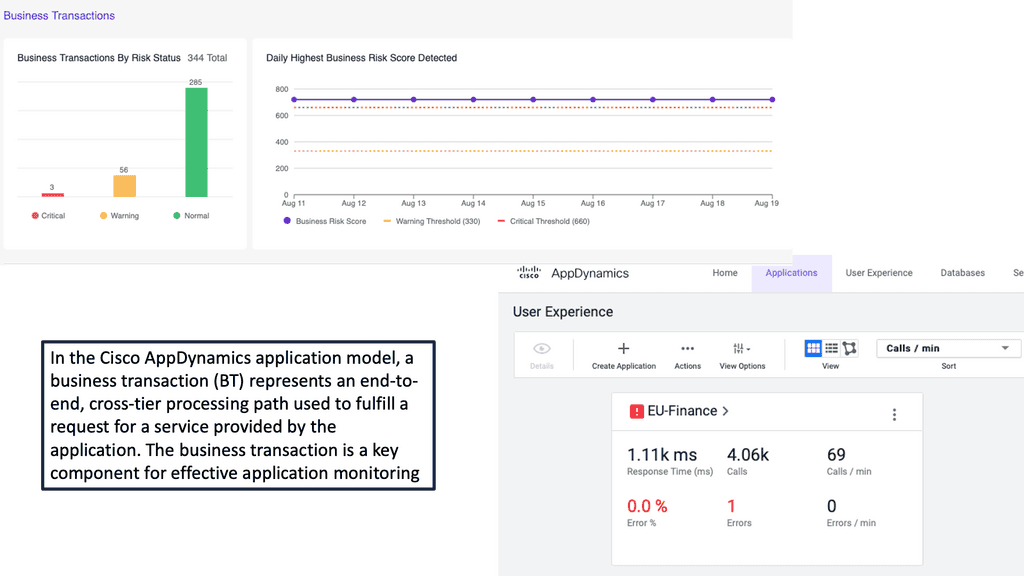
Example Product: Cisco AppDynamics
### Key Features of Cisco AppDynamics
**1. Real-Time Monitoring and Analytics**
One of the standout features of Cisco AppDynamics is its ability to provide real-time monitoring and analytics. This allows businesses to gain instant visibility into application performance and user interactions. By leveraging real-time data, organizations can quickly identify performance bottlenecks, understand user behavior, and make informed decisions to enhance application efficiency.
**2. End-to-End Transaction Visibility**
With Cisco AppDynamics, you get a comprehensive view of end-to-end transactions, from user interactions to backend processes. This visibility helps in pinpointing the exact location of issues within the application stack, whether it’s in the code, database, or infrastructure. This holistic approach ensures that no problem goes unnoticed, enabling swift resolution and minimizing downtime.
**3. AI-Powered Anomaly Detection**
Cisco AppDynamics employs advanced AI and machine learning algorithms to detect anomalies in application performance. These intelligent insights help predict and prevent potential issues before they impact end users. By learning the normal behavior of your applications, the system can alert you to deviations that might signify underlying problems, allowing proactive intervention.
### Benefits of Implementing Cisco AppDynamics
**1. Enhanced User Experience**
By continuously monitoring application performance and user interactions, Cisco AppDynamics helps ensure a smooth and uninterrupted user experience. Instant alerts and detailed reports enable IT teams to address issues swiftly, reducing the likelihood of user dissatisfaction and churn.
**2. Improved Operational Efficiency**
Cisco AppDynamics automates many aspects of performance monitoring, freeing up valuable time for IT teams. This automation reduces the need for manual checks and troubleshooting, allowing teams to focus on strategic initiatives and innovation. The platform’s ability to integrate with various IT tools further streamlines operations and enhances overall efficiency.
**3. Data-Driven Decision Making**
The rich data and analytics provided by Cisco AppDynamics empower businesses to make data-driven decisions. Whether it’s optimizing application performance, planning for capacity, or enhancing security measures, the insights gained from AppDynamics drive informed strategies that align with business goals.
### Getting Started with Cisco AppDynamics
**1. Easy Deployment**
Cisco AppDynamics offers flexible deployment options, including on-premises, cloud, and hybrid environments. The straightforward installation process and intuitive user interface make it accessible even for teams with limited APM experience. Comprehensive documentation and support further ease the onboarding process.
**2. Customizable Dashboards**
Users can create customizable dashboards to monitor the metrics that matter most to their organization. These dashboards provide at-a-glance views of key performance indicators (KPIs), making it easy to track progress and identify areas for improvement. Custom alerts and reports ensure that critical information is always at your fingertips.
**3. Continuous Learning and Improvement**
Cisco AppDynamics encourages continuous learning and improvement through its robust training resources and community support. Regular updates and enhancements keep the platform aligned with the latest technological advancements, ensuring that your APM strategy evolves alongside your business needs.
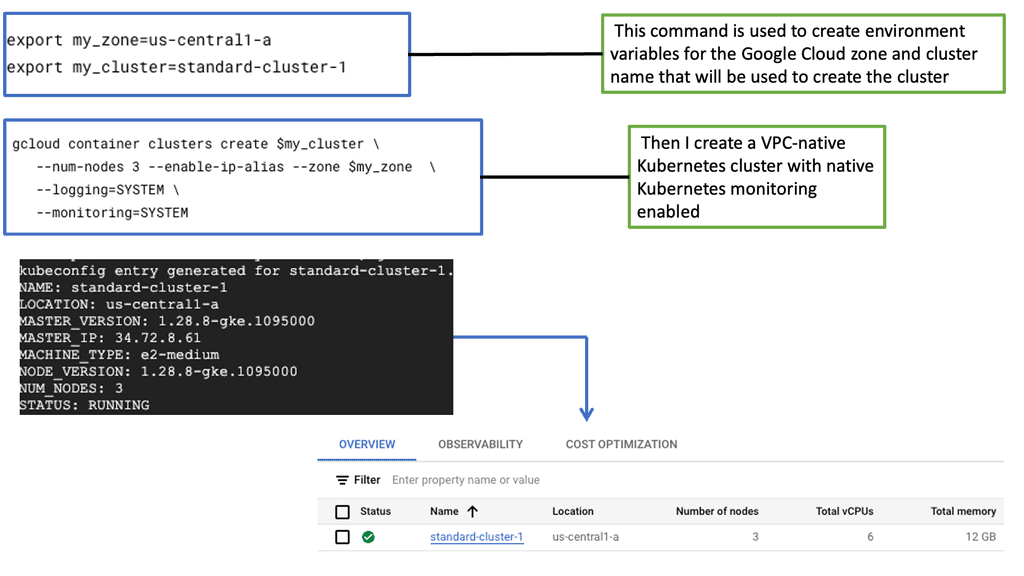
What is GKE-Native Monitoring?
GKE-Native Monitoring is a comprehensive monitoring solution provided by Google Cloud specifically designed for Kubernetes workloads running on GKE. It offers deep visibility into the performance and health of your clusters, allowing you to identify and address issues before they impact your applications proactively.
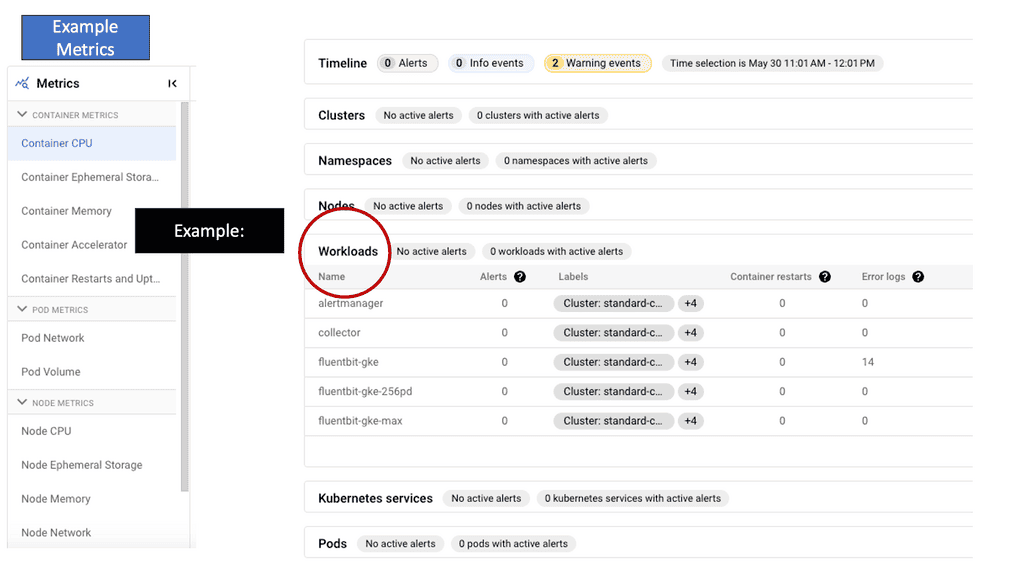
a) Automatic Cluster Monitoring: GKE-Native Monitoring automatically collects and visualizes key metrics from your GKE clusters, making monitoring your workloads’ overall health and resource utilization effortlessly.
b) Customizable Dashboards: With GKE-Native Monitoring, you can create personalized dashboards tailored to your specific monitoring needs. Visualize metrics that matter most to you and gain actionable insights at a glance.
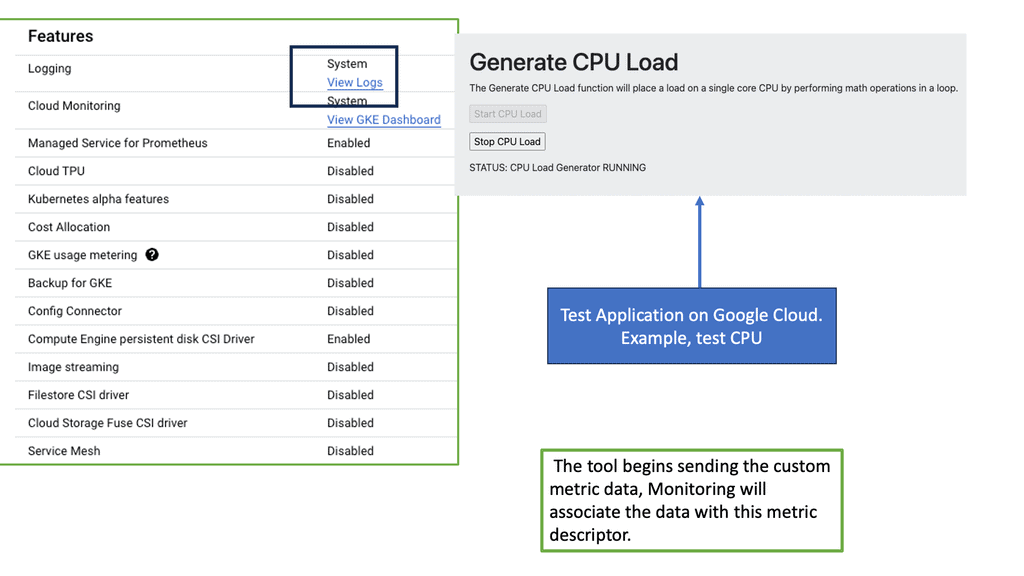
c) Alerting and Notifications: Use GKE-Native Monitoring’s robust alerting capabilities to stay informed about critical events and anomalies in your GKE clusters. Configure alerts based on thresholds and receive notifications through various channels to ensure prompt response and issue resolution.
The Role of Network Baselining
Network baselining involves capturing and analyzing network traffic data to establish a benchmark or baseline for normal network behavior. This baseline represents the typical performance metrics of the network under regular conditions. It encompasses various parameters such as bandwidth utilization, latency, packet loss, and throughput. By monitoring these metrics over time, administrators can identify patterns, trends, and anomalies, enabling them to make informed decisions about network optimization and troubleshooting.
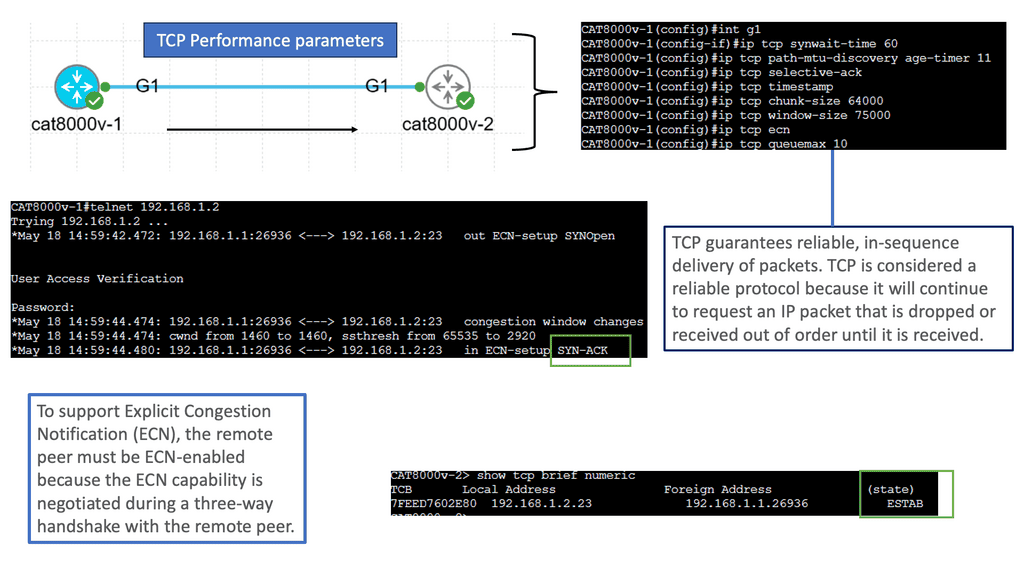
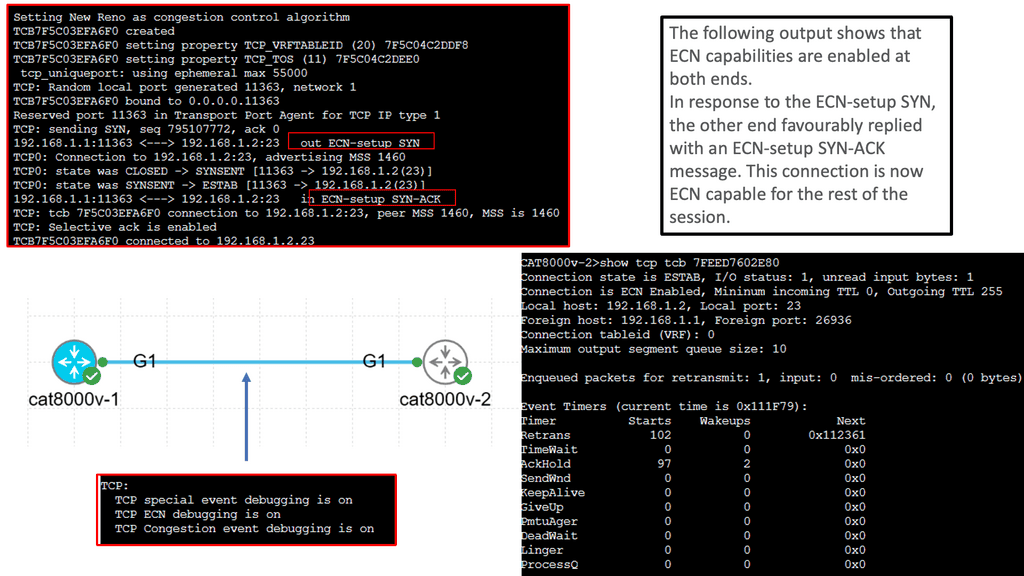
Understanding TCP Performance Parameters
TCP, or Transmission Control Protocol, is a vital protocol that governs reliable data transmission over networks. Behind its seemingly simple operation lies a complex web of performance parameters that can significantly impact network efficiency, latency, and throughput. In this blog post, we will dive deep into TCP performance parameters, understanding their importance and how they influence network performance.
TCP performance parameters determine various aspects of the TCP protocol’s behavior. These parameters include window size, congestion control algorithms, maximum segment size (MSS), retransmission timeout (RTO), and many more. Each parameter plays a crucial role in shaping TCP’s performance characteristics, such as reliability, congestion avoidance, and flow control.
The Impact of Window Size: Window size, also known as the receive window, represents the amount of data a receiving host can accept before requiring acknowledgment from the sender. A larger window size allows for more extensive data transfer without waiting for acknowledgments, thereby improving throughput. However, a vast window size can lead to network congestion and increased latency. Finding the optimal window size requires careful consideration and tuning.
Congestion Control Algorithms: Congestion control algorithms, such as TCP Reno, Cubic, and New Reno, regulate the flow of data in TCP connections to avoid network congestion. These algorithms dynamically adjust parameters like the congestion window and the slow-start threshold based on various congestion indicators. Understanding the different congestion control algorithms and selecting the appropriate one for specific network conditions is crucial for achieving optimal performance.
Maximum Segment Size (MSS): The Maximum Segment Size (MSS) refers to the most significant amount of data TCP can encapsulate within a single IP packet. It is determined by the underlying network’s Maximum Transmission Unit (MTU). A higher MSS can enhance throughput by reducing the overhead associated with packet headers, but it should not exceed the network’s MTU to avoid fragmentation and subsequent performance degradation.
Retransmission Timeout (RTO): Retransmission Timeout (RTO) is the duration at which TCP waits for an acknowledgment before retransmitting a packet. Setting an appropriate RTO value is crucial to balance reliability and responsiveness. A too-short RTO may result in unnecessary retransmissions and increased network load, while a too-long RTO can lead to higher latency and decreased throughput. Factors like network latency, jitter, and packet loss rate influence the optimal RTO configuration.
Before you proceed, you may find the following post helpful:
- Network Traffic Engineering
- Low Latency Network Design
- Transport SDN
- Load Balancing
- What is OpenFlow
- Observability vs Monitoring
- Kubernetes Security Best Practice
Baseline Engineering
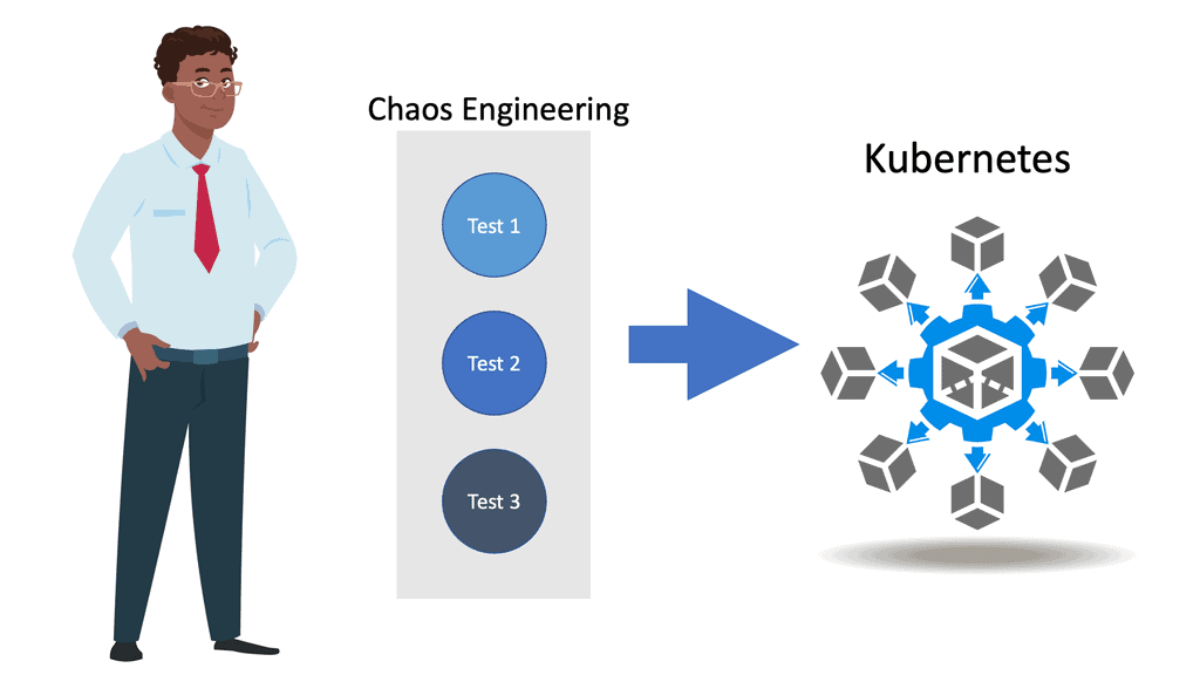
Chaos Engineering
Chaos engineering is a methodology for experimenting with a software system to build confidence in its capability to withstand turbulent environments in production. It is an essential part of the DevOps philosophy, allowing teams to experiment with their system’s behavior in a safe and controlled manner.
This type of baseline engineering allows teams to identify weaknesses in their software architecture, such as potential bottlenecks or single points of failure, and take proactive measures to address them. By injecting faults into the system and measuring the effects, teams gain insights into system behavior that can be used to improve system resilience.
Finally, chaos Engineering teaches you to develop and execute controlled experiments that uncover hidden problems. For instance, you may need to inject system-shaking failures that disrupt system calls, networking, APIs, and Kubernetes-based microservices infrastructures.
Chaos engineering is “the discipline of experimenting on a system to build confidence in the system’s capability to withstand turbulent conditions in production.” In other words, it’s a software testing method that concentrates on finding evidence of problems before users experience them.
Network Baselining
Network baseline involves measuring the network’s performance at different times. This includes measuring throughput, latency, and other performance metrics and the network’s configuration. It is important to note that performance metrics can vary greatly depending on the type of network being used. This is why it is essential to establish a baseline for the network to be used as a reference point for comparison.
Network baselining is integral to network management. It allows organizations to identify and address potential issues before they become more serious. Organizations can be alerted to potential problems by analyzing the network’s performance. This can help organizations avoid costly downtime and ensure their networks run at peak performance.
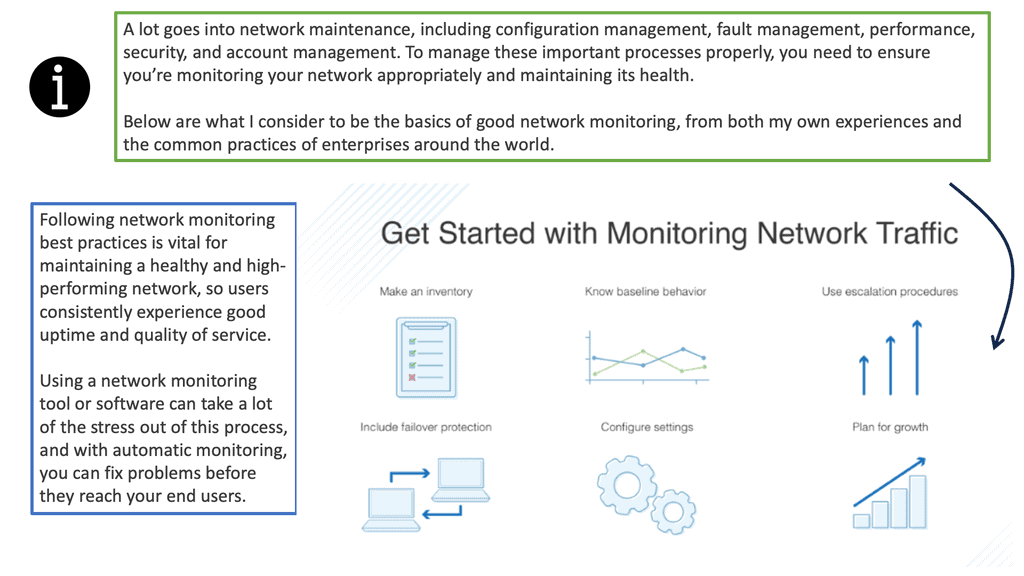
**The Importance of Network Baselining**
Network baselining provides several benefits for network administrators and organizations:
1. Performance Optimization: Baselining helps identify bottlenecks, inefficiencies, and abnormal behavior within the network infrastructure. By understanding the baseline, administrators can optimize network resources, improve performance, and ensure a smoother user experience.
2. Security Enhancement: Baselining also plays a crucial role in detecting and mitigating security threats. Administrators can identify unusual or malicious activities by comparing current network behavior against the established baseline, such as abnormal traffic patterns or unauthorized access attempts.
3. Capacity Planning: Understanding network baselines enables administrators to forecast future capacity requirements accurately. By analyzing historical data, they can determine when and where network upgrades or expansions may be necessary, ensuring consistent performance as the network grows.
**Establishing a Network Baseline**
To establish an accurate network baseline, administrators follow a systematic approach:
1. Data Collection: Network traffic data is collected using specialized monitoring tools like network analyzers or packet sniffers. These tools capture and analyze network packets, providing detailed insights into performance metrics.
2. Duration: Baseline data should ideally be collected over an extended period, typically from a few days to a few weeks. This ensures the baseline accounts for variations due to different network usage patterns.
3. Normalizing Factors: Administrators consider various factors impacting network performance, such as peak usage hours, seasonal variations, and specific application requirements. Normalizing the data can establish a more accurate baseline that reflects typical network behavior.
4. Analysis and Documentation: Once the baseline data is collected, administrators analyze the metrics to identify patterns and trends. This analysis helps establish thresholds for acceptable performance and highlights any deviations that may require attention. Documentation of the baseline and related analysis is crucial for future reference and comparison.
Network Baselining: A Lot Can Go Wrong
Infrastructure is becoming increasingly complex, and let’s face it, a lot can go wrong. It’s imperative to have a global view of all the infrastructure components and a good understanding of the application’s performance and health. In a large-scale container-based application design, there are many moving pieces and parts, and it is hard to validate the health of each piece manually.
Therefore, monitoring and troubleshooting are much more complex, especially as everything is interconnected, making it difficult for a single person in one team to understand what is happening entirely. Nothing is static anymore; things are moving around all the time. This is why it is even more important to focus on the patterns and to be able to see the path of the issue efficiently.
Some modern applications could simultaneously be in multiple clouds and different location types, resulting in numerous data points to consider. If any of these segments are slightly overloaded, the sum of each overloaded segment results in poor performance on the application level.
What does this mean to latency?
Distributed computing has many components and services, with far-apart components. This contrasts with a monolith, with all parts in one location. Because modern applications are distributed, latency can add up. So, we have both network latency and application latency. The network latency is several orders of magnitude more significant.
As a result, you need to minimize the number of Round-Trip Times and reduce any unneeded communication to an absolute minimum. When communication is required across the network, it’s better to gather as much data together as possible to get bigger packets that are more efficient to transfer. Also, consider using different types of buffers, both small and large, which will have varying effects on the dropped packet test.
With the monolith, the application is simply running in a single process, and it is relatively easy to debug. Many traditional tooling and code instrumentation technologies have been built, assuming you have the idea of a single process. The core challenge is trying to debug microservices applications. So much of the tooling we have today has been built for traditional monolithic applications. So, there are new monitoring tools for these new applications, but there is a steep learning curve and a high barrier to entry.
A new approach: Network baselining and Baseline engineering
For this, you need to understand practices like Chaos Engineering, along with service level objectives (SLOs), and how they can improve the reliability of the overall system. Chaos Engineering is a baseline engineering practice that allows tests to be performed in a controlled way. Essentially, we intentionally break things to learn how to build more resilient systems.
So, we are injecting faults in a controlled way to make the overall application more resilient by injecting various issues and faults. Implementing practices like Chaos Engineering will help you understand and manage unexpected failures and performance degradation. The purpose of Chaos Engineering is to build more robust and resilient systems.
**A final note on baselines: Don’t forget them**
Creating a good baseline is a critical factor. You need to understand how things work under normal circumstances. A baseline is a fixed point of reference used for comparison purposes. You usually need to know how long it takes to start the application to the actual login and how long it takes to do the essential services before there are any issues or heavy load. Baselines are critical to monitoring.
It’s like security; if you can’t see what, you can’t protect. The same assumptions apply here. Go for a good baseline and if you can have this fully automated. Tests need to be carried out against the baseline on an ongoing basis. You need to test constantly to see how long it takes users to use your services. Without baseline data, estimating any changes or demonstrating progress is difficult.
Network baselining is a critical practice for maintaining optimal network performance and security. By establishing a baseline, administrators can proactively monitor, analyze, and optimize their networks. This approach enables them to promptly identify and address performance issues, enhance security measures, and plan for future capacity requirements. Organizations can ensure a reliable and efficient network infrastructure that supports their business objectives by investing time and effort in network baselining.
Summary: Baseline Engineering
Maintaining stability and performance is crucial in the fast-paced world of technology, where networks are the backbone of modern communication. This blog post will delve into the art of Network Baseline Engineering, uncovering its significance, methods, and benefits—strap in as we embark on a journey to understand and master this essential aspect of network management.
Section 1: What is Network Baseline Engineering?
Network Baseline Engineering is a process that involves establishing a benchmark or baseline for network performance, allowing for effective monitoring, troubleshooting, and optimization. Administrators can identify patterns, trends, and anomalies by capturing and analyzing network data over a certain period.
Section 2: The Importance of Network Baseline Engineering
A stable network is vital for seamless operations, preventing downtime, and ensuring user satisfaction. Network Baseline Engineering helps understand normal network behavior, crucial for detecting deviations, security threats, and performance issues. It enables proactive measures, reducing the impact of potential disruptions.
Section 3: Establishing a Baseline
Administrators need to consider various factors to create an accurate network baseline. These include defining key performance indicators (KPIs), selecting appropriate tools for data collection, and determining the time frame for capturing network data. Proper planning and execution are essential to ensure data accuracy and reliability.
Section 4: Analyzing and Interpreting Network Data
Once network data is collected, the real work begins. Skilled analysts leverage specialized tools to analyze the data, identify patterns, and establish baseline performance metrics. This step requires expertise in statistical analysis and a deep understanding of network protocols and traffic patterns.
Section 5: Benefits of Network Baseline Engineering
Network Baseline Engineering offers numerous benefits. It enables administrators to promptly detect and resolve performance issues, optimize network resources, and enhance overall network security. Organizations can make informed decisions, plan capacity upgrades, and ensure a smooth user experience by having a clear picture of normal network behavior.
Conclusion:
Network Baseline Engineering is the foundation for maintaining network stability and performance. By establishing a benchmark and continuously monitoring network behavior, organizations can proactively address issues, optimize resources, and enhance overall network security. Embrace the power of Network Baseline Engineering and unlock the full potential of your network infrastructure.
- Fortinet’s new FortiOS 7.4 enhances SASE - April 5, 2023
- Comcast SD-WAN Expansion to SMBs - April 4, 2023
- Cisco CloudLock - April 4, 2023

