Dropped Packet Test
In the world of networking, maintaining optimal performance is crucial. One of the key challenges that network administrators face is identifying and addressing packet loss issues. Dropped packets can lead to significant disruptions, sluggish connectivity, and even compromised data integrity. To shed light on this matter, we delve into the dropped packet test—a powerful tool for diagnosing and improving network performance.
Packet loss occurs when data packets traveling across a network fail to reach their destination. This can happen due to various reasons, including network congestion, faulty hardware, or software glitches. Regardless of the cause, packet loss can have detrimental effects on network reliability and user experience.
The dropped packet test is a method used to measure the rate of packet loss in a network. It involves sending a series of test packets from a source to a destination and monitoring the percentage of packets that fail to reach their intended endpoint. This test provides valuable insights into the health of a network and helps identify areas that require attention.
To perform a dropped packet test, network administrators can utilize specialized network diagnostic tools or command-line utilities. These tools allow them to generate test packets and analyze the results. By configuring parameters such as packet size, frequency, and destination, administrators can simulate real-world network conditions and assess the impact on packet loss.
Once the dropped packet test is complete, administrators need to interpret the results accurately. A high packet loss percentage indicates potential issues that require investigation. It is crucial to analyze the test data in conjunction with other network performance metrics to pinpoint the root cause of packet loss and devise effective solutions.
To address packet loss, network administrators can employ a range of strategies. These may include optimizing network infrastructure, upgrading hardware components, fine-tuning routing configurations, or implementing traffic prioritization techniques. The insights gained from the dropped packet test serve as a foundation for implementing targeted solutions and improving overall network performance.
Matt Conran
Highlights: Dropped Packet Test
**Understanding Packet Loss**
Packet loss occurs when data packets traveling across a network fail to reach their destination. This can happen due to network congestion, hardware failures, software bugs, or even environmental factors. The consequences of packet loss can be severe, leading to slower data transmission, corrupted files, and degraded voice and video communication. For businesses and individuals relying on robust internet connections, minimizing packet loss is essential for maintaining productivity and satisfaction.
**Tools and Techniques for Testing Packet Loss**
Testing for packet loss is a proactive step toward maintaining network health. Several tools and techniques can help identify and quantify packet loss. Ping tests, for example, are a straightforward method where small data packets are sent to a target and any loss is recorded. More advanced tools like Wireshark offer deeper insights by capturing and analyzing network traffic in real-time. These tools help network administrators pinpoint issues, understand the scope of packet loss, and devise strategies for mitigation.
**Interpreting Test Results**
Once testing is complete, interpreting the results is crucial for taking corrective action. A small percentage of packet loss over a short period might be negligible, but sustained or high levels of loss demand attention. Understanding the pattern and frequency of packet loss can guide troubleshooting efforts, whether it’s adjusting network configurations, upgrading hardware, or addressing software issues. Recognizing the symptoms early allows for quicker resolution and less impact on network performance.
Understanding Dropped Packets
1. Dropped packets occur when data fails to reach its intended destination within a network. These packets carry vital information, and any loss or delay can hamper the overall performance of a network. Understanding the causes and consequences of dropped packets is fundamental to optimizing network performance
2. The dropped packet test is an essential diagnostic tool that network administrators and engineers employ to assess the health and efficiency of a network. By intentionally creating scenarios where packets are dropped, it becomes possible to measure the impact on network performance and identify potential weaknesses or areas for improvement.
3. To perform the dropped packet test, various methodologies and tools are available. One commonly used approach involves using network traffic generators to simulate network traffic and intentionally dropping packets at specific points. This allows administrators to evaluate how different network components and configurations handle packet loss and its subsequent impact on overall performance.
4. Once the dropped packet test is completed, it is crucial to analyze the results effectively. Network monitoring tools and packet analyzers can provide detailed insights into packet loss, latency, and other performance metrics. By carefully examining these results, administrators can pinpoint potential bottlenecks, identify problematic network segments, and make informed decisions to optimize performance.
Knowledge Check: Understanding Traceroute
Traceroute basics:
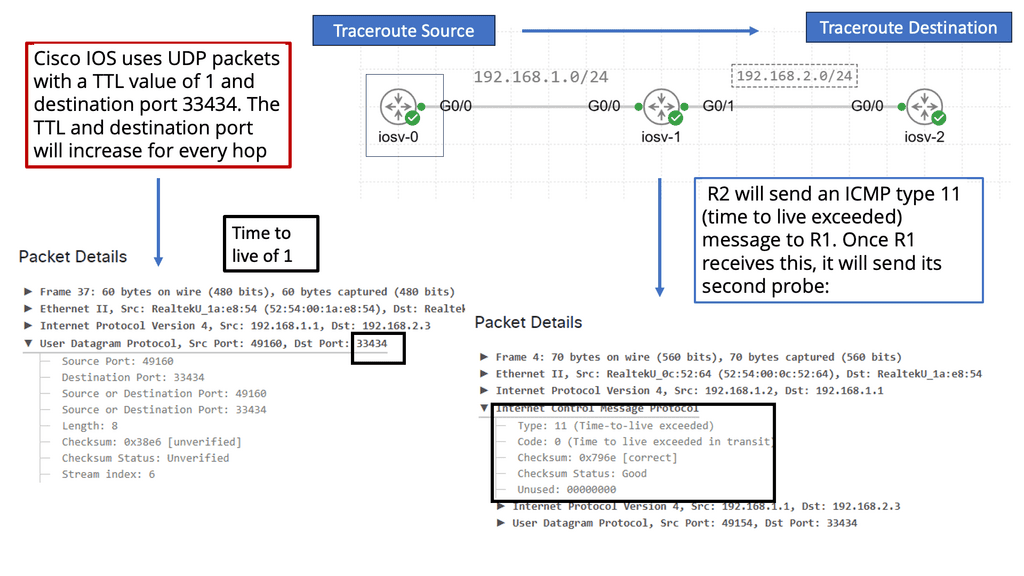
Traceroute, also known as tracert on Windows, is a command-line tool that tracks the route data packets take from one point to another. By sending a series of packets with increasing Time to Live (TTL) values, traceroute reveals the path these packets follow, hopping from one network node to another.
TTL and ICMP:
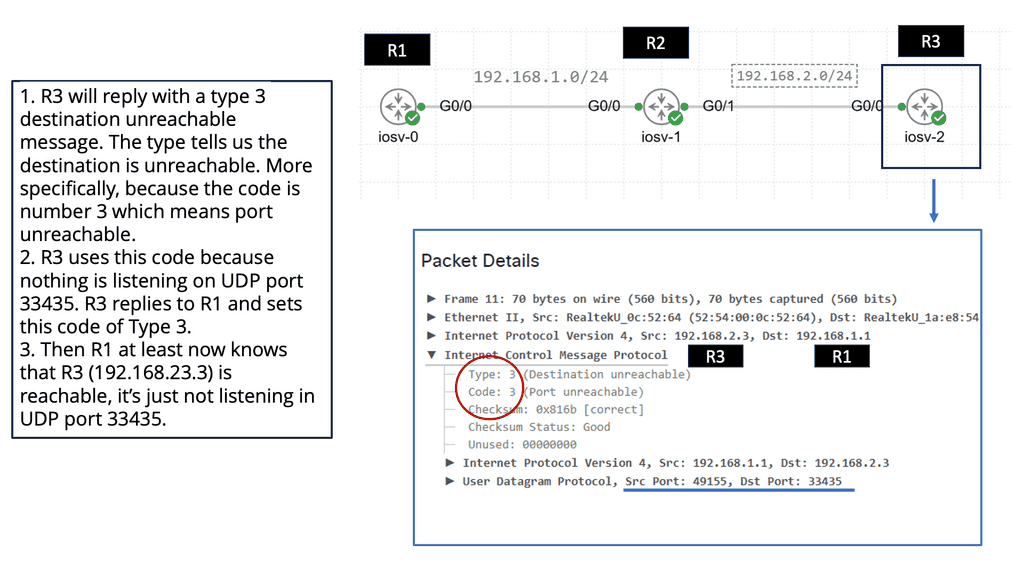
Traceroute exploits the Time to Live (TTL) field in IP packets and utilizes Internet Control Message Protocol (ICMP) to gather information about the network path. As each packet encounters a node in its journey, if the TTL expires, an ICMP time exceeded message is sent back to the traceroute tool, allowing it to determine the IP address and round-trip time to reach each node.
Network troubleshooting: Traceroute is an invaluable tool for administrators to diagnose and troubleshoot connectivity issues. By identifying the exact network hop where a delay or failure occurs, administrators can pinpoint the problem and take appropriate action to resolve it swiftly.
Identifying potential bottlenecks: Traceroute assists in identifying potential bottlenecks and points of congestion in network paths. This information allows network administrators to optimize their infrastructure, reroute traffic, or negotiate better peering agreements to improve network performance.
Example Product: Cisco ThousandEyes
**Why Network Visibility Matters**
Network visibility is the cornerstone of efficient IT operations. With the proliferation of cloud services, remote work, and global connectivity, traditional network monitoring tools often fall short. They lack the insights needed to understand the entire digital supply chain. This is where ThousandEyes excels. By offering a comprehensive view of network paths, internet health, and application performance, it helps organizations identify and resolve issues before they impact end-users. This proactive approach not only enhances user satisfaction but also ensures business continuity.
**Key Features of Cisco ThousandEyes**
1. **Global Monitoring**: ThousandEyes leverages a vast network of vantage points across the globe to monitor the performance of internet-dependent services. This global reach ensures that businesses can track performance from virtually anywhere in the world.
2. **End-to-End Visibility**: By providing insights into every segment of the network path—from the data center to the end user—ThousandEyes enables businesses to pinpoint where issues occur, whether it’s within their own infrastructure or an external service provider.
3. **Cloud and SaaS Monitoring**: As more businesses migrate to cloud-based services, monitoring these environments becomes crucial. ThousandEyes offers robust monitoring capabilities for cloud platforms and SaaS applications, ensuring they perform optimally.
4. **BGP Route Visualization**: Understanding the routing of data across the internet is essential for troubleshooting and optimizing network performance. ThousandEyes provides detailed BGP route visualizations, helping businesses understand how their data travels and where potential issues might arise.
5. **Alerting and Reporting**: ThousandEyes offers customizable alerting and reporting features, allowing businesses to stay informed about performance issues and trends. This ensures that IT teams can respond quickly to potential problems and maintain high service levels.
ThousandEyes caters to a wide range of use cases, each offering distinct benefits:
– **Optimizing User Experience**: By monitoring user interactions with applications, businesses can ensure a smooth and responsive experience, which is crucial for customer satisfaction and retention.
– **Enhancing Cloud Performance**: With detailed insights into cloud service performance, organizations can optimize their cloud environments, ensuring reliable and efficient service delivery.
– **Troubleshooting Network Issues**: ThousandEyes’ comprehensive visibility allows IT teams to quickly identify and resolve network issues, minimizing downtime and maintaining productivity.
– **Supporting Remote Work**: As remote work becomes the norm, ThousandEyes helps businesses monitor and optimize the remote user experience, ensuring employees can work efficiently from any location.
Testing For Packet Loss
How do you test for packet loss on a network? The following post provides information on testing packet loss and network packet loss tests. Today’s data center performance has to factor in various applications and workloads with different consistency requirements.
Understanding what is best per application/workload requires a dropped packet test from different network parts. Some applications require predictable latency, while others sustain throughput. The slowest flow is usually the ultimate determining factor affecting end-to-end performance.
The consequences of packet loss can be far-reaching. In real-time communication applications, even a slight loss of packets can lead to distorted audio, pixelated video, or delayed responses. In data-intensive tasks such as cloud computing or online backups, packet loss can result in corrupted files or incomplete transfers. Businesses relying on efficient data transmission can suffer from reduced productivity and customer dissatisfaction.
What is Network Monitoring?
Network monitoring refers to the continuous surveillance and analysis of network infrastructure, devices, and traffic. It involves observing network performance, identifying issues or anomalies, and proactively addressing them to minimize downtime and optimize network efficiency. By monitoring various parameters such as bandwidth usage, latency, packet loss, and device health, organizations can detect and resolve potential problems before they escalate.
a) Proactive Issue Detection: Network monitoring allows IT teams to identify and address potential problems before they impact users or cause significant disruptions. By setting up alerts and notifications, administrators can stay informed about network issues and take prompt action to mitigate them.
b) Improved Network Performance: Continuous monitoring provides valuable insights into network performance metrics, allowing organizations to identify bottlenecks, optimize resource allocation, and ensure smooth data flow. This leads to enhanced user experience and increased productivity.
Understanding Network Scanning
A: Network scanning is a proactive security measure that identifies vulnerabilities, discovers active hosts, and assesses a network’s overall health. It plays a vital role in fortifying the digital fortress by systematically examining the network infrastructure, including computers, servers, and connected devices.
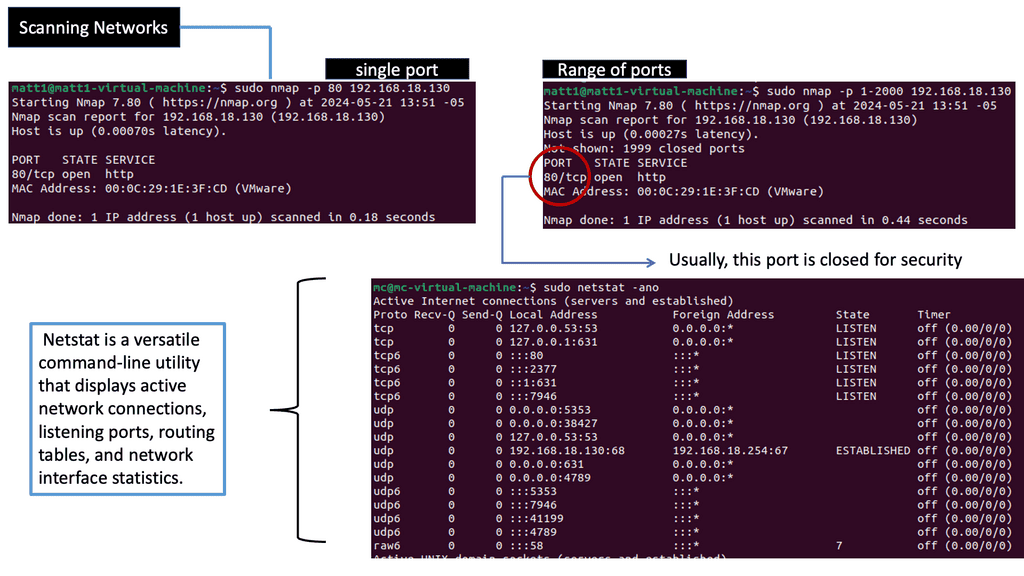
B: Various techniques are employed in network scanning, each serving a unique purpose. Port scanning, for instance, involves scanning for open ports on target devices, providing insights into potential entry points for malicious actors. On the other hand, vulnerability scanning focuses on identifying weaknesses in software, operating systems, or configurations that may be exploited. Other techniques, such as ping scanning, OS fingerprinting, and service enumeration, further enhance the scanning process.
C: Network scanning offers numerous benefits contributing to an organization’s or individual’s security posture. First, it enables proactive identification of vulnerabilities, allowing for timely patching and mitigation. Moreover, regular network scanning aids in compliance with security standards and regulations. Network scanning helps maintain a controlled and secure environment by identifying unauthorized devices or rogue access points.
What is ICMP?
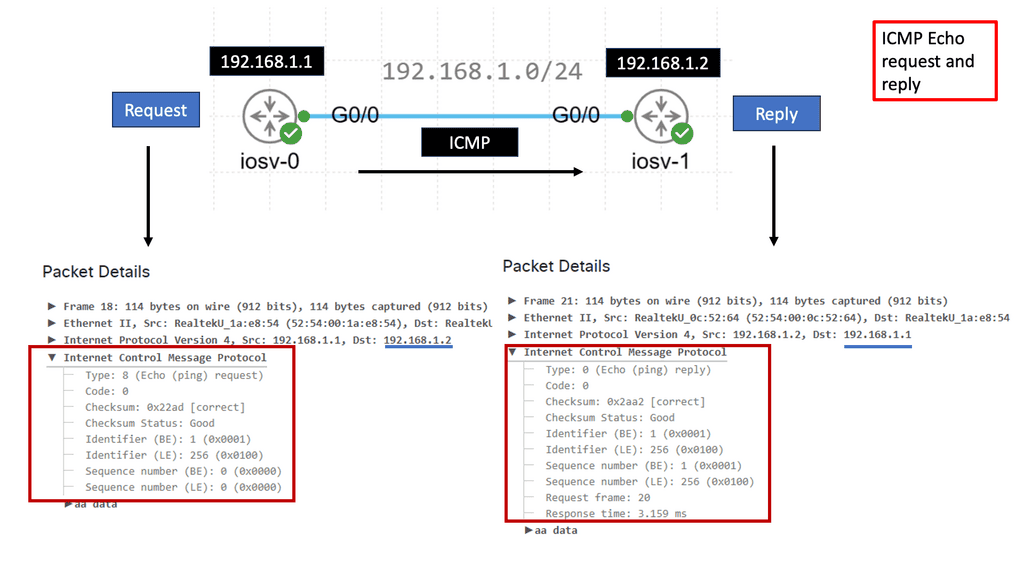
ICMP is a network-layer protocol that operates on top of the Internet Protocol (IP). It is primarily designed to report errors, exchange control information, and provide feedback about network conditions. ICMP messages are encapsulated within IP packets, allowing them to traverse the network and reach their destinations.
ICMP encompasses a range of message types, each serving a specific purpose. Some common message types include Echo Request (Ping), Echo Reply, Destination Unreachable, Time Exceeded, Redirect, and Address Mask Request/Reply. Each message type carries valuable information about the network and aids in network troubleshooting and management.
Ping and Echo Requests
One of the most well-known uses of ICMP is the Ping utility, which is based on the Echo Request and Echo Reply message types. Ping allows us to test a host’s reachability and round-trip time on the network. Network administrators can assess network connectivity and measure response times by sending an Echo Request and waiting for an Echo Reply.
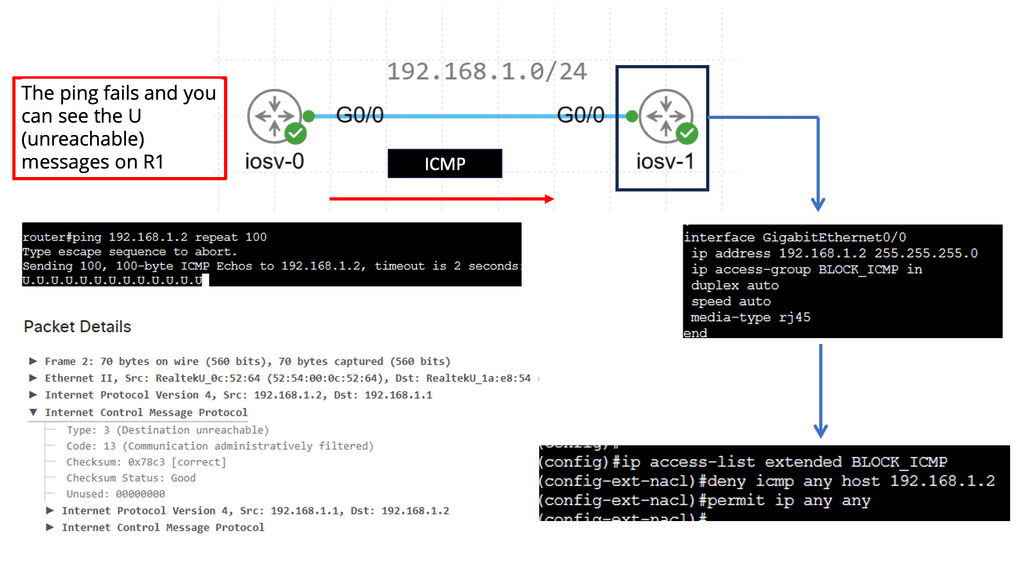
ICMP plays a vital role in network troubleshooting and diagnostics. When a packet encounters an issue across the network, ICMP helps identify and report the problem. Destination Unreachable messages, for example, inform the sender that the intended destination is unreachable due to various reasons, such as network congestion, firewall rules, or routing issues.
Testing Methods for Packet Loss
To ensure a robust and reliable network infrastructure, it is vital to perform regular testing for packet loss. Here are some effective methods to carry out such tests:
1. Ping and Traceroute: These command-line utilities can provide valuable insights into network connectivity and latency. Packet loss can be detected by sending test packets and analyzing their round-trip time.
2. Network Monitoring Tools: Specialized network monitoring software can offer comprehensive visibility into network performance. These tools can monitor packet loss in real-time, provide detailed reports, and even alert administrators of potential issues.
3. Load Testing: Simulating heavy network traffic can help identify how the network handles data under stress. By monitoring packet loss during these tests, administrators can pinpoint weak spots and take necessary measures to mitigate the impact.
Example: Identifying and Mapping Networks
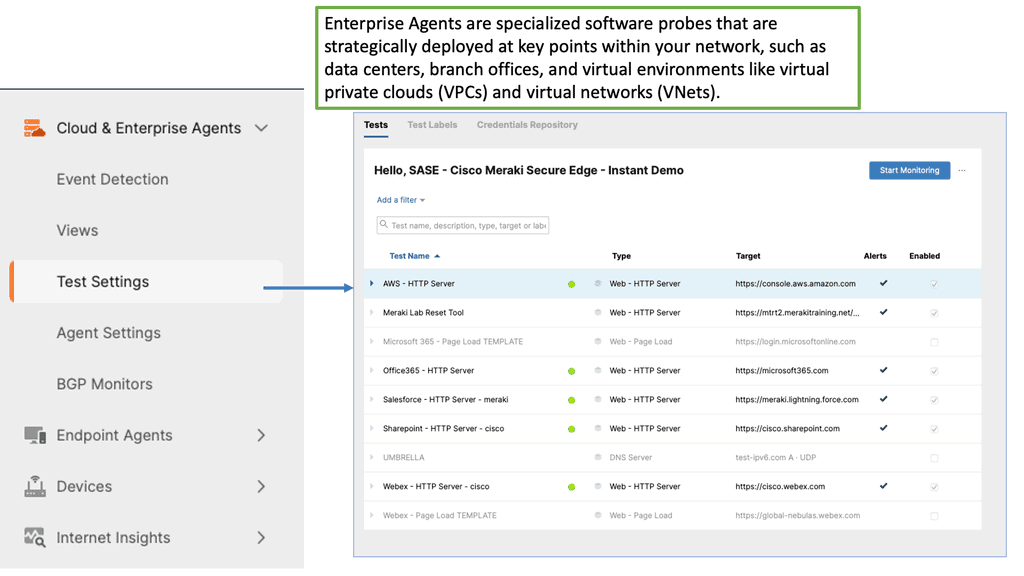
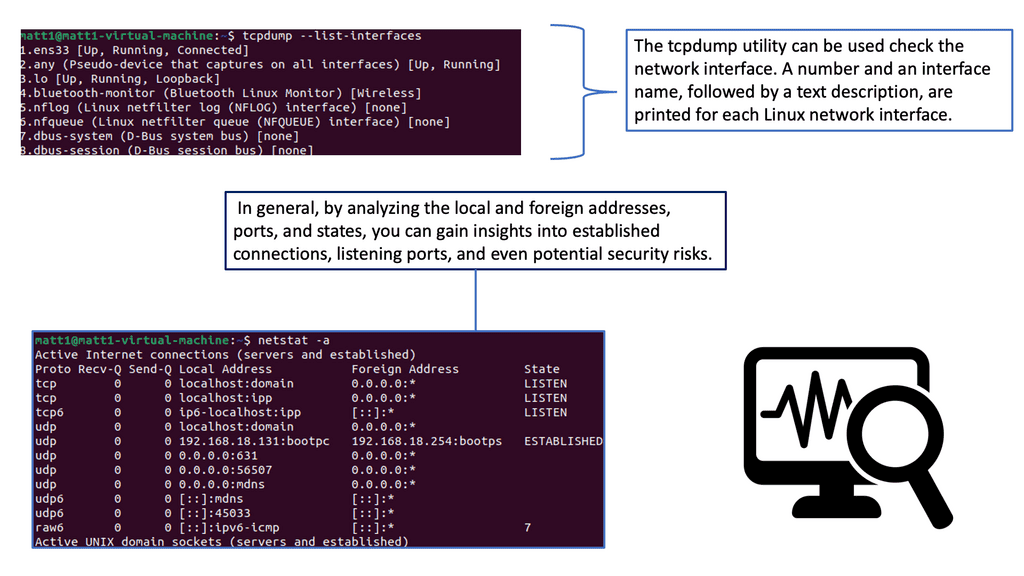
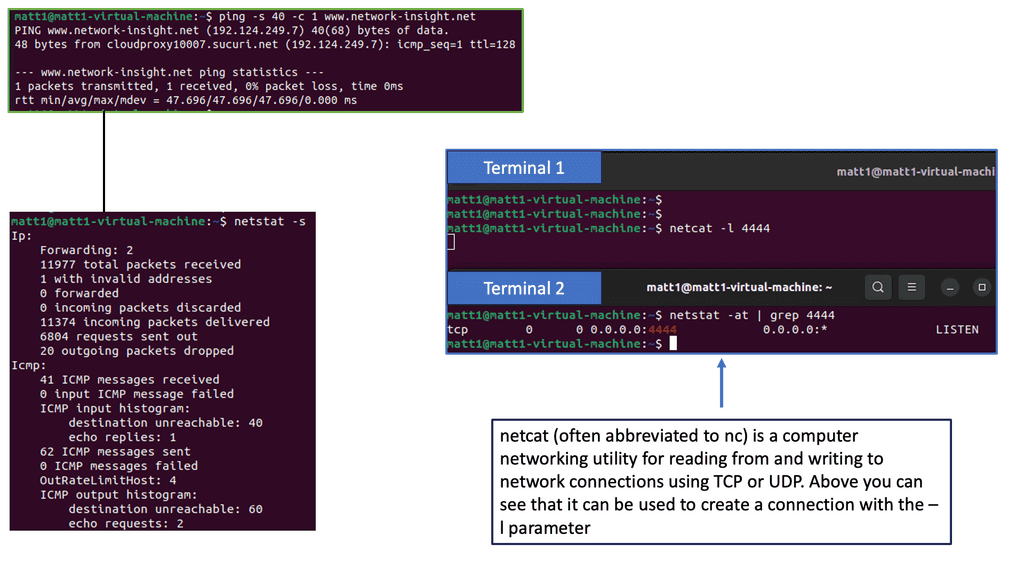
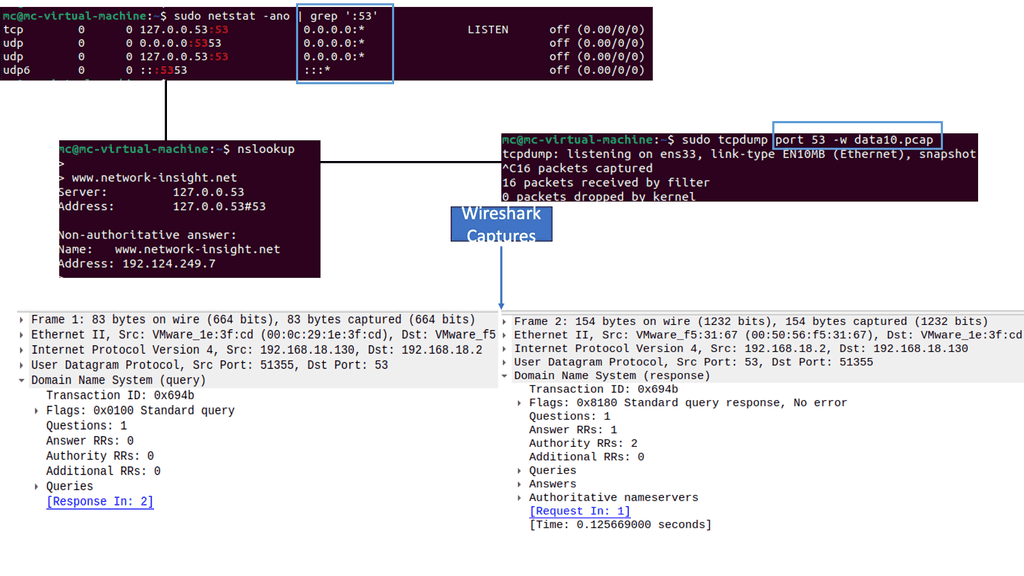
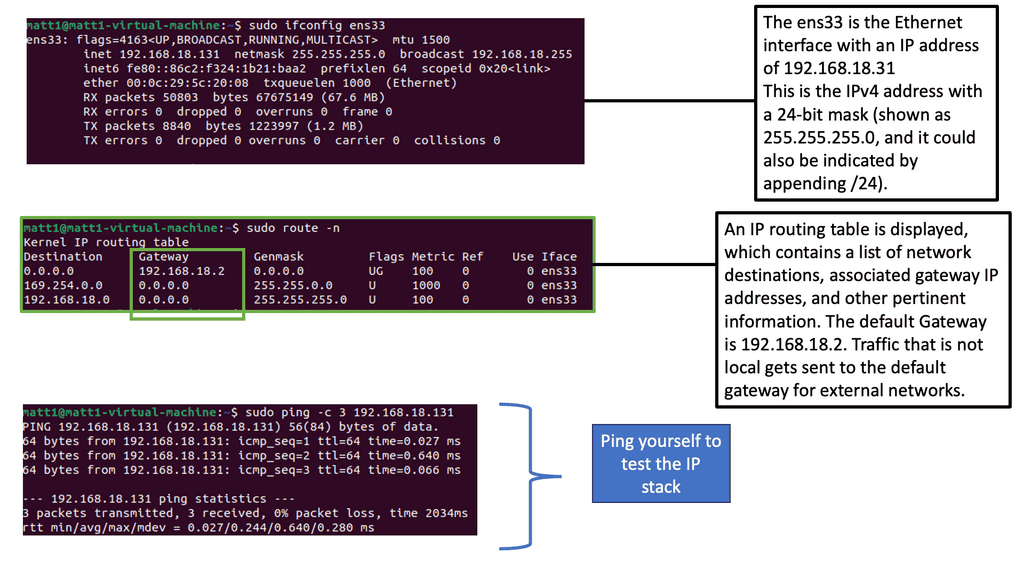
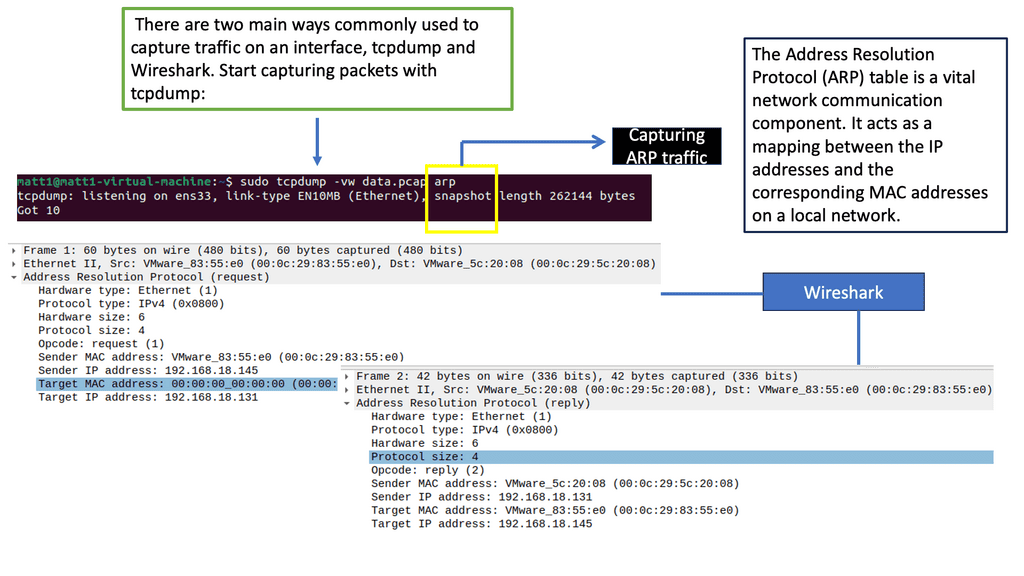
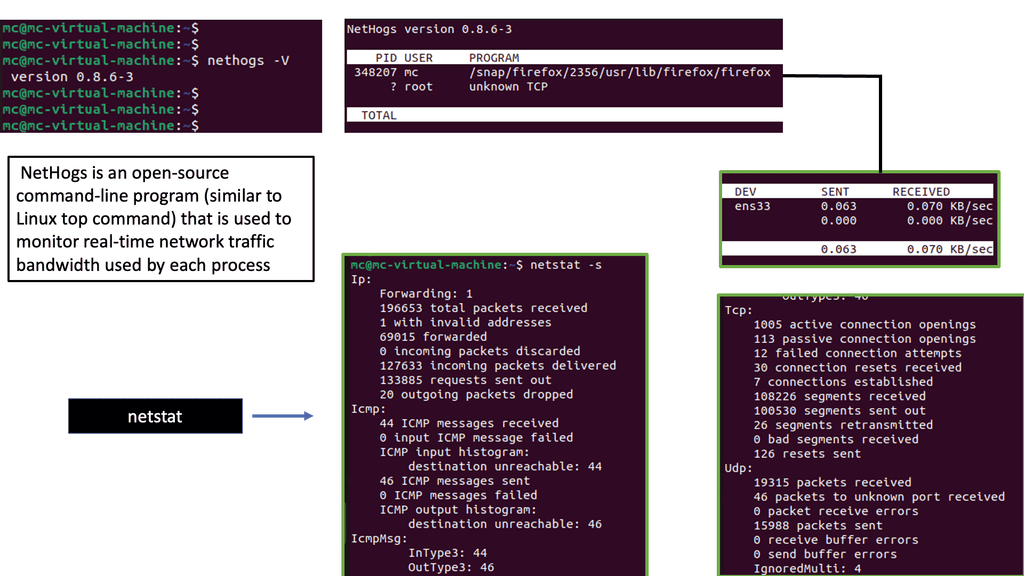
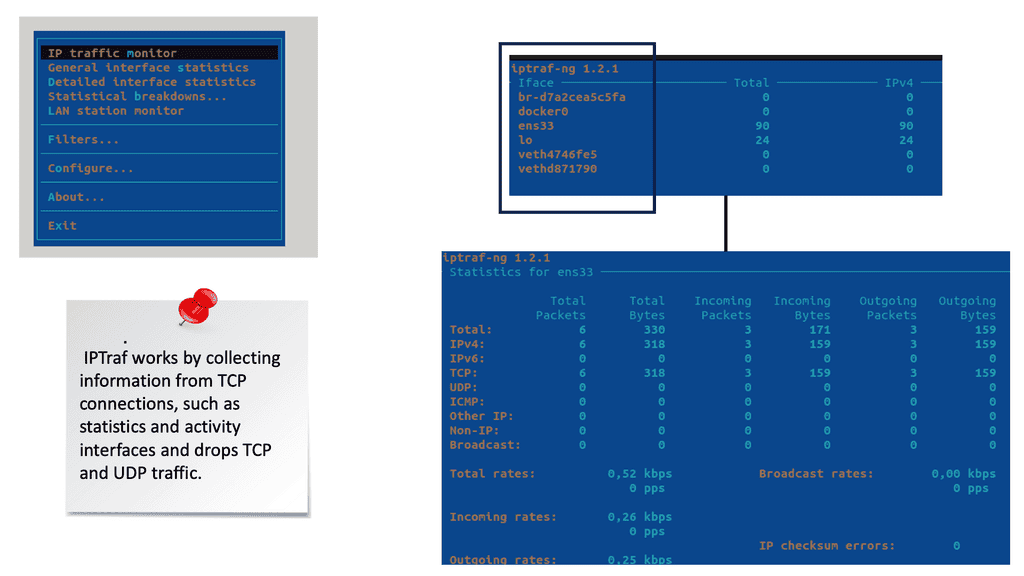
To troubleshoot the network effectively, you can use a range of tools. Some are built into the operating system, while others must be downloaded and run. Depending on your experience, you may choose a top-down or a bottom-up approach.
Required: Consistent Bandwidth & Unified Latency
We must focus on consistent bandwidth and unified latency for ALL flow types and workloads to satisfy varied conditions and achieve predictable application performance for a low latency network design. Poor performance is due to many factors that can be controlled.
Bandwidth refers to the maximum data transfer rate of an internet connection. It determines how quickly information can be sent and received. Consistent bandwidth ensures that data flows seamlessly, minimizing interruptions and delays. It is the foundation for an enjoyable and productive online experience.
To identify bandwidth limitations, it is crucial to conduct thorough testing. Bandwidth tests measure the speed and stability of your internet connection. They provide valuable insights into potential bottlenecks or network issues affecting browsing, streaming, or downloading activities. By knowing your bandwidth limitations, you can take appropriate steps to optimize your online experience.
Choosing the Right Bandwidth Testing Tools
Several bandwidth testing tools are available, both online and offline. These tools accurately measure your internet speed and provide detailed reports on download and upload speeds, latency, and packet loss. Some popular options include Ookla’s Speedtest, Fast.com, and DSLReports. Choose a tool that suits your needs and provides comprehensive results.
**Start With A Baseline**
So, at the start, you must find the baseline and work from there. Baseline engineering is a critical approach to determining the definitive performance of software and hardware. Once you have a baseline, you can work from there, testing packet loss.
Depending on your environment, such tests may include chaos engineering kubernetes, which intentionally brake systems in a controlled environment to learn and optimize performance. To fully understand a system or service, you must deliberately break it. An example of some Chaos engineering tests include:
Example – Chaos Engineering:
- Simulating the failure of a micro-component and dependency.
- Simulating a high CPU load and sudden increase in traffic.
- Simulating failure of the entire AZ ( Availability Zone ) or region.
- Injecting latency and byzantine shortcomings in services.
Related: Before you proceed, you may find the following helpful:
Dropped Packet Test
Reasons for packet loss
Packet loss can occur for several reasons. It describes lost packets of data that do not reach their destination after being transmitted across a network. Packet loss occurs when network congestion, hardware issues, software bugs, and other factors cause dropped packets during data transmission.
The best way to measure packet loss using ping is to send a series of pings to the destination and look for failed responses. For instance, if you ping something 50 times and get only 49 ICMP replies, you can estimate packet loss at roughly 2%. There is no specific value of what would be a concern. It depends on the application. For example, voice applications are susceptible to latency and loss, but other web-based applications have a lot of tolerance.
However, if I were going to put my finger in the air with some packet loss guidelines, generally, a packet loss rate of 1 to 2.5 percent is acceptable. This is because packet loss rates are typically higher with WiFi networks than with wired systems.
Significance of Dropped Packet Test:
1. Identifying Network Issues: By intentionally dropping packets, network administrators can identify potential bottlenecks, congestion, or misconfigurations in the network infrastructure. This test helps pinpoint the specific areas where packet loss occurs, enabling targeted troubleshooting and optimization.
2. Evaluating Network Performance: The Dropped Packet Test provides valuable insights into the network’s performance by measuring the packet loss rate. Network administrators can use this information to analyze the impact of packet loss on application performance, user experience, and overall network efficiency.
3. Testing Network Resilience: By intentionally creating packet loss scenarios, network administrators can assess the resilience of their network infrastructure. This test helps determine if the network can handle packet loss without significant degradation and whether backup mechanisms, such as redundant links or failover systems, function as intended.
Network administrators utilize specialized tools or software to conduct the Dropped Packet Test. These tools generate artificial packet loss by dropping a certain percentage of packets during data transmission. The test can be performed on specific network segments, individual devices, or the entire network infrastructure.
Best Practices for Dropped Packet Testing:
1. Define Test Parameters: Before conducting the test, it is crucial to define the desired packet loss rate, test duration, and the specific network segments or devices to be tested. Having clear objectives ensures that the test yields accurate and actionable results.
2. Conduct Regular Testing: Regularly performing the Dropped Packet Test allows network administrators to detect and resolve network issues before they impact critical operations. It also helps monitor the effectiveness of implemented solutions over time.
3. Analyze Test Results: After completing the test, careful analysis of the test results is essential. Network administrators should examine the impact of packet loss on latency, throughput, and overall network performance. This analysis will guide them in making informed decisions to optimize the network infrastructure.
**General performance and packet loss testing**
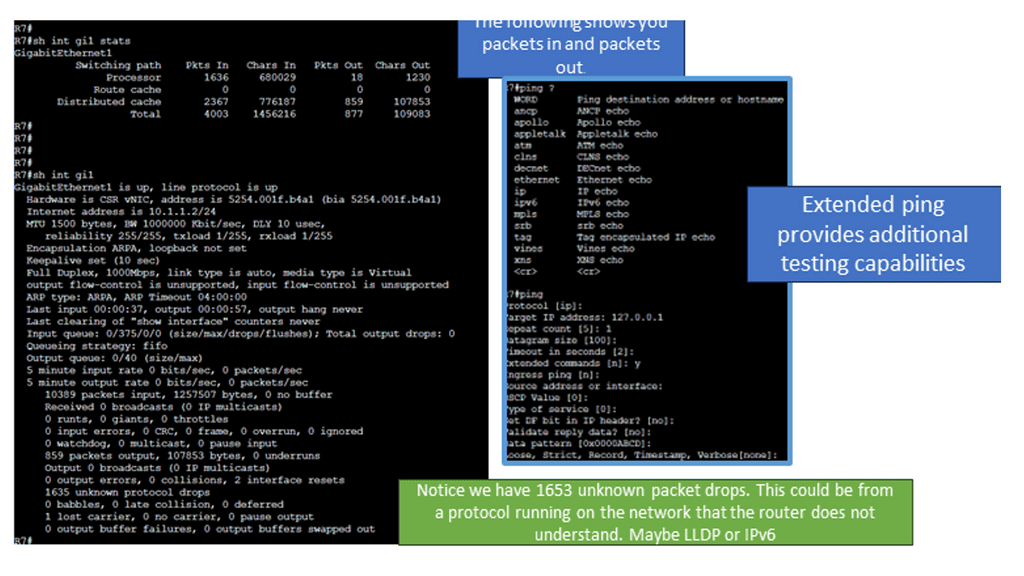
The following screenshot is taken from a Cisco ISR router. Several IOS commands can be used to check essential performance. The command shows interface gi1 stats and generic packet in and out information. I would also monitor input and output errors with the command: show interface gi1. Finally, for additional packet loss testing, you can opt for an extended ping that gives you more options than a standard ping. It would be helpful to test from different source interfaces or vary the datagram size to determine any MTU issues causing packet loss.
What Is Packet Loss? Testing Packet Loss
Packet loss results from a packet being sent and somehow lost before it reaches its intended destination. This can happen because of several reasons. Sometimes, a router, switch, or firewall has more traffic coming at it than it can handle and becomes overloaded.
This is known as congestion, and one way to deal with it is to drop packets so you can focus capacity on the rest of the traffic. Here is a quick tip before we get into the details: Keep an eye on buffers!
So, to start testing packet loss, one factor that can be monitored is buffer sizes in the network devices that interconnect source and destination points. Poor buffers cause bandwidth to be unfairly allocated among different types of flows. If some flows do not receive adequate bandwidth, they will exhibit long tails and completion times, degrading performance and resulting in packet drops in the network.
Application Performance
The speed of a network is all about how fast you can move and complete a data file from one location to another. Some factors are easy to influence, and others are impossible, such as the physical distance from one point to the next.
This is why we see a lot of content distributed closer to the source, with intelligent caching, for example, improving user response latency and reducing the cost of data transmission. The TCP’s connection-oriented procedure will affect application performance for different distance endpoints than for source-destination pairs internal to the data center.
We can’t change the laws of physics, and distance will always be a factor, but there are ways to optimize networking devices to improve application performance. One way is to optimize the buffer sizes and select the exemplary architecture to support applications that send burst traffic. There is considerable debate about whether big or small buffers are best or whether we need lossless transport or drop packets.
TCP congestion control
The TCP congestion control and network device buffer significantly affect the time it takes for the flow to complete. TCP, invented over 35 years ago, ensures that sent data blocks are received intact. It also creates a logical connection between source-destination pairs and endpoints at the lower IP layer.
The congestion control element was added later to ensure that data transfers can be accelerated or slowed down based on current network conditions. Congestion control is a mechanism that prevents congestion from occurring or relieves it once it appears. For example, the TCP congestion window limits how much data a sender can send into a network before receiving an acknowledgment.
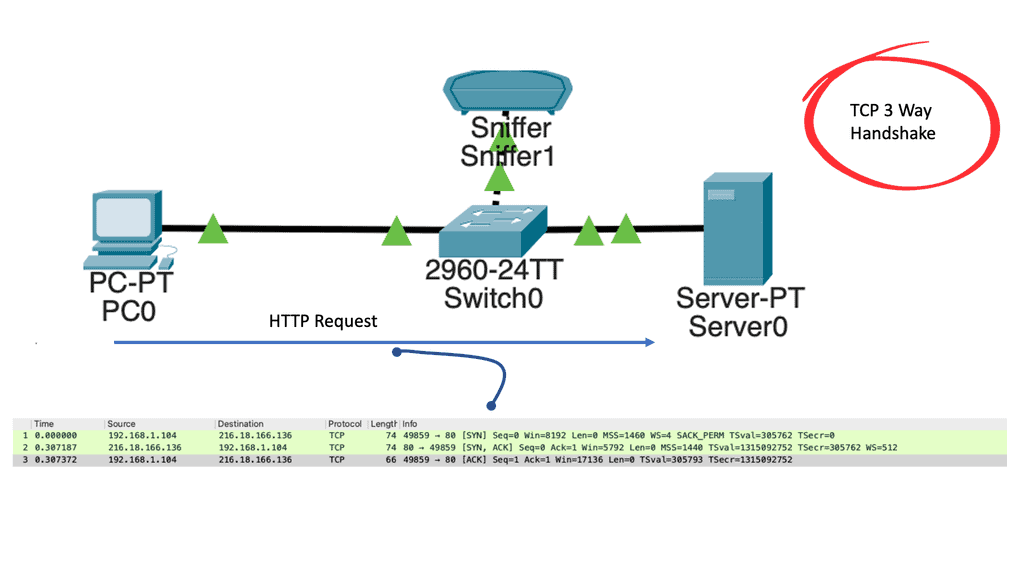
In the following lab guide, I have attached a host and a web server with a packet sniffer. All ports are in the default VLAN, and the server runs the HTTP service. Once we open the web browser on the host to access the server, we can see the operations of TCP with the 3-way handshake. We have captured the traffic between the client PC and a web server.
TCP uses a three-way handshake to connect the client and server (SYN, SYN-ACK, ACK). First things first: Why is a three-way handshake called a three-way handshake? Three segments are exchanged between the client and server to establish a TCP connection.
Big buffers vs. small buffers
Both small and large buffer sizes have different effects on application flow types. Some sources claim that small buffer sizes optimize performance, while others claim that larger buffers are better.
Many web giants, including Facebook, Amazon, and Microsoft, use small buffer switches. It depends on your environment. Understanding your application traffic pattern and testing optimization techniques are essential to finding the sweet spot. Most out-of-the-box applications will not be fine-tuned for your environment; the only rule of thumb is to lab test.
**TCP interaction**
Complications arise when TCP congestion control interacts with the network device buffer. The two have different purposes. TCP congestion control continuously monitors network bandwidth using packet drops as a metric, while buffering is used to avoid packet loss.
In a congestion scenario, the TCP is buffered, but the sender and receiver cannot know there is congestion, and the TCP congestion behavior is never initiated. So, the two mechanisms used to improve application performance don’t complement each other and require careful packet loss testing for your environment.
Dropped Packet Test: The Approac
Ping and Traceroute: Where is the packet loss?
At a fundamental level, we have ping and traceroute. Ping measures round-trip times between your computer and an internet destination. Traceroute measures the routers’ response times along the path between your computer and an internet destination.
These will tell you where the packet loss occurs and how severe it is. The next step with the dropped packet test is to find your network’s threshold for packet drop. Here, we have more advanced tools to understand protocol behavior, which we will discuss now.
IPEF3, TCP dump, TCP probe: Understanding protocol behavior.
A: Tools such as iperf3, TCP dump, and TCP probe can be used to test and understand the effects of TCP. There is no point looking at a vendor’s reports and concluding that their “real-world” testing characteristics fit your environment. They are only guides, and “real-world” traffic tests are misleading. Usually, no standard RFC is used for vendor testing, and they will always try to make their products appear better by tailoring the test ( packet size, etc.) to suit their environment.
B: As an engineer, you must understand the scenarios you anticipate. Be careful of what you read. Recently, there were conflicting buffer testing results from Arista 7124S and Cisco Nexus 5000.
C: The Nexus 5000 works best when most ports are congested simultaneously, while the Arista 7100 performs best when some ports are congested but not all. These platforms have different buffer architectures regarding buffer sizes, disciplines, and management, influencing how you test.
TCP congestion control: Bandwidth capture effect
The discrepancy and uneven bandwidth allocation for flow boil down to the natural behavior of how TCP reacts and interacts with insufficient packet buffers and the resulting packet drops. The behavior is known as the TCP/IP bandwidth capture effect.
The TCP/IP bandwidth capture effect does not affect the overall bandwidth but more individual Query Completion Times and Flow Completion Times (FCT) for applications. Therefore, the QCT and FCT are prime metrics for measuring TCP-based application performance.
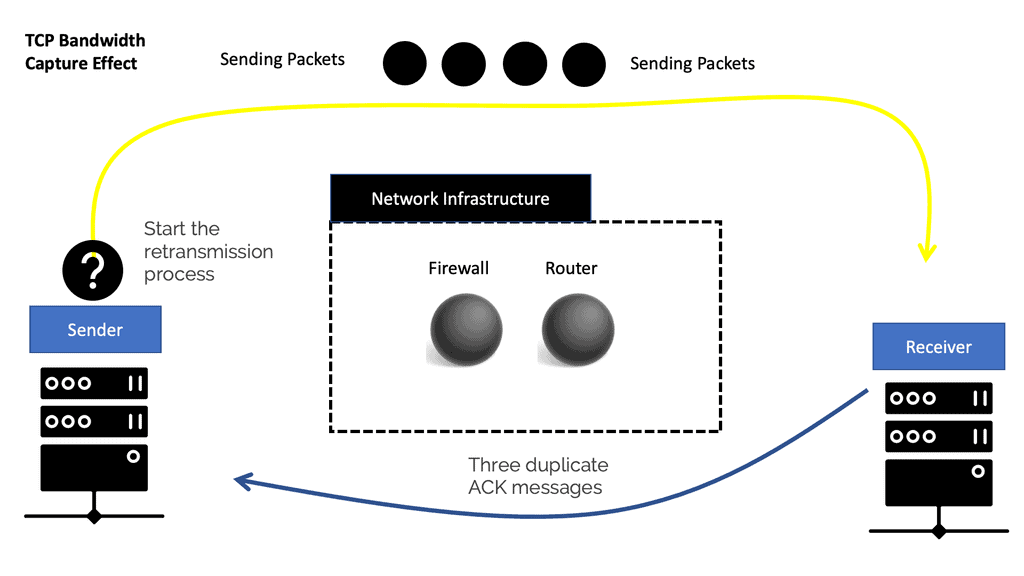
A TCP stream’s transmission pace is based on a built-in feedback mechanism. The ACK packets from the receiver adjust the sender’s bandwidth to match the available network bandwidth. With each ACK received, the sender’s TCP increases the pace of sending packets to use all available bandwidth. On the other hand, TCP takes three duplicate ACK messages to conclude packet loss on the connection and start the retransmission process.
TCP-dropped flows
So, in the case of inadequate buffers, packets are dropped to signal the sender to ease the transmission rate. TCP-dropped flows start to back off and naturally receive less bandwidth than the other flows that do not back off.
The flows that don’t back off get hungry and take more bandwidth. This causes some flows to get more bandwidth than others unfairly. By default, the decision to drop some flows and leave others alone is not controlled and is made purely by chance.
This conceptually resembles the Ethernet CSMA/CD bandwidth capture effect in shared Ethernet. Stations colliding with other stations on a shared LAN would back off and receive less bandwidth. This is not too much of a problem because all switches support full-duplex.
DCTP & Explicit Congestion Notification (ECN)
There is a new variant of TCP called DCTP, which improves congestion behavior. When used with commodity, shallow-buffered switches, DCTCP uses 90% less buffer space within the network infrastructure than TCP. Unlike TCP, the protocol is also burst-tolerant and provides low short-flow latency. DCTCP relies on ECN to enhance the TCP congestion control algorithms.
DCTP tries to measure how often you experience congestion and use that to determine how fast it should reduce or increase its offered load based on the congestion level. DCTP certainly reduces latency and provides more appropriate behavior between streams. The recommended approach is to use DCTP with both ECN and Priority Flow control (pause environments).
Dropped packet test with Microbursts
Microbursts are a type of small bursty traffic pattern lasting only for a few microseconds, commonly seen in Web 2 environments. This traffic is the opposite of what we see with storage traffic, which always has large bursts.
Bursts only become a problem and cause packet loss when there is oversubscription; many communicate with one. This results in what is known as fan-in, which causes packet loss. Fan-in could be a communication pattern consisting of 23-to-1 or 47-to-1, n-to-many unicast, or multicast. All these sources send packets to one destination, causing congestion and packet drops. One way to overcome this is to have sufficient buffering.
Network devices need sufficient packet memory bandwidth to handle these types of bursts. Fan-in can increase end-to-end latency-critical application performance if they don’t have the required buffers. Of course, latency is never good for application performance, but it’s still not as bad as packet loss. When the switch can buffer traffic correctly, packet loss is eliminated, and the TCP window can scale to its maximum size.
Mice & elephant flows.
For the dropped packet test, you must consider two flow types in data center environments. First, we have a large elephant and smaller mice flow. Elephant flows might only represent a low proportion of the total flows but consume most of the total data volume.
Mice flow, for example, control and alarm/control messages, are usually pretty significant. As a result, they should be given priority over more significant elephant flows, but this is sometimes not the case with simple buffer types that don’t distinguish between flow types.
Properly regulating the elephant flows with intelligent switch buffers can be given priority. Mice flow is often bursty flow where one query is sent to many servers.
Many small queries are sent back to the single originating host. These messages are often small, only requiring 3 to 5 TCP packets. As a result, the TCP congestion control mechanism may not even be evoked as the congestion mechanisms take three duplicate ACK messages. However, due to the size of elephant flows, they will invoke the TCP congestion control mechanism (mice flows don’t as they are too small).
Testing packet loss: Reactions to buffer sizes
When combined in a shared buffer, mice and elephant flows react differently. Small, deep buffers operate on a first-come, first-served basis and do not distinguish between different flow sizes; everyone is treated equally. Elephants can fill out the buffers and starve mice’s flow, adding to their latency.
On the other hand, bandwidth-aggressive elephant flows can quickly fill up the buffer and impact sensitive mice flows. Longer latency results in longer flow completion time, a prime measuring metric for application performance.
On the other hand, intelligent buffers understand the types of flows and schedule accordingly. With intelligent buffers, elephant flows are given early congestion notification, and the mice flow is expedited under stress. This offers a better living arrangement for both mice and elephant flows.
First, you need to be able to measure your application performance and understand your scenarios. Small buffer switches are used for the most critical applications and do very well. You are unlikely to make a wrong decision with small buffers, so it’s better to start by tuning your application. Out-of-the-box behavior is generic and doesn’t consider failures or packet drops.
The way forward is understanding the application and tuning of host and network devices in an optimized leaf and spine fabric. If you have a lot of incest traffic, having large buffers on the leaf will benefit you more than having large buffers on the Spine.
Closing Points on Dropped Packet Test
Understanding the reasons behind packet drops is essential for any network troubleshooting endeavor. Common causes include network congestion, hardware issues, or misconfigured network devices. Congestion happens when the network is overwhelmed by too much traffic, leading to packet loss. Faulty hardware, such as a bad router or switch, can also contribute to this problem. Additionally, incorrect network settings or protocols can lead to packets being misrouted or lost altogether.
**The Dropped Packet Test: A Diagnostic Tool**
The dropped packet test is a fundamental diagnostic approach used by network administrators to identify and address packet loss issues. This test typically involves using tools like ping or traceroute to send packets to a specific destination and measure the percentage of packets that successfully make the trip. Through this process, administrators can pinpoint where in the network the packets are being dropped and take corrective actions.
Once the dropped packet test is performed, the results need to be carefully analyzed. A high percentage of packet loss indicates a significant problem that requires immediate attention. It could be a sign of a failing network component or a need for increased bandwidth. On the other hand, occasional packet drops might be normal in a busy network but should be monitored to ensure they do not escalate.
Addressing packet loss involves a combination of hardware upgrades, network optimization, and configuration adjustments. Replacing outdated or faulty equipment, increasing bandwidth, and optimizing network settings can significantly reduce packet drops. Regular network monitoring and maintenance are also critical in preventing packet loss from becoming a recurring issue.
Summary: Dropped Packet Test
Ensuring smooth and uninterrupted data transmission in the fast-paced networking world is vital. One of the challenges that network administrators often encounter is dealing with dropped packets. These packets, which fail to reach their intended destination, can cause latency, data loss, and overall network performance issues. This blog post delved into the dropped packet test, its importance, and how it can help identify and resolve network problems effectively.
Understanding Dropped Packets
Dropped packets are packets of data that are discarded or lost during transmission. This can occur for various reasons, such as network congestion, hardware failures, misconfigurations, or insufficient bandwidth. When packets are dropped, it disrupts the data flow, leading to delays or complete data loss. Understanding the impact of dropped packets is crucial for maintaining a reliable and efficient network.
Conducting the Dropped Packet Test
The dropped packet test is a diagnostic technique used to assess the quality and performance of a network. It involves sending test packets through the network and monitoring their successful delivery. By analyzing the results, network administrators can identify potential bottlenecks, misconfigurations, or faulty equipment that may be causing packet loss. This test can be performed using various tools and utilities available in the market, such as network analyzers or packet sniffers.
Interpreting Test Results
Once the dropped packet test is conducted, the next step is to interpret the test results. The results will typically provide information about the percentage of dropped packets, the specific network segments or devices where the drops occur, and the potential causes behind the packet loss. This valuable data allows administrators to promptly pinpoint and address the root causes of network performance issues.
Troubleshooting and Resolving Packet Loss
Network administrators can delve into troubleshooting and resolving the issue upon identifying the sources of packet loss. This may involve adjusting network configurations, upgrading hardware components, optimizing bandwidth allocation, or implementing Quality of Service (QoS) mechanisms. The specific actions will depend on the nature of the problem and the network infrastructure in place. Administrators can significantly improve network performance and maintain smooth data transmission with a systematic approach based on the dropped packet test results.
Conclusion
The dropped packet test is an indispensable tool in the arsenal of network administrators. Administrators can proactively address network issues and optimize performance by understanding the concept of dropped packets, conducting the test, and effectively interpreting the results. Organizations can ensure seamless communication, efficient data transfer, and enhanced productivity with a robust and reliable network.
- DMVPN - May 20, 2023
- Computer Networking: Building a Strong Foundation for Success - April 7, 2023
- eBOOK – SASE Capabilities - April 6, 2023



[…] rapidly detect failures, avoid failed links, circumvent prefix hijacking and utilize multiple paths to mitigate congestion, perform built-in network caching and native multicast data […]
[…] rapidly detect failures, avoid failed links, circumvent prefix hijacking and utilize multiple paths to mitigate congestion, perform built-in network caching and native multicast data […]