
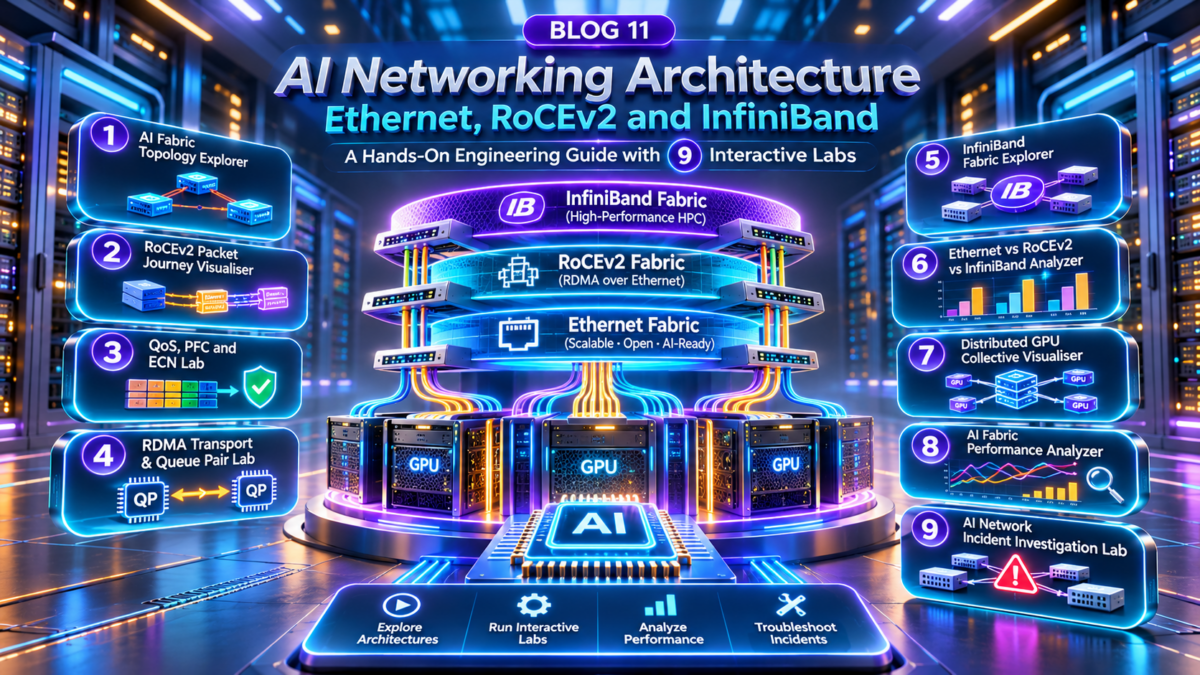
AI Networking Architecture Explained: Ethernet, RoCEv2, InfiniBand and High-Performance GPU Fabrics
Artificial intelligence infrastructure introduces networking requirements that extend beyond traditional enterprise and data centre connectivity. Large GPU clusters must exchange enormous volumes of data during distributed training, synchronise model parameters, move tensors between accelerators and maintain high utilisation across thousands of parallel compute operations.
In these environments, network performance can directly influence the efficiency of expensive GPU resources. Congestion, packet loss, latency variation, inefficient collective communication and imbalanced fabric paths can cause accelerators to spend time waiting for data rather than performing useful computation.
Architecture interpretation: The diagram is conceptual. The fabric represents an Ethernet/RoCEv2 or InfiniBand deployment alternative, not a requirement to run both technologies on the same links. Scale-up interconnects operate within supported GPU systems, while scale-out fabrics connect separate compute nodes. Storage and management network placement varies by cluster design.
Why AI Networking Is Different
Traditional enterprise networks are often optimised for diverse client-server traffic, transaction processing, web applications and general-purpose connectivity.
AI training fabrics must additionally support communication patterns in which many GPUs exchange data at high rates and coordinate execution across distributed workloads.
Communication Intensity
Distributed training can create substantial east-west traffic between GPU nodes.
Low-Latency Operations
Collective communication can be sensitive to network delay and tail latency.
Congestion Sensitivity
Congestion and retransmission can reduce effective accelerator utilisation.
High Bandwidth
Large distributed workloads demand substantial aggregate network throughput.
Transport Engineering
RDMA and congestion control require careful NIC and fabric configuration.
Compute-Network Coupling
Communication stalls can leave GPU resources waiting for synchronisation.
Three Communication Domains in AI Infrastructure
Scale-Up Communication
Scale-up networking connects accelerators within a server or tightly coupled compute system. Technologies such as NVLink and NVSwitch enable high-bandwidth GPU-to-GPU communication on supported hardware.
Scale-Out Communication
Scale-out networking connects GPU servers across a data centre fabric. Ethernet with RoCEv2 and InfiniBand are important approaches for high-performance distributed communication.
Front-End and Supporting Connectivity
AI clusters also require management, orchestration, storage access, monitoring and application connectivity. These functions may use dedicated networks, shared fabrics or logically isolated network segments depending on design requirements.
Ethernet, RoCEv2 and InfiniBand: The Architectural Relationship
| Technology | Primary role | Engineering consideration |
|---|---|---|
| Ethernet | Layer 2 networking technology and switching fabric | Topology, routing, QoS, congestion and operational tooling |
| RoCEv2 | RDMA transport over UDP/IP on Ethernet networks | NIC configuration, congestion control and packet-loss behaviour |
| InfiniBand | Dedicated high-performance interconnect architecture | Fabric management, routing, virtual lanes and adapter compatibility |
| NVLink / NVSwitch | High-bandwidth GPU interconnect within supported scale-up systems | Hardware topology, collective communication and locality |
Important distinction: Ethernet and RoCEv2 are not competing technologies at the same architectural layer. RoCEv2 is an RDMA transport that uses Ethernet and IP networking. The more useful engineering comparison is often Ethernet with RoCEv2 versus InfiniBand for a particular scale-out GPU workload.
What Engineers Must Optimise
AI fabric design should be evaluated against the actual communication pattern of the workload, not only the advertised link speed of individual switches or network adapters.
Aggregate Throughput
How much useful data the cluster can exchange.
Tail Latency
How the slowest communication operations affect synchronisation.
Fabric Utilisation
How effectively available paths carry traffic.
Congestion Behaviour
How switches and endpoints react to pressure.
Failure Recovery
How the system responds to link, device and path failures.
GPU Efficiency
How much accelerator time is spent on useful computation.
Introduction — Engineering Perspective
AI networking is the engineering discipline that connects accelerator architecture, distributed communication, high-speed switching, RDMA transport, congestion control and production operations. The objective is not simply to build the fastest possible network, but to design a predictable, observable and resilient fabric that supports the communication requirements of large-scale AI workloads.
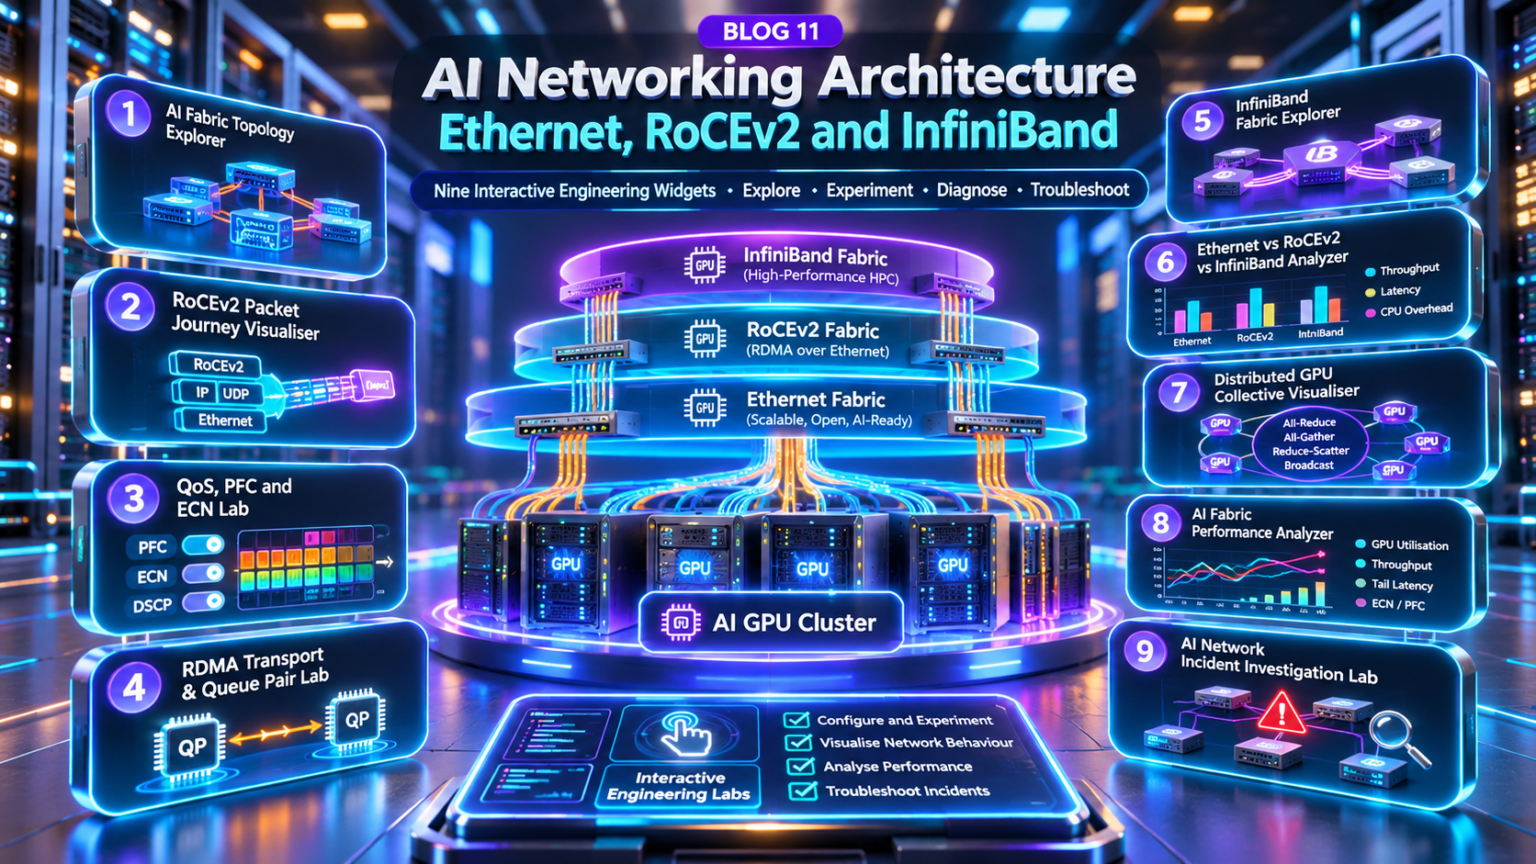
Explore the AI Networking Fabric
Follow the engineering journey from GPU cluster architecture and Ethernet fabrics to RoCEv2, InfiniBand, collective communication, performance observability and production troubleshooting. Select any section to jump directly to its detailed technical explanation.
AI Networking Architecture Fundamentals: GPU Clusters, Scale-Up, Scale-Out and Distributed Communication
Modern AI infrastructure is built around accelerated compute systems that must communicate at extremely high bandwidth and with predictable latency. A distributed GPU cluster combines compute nodes, accelerator interconnects, high-performance network adapters, switching fabrics and supporting services into a coordinated computing platform.
The network is not simply a connectivity service between servers. For many distributed AI workloads, communication performance directly affects training efficiency, synchronisation time and overall accelerator utilisation.
1.1 — Layered AI GPU Cluster Architecture
An AI cluster can be understood as three connected architectural domains: the GPU scale-up interconnect, the scale-out high-performance fabric and the front-end supporting infrastructure.
Architecture interpretation: The GPU blocks represent accelerators within individual compute nodes. Scale-up communication operates inside supported systems, while scale-out communication crosses the network fabric between separate nodes. Actual clusters may contain many more GPUs per node and multiple network adapters per server.
1.2 — Core Components of an AI GPU Cluster
GPU Accelerators
Execute matrix operations and parallel AI workloads.
GPU Interconnect
Connect accelerators within supported scale-up systems.
Network Adapters
Provide high-speed communication between compute nodes.
Switching Fabric
Connect GPU servers across the cluster.
Storage Systems
Supply training data, checkpoints and model artifacts.
Cluster Orchestration
Schedule workloads and coordinate distributed execution.
1.3 — Scale-Up vs Scale-Out Networking
| Characteristic | Scale-Up | Scale-Out |
|---|---|---|
| Communication scope | Within a server or supported tightly coupled GPU system | Between separate compute nodes |
| Typical technologies | NVLink, NVSwitch and related accelerator interconnects | Ethernet/RoCEv2 or InfiniBand |
| Primary objective | High-bandwidth local accelerator communication | High-performance distributed communication |
| Topology considerations | GPU interconnect topology and locality | Switching fabric, path diversity and oversubscription |
| Performance risks | Local interconnect contention and topology mismatch | Congestion, packet loss, imbalance and network failures |
1.4 — Distributed Training Communication
Distributed training splits model computation across multiple accelerators or compute nodes. Communication is required to exchange gradients, model parameters, activations or other intermediate data depending on the parallelism strategy.
Data Parallelism
Workers process different data batches and synchronise relevant gradients.
Tensor Parallelism
Model tensor operations are partitioned across accelerators.
Pipeline Parallelism
Different model stages execute on separate accelerators or groups.
Engineering insight: The communication pattern depends on the parallelism strategy. A fabric optimised for one workload may perform differently under another. Network design should therefore consider the actual training framework and collective communication behaviour.
1.5 — Collective Communication Fundamentals
Collective operations coordinate data exchange between multiple accelerators. They are central to many distributed training workloads.
| Collective | Purpose | Typical use |
|---|---|---|
| All-Reduce | Combine values and distribute the result | Gradient synchronisation |
| All-Gather | Collect data from all participants | Distributed tensor assembly |
| Reduce-Scatter | Reduce data and distribute partitions | Partitioned gradient processing |
| Broadcast | Distribute data from one participant | Parameter distribution |
| All-to-All | Exchange different data partitions among participants | Expert routing and distributed workloads |
1.6 — GPU Efficiency and Network Communication Overhead
A GPU may complete a compute phase but remain unable to proceed until required communication has finished. This creates a relationship between network performance and useful accelerator execution time.
This simplified example assumes no overlap between computation and communication. Real distributed training systems may overlap these operations, and measured GPU utilisation depends on additional factors such as memory stalls, kernel scheduling and workload behaviour.
1.7 — Front-End and Back-End AI Network Separation
Back-End Compute Fabric
Carries latency-sensitive, high-bandwidth communication between GPU nodes. It may require specialised RDMA configuration, congestion management and detailed fabric telemetry.
Front-End Services Network
Supports workload orchestration, management access, application connectivity, monitoring and other supporting services. Storage traffic may use this network or a separate dedicated fabric.
1.8 — AI Cluster Network Design Considerations
| Design area | Engineering question |
|---|---|
| Bandwidth | Can the fabric support expected collective traffic? |
| Topology | Are paths balanced and sufficient for the workload? |
| Congestion | How will the network respond to bursts and incast? |
| Reliability | How will link or switch failures affect training jobs? |
| Observability | Can engineers correlate GPU stalls with network behaviour? |
| Scalability | Can additional compute nodes be added without unacceptable performance degradation? |
| Operations | Are configuration, firmware and troubleshooting processes repeatable? |
Section 1 — Engineering Takeaway
AI networking architecture combines GPU compute systems, scale-up interconnects, scale-out network fabrics, distributed communication, collective operations and supporting services. The network must be designed around the communication characteristics of the AI workload, because network congestion, latency and failures can directly affect distributed training efficiency and accelerator utilisation.
AI GPU Network Architecture Explorer
Explore the relationship between GPU compute nodes, scale-up interconnects, scale-out fabrics and supporting networks. Change the cluster topology, communication pattern and network capacity to understand how distributed AI workloads interact with the underlying network architecture.
GPU cluster architecture configuration
Architecture engineering inspector
Scale-up vs scale-out
Scale-up communication connects GPUs within a tightly coupled system. Scale-out communication connects separate GPU servers through a network fabric.
Engineering check: identify which communication operations remain local and which cross the fabric.Architecture diagnostics console
Engineering interpretation
Ethernet Fabric Design for AI Clusters: Leaf-Spine, Clos, ECMP, Bandwidth and Network Engineering
Ethernet has become an important foundation for large-scale AI infrastructure, providing a flexible switching architecture that can connect GPU servers through high-bandwidth, multi-path network fabrics.
For AI workloads, the engineering challenge extends beyond selecting high-speed Ethernet ports. The fabric must deliver sufficient aggregate capacity, balanced traffic distribution, predictable congestion behaviour and resilient connectivity between distributed compute nodes.
2.1 — Leaf-Spine Ethernet Fabric Architecture
A leaf-spine fabric uses a structured topology in which leaf switches connect GPU servers and spine switches provide multiple paths between leaves.
In a conventional two-tier Clos design, each leaf connects to every spine in its fabric group. This creates predictable path diversity and supports horizontal scaling through additional switching capacity.
Architecture interpretation: The diagram shows a simplified two-tier Clos topology. Production AI fabrics may use additional tiers, multiple network interfaces per GPU server, separate rail architectures and more sophisticated failure-domain boundaries.
2.2 — Why Clos Fabrics Matter for AI Workloads
Path Diversity
Multiple fabric paths connect compute nodes across the cluster.
Horizontal Scaling
Capacity can increase through additional switching resources.
Predictable Structure
Regular topology simplifies design, automation and troubleshooting.
Resilience
Redundant links and switches reduce single failure dependencies.
High Aggregate Capacity
Parallel uplinks support substantial east-west traffic.
Operational Consistency
Repeatable designs support standardised configuration and telemetry.
2.3 — High-Speed Ethernet: 200G, 400G and 800G
High-performance AI fabrics may use 200GbE, 400GbE or 800GbE interfaces, depending on adapter capabilities, switch platforms, optical connectivity and deployment requirements.
| Interface speed | Nominal line rate | Engineering consideration |
|---|---|---|
| 200GbE | 200 Gbit/s | Adapter availability, port density and cost |
| 400GbE | 400 Gbit/s | High-bandwidth GPU node and fabric connectivity |
| 800GbE | 800 Gbit/s | Platform support, optics, cabling and power |
Capacity distinction: Advertised interface speed is not the same as application-level throughput. Ethernet, IP, transport and RDMA overhead, congestion behaviour and workload characteristics affect effective data transfer rates.
2.4 — Oversubscription and Fabric Capacity Planning
Oversubscription describes the ratio between aggregate downlink capacity and aggregate uplink capacity at a network tier.
A 1:1 ratio means that nominal aggregate uplink bandwidth matches nominal downlink bandwidth. It does not guarantee congestion-free operation because traffic distribution, bursts, endpoint behaviour and other fabric bottlenecks still matter.
Design recommendation: For communication-intensive GPU training workloads, evaluate oversubscription against the expected collective traffic pattern rather than assuming traditional enterprise ratios are appropriate.
2.5 — Equal-Cost Multipath Routing
ECMP allows a routed fabric to install multiple equal-cost next hops toward the same destination. Traffic can then be distributed across available fabric paths.
Flow-Based Distribution
Many implementations select an ECMP path using a hash of packet header fields. Packets belonging to the same flow commonly follow the same path, helping limit reordering.
AI Traffic Considerations
Large RDMA flows may create uneven path utilisation when hash distribution is imperfect. Some platforms support additional load-balancing mechanisms, subject to hardware and transport compatibility.
ECMP limitation: ECMP does not automatically divide a single large flow evenly across every available path. Effective distribution depends on flow diversity, hash inputs and the specific switch implementation.
2.6 — Routing Architecture for AI Ethernet Fabrics
Routed leaf-spine fabrics commonly use Layer 3 connectivity between switching tiers. Routing protocols provide topology reachability and support multiple paths through the network.
| Design component | Engineering purpose |
|---|---|
| Layer 3 underlay | Provide routed connectivity between fabric devices |
| ECMP | Install multiple equal-cost next hops |
| BGP or supported IGP | Exchange network reachability |
| Loopback addressing | Provide stable router identities and management endpoints |
| Routing convergence | Restore reachability after topology changes |
| Telemetry | Monitor interface, routing and forwarding state |
2.7 — Failure Domains and Resilience
AI training jobs may span many compute nodes, making the network failure domain an important architectural consideration.
Link Failure
Traffic may move to alternate paths if routing and available capacity permit.
Leaf Failure
Connected GPU nodes may lose fabric connectivity without redundant attachments.
Spine Failure
Remaining spines may continue forwarding with reduced aggregate capacity.
NIC Failure
Endpoint redundancy depends on the server and fabric design.
Optical Failure
Transceiver and cabling faults can produce errors or link loss.
Control-Plane Failure
Routing instability can affect reachability and path selection.
2.8 — Ethernet Fabric Engineering Checklist
| Area | Validation question |
|---|---|
| Topology | Does the Clos design provide the required path diversity? |
| Capacity | Can uplinks support the expected aggregate workload? |
| Routing | Are all expected ECMP paths installed? |
| Load balancing | Are traffic flows distributed acceptably? |
| Physical layer | Are optics, cabling and interface errors within acceptable limits? |
| Resilience | Does the design tolerate required failure scenarios? |
| Telemetry | Can engineers identify congestion and path imbalance? |
| Automation | Are configurations repeatable and auditable? |
Section 2 — Engineering Takeaway
Ethernet AI fabric engineering combines leaf-spine and Clos topology design, high-speed Ethernet interfaces, ECMP routing, capacity planning, oversubscription analysis, failure-domain design and production telemetry. The objective is to provide a scalable and predictable network foundation for distributed GPU communication.
AI Ethernet Fabric Design Workbench
Design a simplified leaf-spine Ethernet fabric for GPU clusters. Configure rack count, leaf and spine switches, link speeds and GPU network demand. Trace ECMP paths, inject a spine failure and investigate oversubscription and available uplink capacity.
Ethernet fabric design configuration
Fabric engineering inspector
Leaf-Spine Architecture
Each leaf connects to each spine, creating multiple equal-cost paths between GPU racks.
Engineering check: compare rack downlink demand against available leaf uplink bandwidth.Fabric diagnostics console
Fabric engineering assessment
RDMA and RoCEv2 Packet Architecture: Queue Pairs, Memory Registration, Encapsulation and GPU Data Transfer
Remote Direct Memory Access, or RDMA, enables network adapters to transfer data directly between registered memory regions with less involvement from the remote CPU than conventional socket-based data movement.
RoCEv2, or RDMA over Converged Ethernet version 2, carries RDMA transport traffic across UDP/IP networks using Ethernet infrastructure. It is particularly important in high-performance AI environments where distributed GPU workloads exchange large volumes of data.
3.1 — End-to-End RoCEv2 Architecture
A RoCEv2 transfer involves application software, registered memory, RDMA queue pairs, network adapters, the IP/Ethernet fabric and a receiving endpoint.
Engineering distinction: RDMA reduces CPU involvement in data movement, but it does not remove all software processing or eliminate the need for transport reliability. Applications still configure resources, register memory, post work requests and process completion information.
3.2 — RDMA Operations
RDMA Write
A requester places data into an authorised remote memory region.
RDMA Read
A requester retrieves data from an authorised remote memory region.
Send / Receive
A message is delivered to a receive buffer posted by the peer.
3.3 — Queue Pair Architecture
A queue pair typically contains a Send Queue and Receive Queue. Applications submit work requests through the RDMA verbs interface, while the network adapter processes transport operations.
| Component | Function |
|---|---|
| Send Queue (SQ) | Holds submitted send-side work requests |
| Receive Queue (RQ) | Holds receive buffers for applicable incoming operations |
| Completion Queue (CQ) | Reports completion information for signalled operations and receives |
| Queue Pair Number (QPN) | Identifies a queue pair within the RDMA transport context |
| Protection Domain (PD) | Associates and isolates compatible RDMA resources |
| Memory Region (MR) | Defines registered memory and access permissions |
3.4 — Memory Registration and Access Keys
Before RDMA operations can access a memory buffer, the relevant memory must be registered with the RDMA subsystem. Registration establishes the translation and access information required by the network adapter.
Local Key — lkey
Used by the local adapter to validate access to registered memory for supported local operations.
Remote Key — rkey
Authorises permitted remote RDMA operations against a registered memory region when the transport and access permissions allow.
Security consideration: RDMA access permissions and remote keys are part of memory protection, but they are not a substitute for endpoint authentication, network isolation and broader infrastructure security controls.
3.5 — RoCEv2 Packet Encapsulation
RoCEv2 carries RDMA transport headers and payloads inside UDP/IP packets. The well-known RoCEv2 UDP destination port is 4791.
Packet engineering: The precise RDMA header sequence depends on the operation and transport service. Some packets include additional headers such as the RDMA Extended Transport Header (RETH). The invariant CRC (ICRC) protects the applicable RDMA packet contents independently of the Ethernet FCS.
3.6 — Reliable Connected Transport and Packet Sequence Numbers
Reliable Connected (RC) queue pairs provide transport mechanisms for reliable, ordered delivery of supported RDMA operations.
Packet Sequence Numbers (PSNs) help detect missing, duplicated or out-of-order transport packets. Acknowledgements, negative acknowledgements and retry behaviour support recovery from certain delivery failures.
| Transport concept | Engineering purpose |
|---|---|
| PSN | Track packet ordering and transport progress |
| ACK | Confirm successful transport progress |
| NAK | Signal selected error or recovery conditions |
| Retry | Recover from supported loss or timeout conditions |
| Completion | Report work request status to the application |
Important: RoCEv2 does not guarantee that packets will never be dropped. Loss and congestion can still occur, and transport recovery may introduce latency or cause operations to fail when retry limits are exhausted.
3.7 — RoCEv2 and GPUDirect RDMA
In supported GPU platforms, GPUDirect RDMA can allow compatible third-party devices, including network adapters, to access GPU memory without requiring the application to stage every transfer through a conventional host-memory copy.
This can reduce unnecessary data movement and CPU overhead, but practical support depends on GPU hardware, network adapters, PCIe topology, drivers, firmware and software configuration.
GPU Memory
Holds tensors and communication buffers used by AI workloads.
RDMA Adapter
Transfers data using supported registered memory resources.
System Topology
PCIe placement and device compatibility affect achievable performance.
3.8 — RoCEv2 Troubleshooting and Packet Analysis
| Symptom | Potential investigation area |
|---|---|
| Queue pair fails to connect | Endpoint addressing, QP state and connection parameters |
| RDMA access error | Memory registration, permissions, address and remote key |
| Unexpected transport retries | Packet loss, congestion, MTU and fabric errors |
| Low effective throughput | Link speed, congestion, PCIe topology and application behaviour |
| High tail latency | Queueing, congestion control and competing traffic |
| Intermittent communication stalls | NIC counters, transport timeouts and collective communication traces |
Useful Linux
diagnostic utilities
may include
rdma,
ibv_devinfo,
ibv_devices
and vendor-specific
NIC telemetry
tools. Availability
and output vary
by operating
system, drivers
and adapter
implementation.
Section 3 — Engineering Takeaway
RoCEv2 combines RDMA memory semantics, queue pairs, registered buffers, transport reliability and UDP/IP encapsulation to support high-performance data movement over Ethernet networks. Successful deployment requires coordinated engineering across the application, GPU, RDMA adapter, transport configuration and switching fabric.
RoCEv2 Packet Journey Visualiser
Follow an RDMA operation through queue-pair preparation, memory registration, work request submission, RoCEv2 encapsulation, Ethernet forwarding, remote memory access and completion handling. Inspect packet headers and investigate transport failures.
RDMA transaction configuration
RoCEv2 packet encapsulation
Protocol engineering inspector
RoCEv2 Encapsulation
RoCEv2 transports InfiniBand transport packets inside UDP/IP over Ethernet.
Select a packet header to inspect its engineering role.RDMA diagnostics console
Transaction engineering findings
Lossless Ethernet and Congestion Control: PFC, ECN, DCQCN and AI Fabric Engineering
High-performance AI networking requires more than fast links. Distributed GPU workloads can generate synchronised bursts of network traffic, large data transfers and incast patterns that place significant pressure on switch buffers and endpoint network adapters.
When offered traffic exceeds the forwarding capacity of a network interface, packets accumulate in queues. If the congestion persists, the network may experience increased latency, packet drops, transport retries and reduced application throughput.
RoCEv2 deployments often combine Explicit Congestion Notification (ECN), Data Center Quantized Congestion Notification (DCQCN), Priority Flow Control (PFC) and QoS configuration to manage these conditions. However, these mechanisms must be engineered carefully because incorrect configuration can create additional performance problems.
4.1 — How Congestion Develops Inside an AI Ethernet Fabric
Congestion occurs when packets arrive at a forwarding resource faster than they can be transmitted. The immediate effect is queue growth, followed by increased queueing delay and potentially packet loss when available buffer space is exhausted.
Architecture interpretation: Multiple GPU senders are transmitting toward a common destination. The switch egress queue becomes congested. ECN marking can communicate congestion information to the receiving endpoint, which can generate congestion feedback for the sender. PFC operates separately through link-local pause frames when configured thresholds are reached.
4.2 — The Four Major Congestion Control Mechanisms
Switch Buffering
Absorbs temporary differences between packet arrival and departure rates.
ECN
Marks eligible packets to indicate congestion without necessarily dropping them.
DCQCN
Uses congestion feedback to adjust the sending rate of supported RoCEv2 traffic.
PFC
Pauses a selected Ethernet priority on an adjacent link to prevent buffer overflow.
QoS Classification
Maps traffic to appropriate priorities and forwarding queues.
Traffic Engineering
Uses topology, capacity and path distribution to reduce hotspots.
4.3 — Priority Flow Control: IEEE 802.1Qbb
Priority Flow Control is an Ethernet link-layer mechanism that allows a receiving device to request that its directly connected peer temporarily stop transmitting traffic belonging to specific priorities.
Unlike conventional Ethernet PAUSE, which pauses all traffic on a link, PFC supports selective pause behaviour for individual traffic priorities.
| Property | PFC behaviour |
|---|---|
| Scope | Directly connected Ethernet peers |
| Classification | Selected Ethernet priority values |
| Trigger | Configured buffer or congestion thresholds |
| Action | Request a temporary pause for the affected priority |
| Benefit | Can reduce buffer-overflow loss for configured traffic |
| Risk | Pause propagation, head-of-line blocking and possible deadlock |
Important engineering distinction: PFC is not an end-to-end congestion control algorithm. It applies backpressure between neighbouring Ethernet devices. Excessive PFC activity can propagate congestion through the fabric and reduce performance for otherwise healthy traffic.
4.4 — Explicit Congestion Notification
ECN provides a mechanism for network devices to signal congestion by marking ECN-capable IP packets rather than necessarily discarding them.
The IP header contains a two-bit ECN field. A congested switch can mark eligible traffic with the Congestion Experienced (CE) codepoint.
For a typical DCQCN-based RoCEv2 deployment, the receiving NIC reacts to congestion-marked packets by generating a Congestion Notification Packet (CNP) toward the sending endpoint.
4.5 — DCQCN: Data Center Quantized Congestion Notification
DCQCN is an end-to-end congestion control mechanism commonly associated with RoCEv2 deployments. It uses network congestion marking and feedback to influence sender transmission rates.
1. Congestion Detection
A switch marks eligible packets when congestion thresholds are reached.
2. Receiver Feedback
The receiving endpoint generates congestion feedback according to its implementation.
3. Rate Reduction
The sender reduces its transmission rate in response to feedback.
4. Recovery
The sender may increase its rate as conditions improve.
5. Stabilisation
Rate adaptation seeks to limit persistent queue growth and congestion pressure.
6. Monitoring
Engineers inspect CNP, ECN and throughput counters to validate behaviour.
Design principle: ECN and DCQCN attempt to control congestion before prolonged buffer pressure requires PFC. Actual effectiveness depends on hardware implementation, threshold selection, traffic patterns and endpoint rate-control parameters.
4.6 — Switch Buffer Engineering
Switch buffers temporarily store packets when the output interface cannot transmit them immediately. Buffer capacity must accommodate short bursts, congestion feedback delay and traffic scheduling behaviour.
Illustrative Queue Growth Calculation
This simplified calculation assumes a sustained rate imbalance and no packet drops, pause events or sender rate adaptation during the interval. Real buffer behaviour depends on the switch architecture, queue allocation, shared memory, packet sizes and scheduling.
Engineering implication: Even very short congestion events can consume significant buffer space at 400G and 800G link speeds. Buffer sizing and congestion feedback timing must therefore be considered together.
4.7 — Head-of-Line Blocking and PFC Propagation
Head-of-line blocking occurs when queued traffic prevents other packets from progressing, even when some downstream resources may otherwise be available.
With PFC, a paused priority can affect multiple flows sharing that priority on an upstream link. A congested destination can therefore cause backpressure that extends beyond the original bottleneck.
Local Congestion
A switch egress queue experiences high occupancy and requests a pause from its upstream peer.
Congestion Propagation
The upstream device accumulates traffic and may issue additional pause requests, potentially affecting unrelated flows mapped to the same priority.
Operational warning: PFC can protect traffic against certain buffer-overflow conditions, but excessive or persistent pause activity is a sign that the fabric may be experiencing serious congestion or configuration problems.
4.8 — PFC Deadlock and Congestion Collapse Risks
PFC deadlock can occur when a cyclic dependency develops between paused traffic priorities and forwarding resources.
In such a condition, devices may be waiting for one another to resume transmission, preventing forward progress until the condition is broken.
| Risk | Potential impact | Engineering response |
|---|---|---|
| PFC storm | High pause activity across multiple links | Inspect pause counters, congestion sources and QoS mapping |
| Head-of-line blocking | Unrelated flows delayed within a paused priority | Review traffic isolation and priority assignment |
| PFC deadlock | Persistent forwarding stall | Validate topology, deadlock detection and recovery features |
| Buffer exhaustion | Packet loss and transport retries | Review thresholds, capacity and traffic patterns |
| Incorrect ECN thresholds | Late marking or unnecessary rate reduction | Tune against platform guidance and measured workloads |
| DCQCN instability | Throughput oscillation or persistent congestion | Inspect endpoint rate-control configuration and CNP telemetry |
4.9 — QoS and Traffic Classification
RoCEv2 traffic must be mapped consistently to the intended QoS treatment throughout the fabric.
This may involve IP DSCP markings, Ethernet priority code points, switch traffic classes, queue scheduling and PFC priority configuration.
Production recommendation: Do not assume that a DSCP value automatically maps to the correct PFC priority. The mapping must be verified on each relevant switch and network adapter, including trust boundaries and remarking behaviour.
4.10 — Production Congestion Troubleshooting
Congestion troubleshooting should correlate switch queue telemetry, PFC pause counters, ECN markings, CNP generation, NIC transport counters and application-level performance.
| Observation | Likely investigation |
|---|---|
| High queue occupancy | Offered load, egress bottlenecks and buffer allocation |
| Frequent ECN marks | Persistent congestion and marking thresholds |
| High CNP activity | Receiver feedback and sender rate adaptation |
| Persistent PFC pauses | Congestion propagation and priority mapping |
| RDMA retries | Packet loss, transport recovery and physical errors |
| Low GPU utilisation | Collective communication stalls and network bottlenecks |
| Uneven switch utilisation | ECMP distribution and large-flow placement |
Change-control warning: Avoid disabling PFC or changing ECN/DCQCN thresholds blindly in a production RoCEv2 fabric. These changes can increase packet loss, transport retries or application failures. Validate proposed changes against vendor guidance and controlled workload testing.
Section 4 — Engineering Takeaway
High-performance RoCEv2 Ethernet fabrics require coordinated switch buffering, ECN marking, DCQCN sender rate adaptation, PFC configuration, QoS classification and traffic engineering. The objective is not simply to eliminate packet loss, but to maintain predictable throughput and latency without creating excessive backpressure, head-of-line blocking or fabric-wide congestion propagation.
AI Fabric Congestion Laboratory
Investigate how offered load, link capacity, switch buffer occupancy, ECN marking, PFC pauses and simplified DCQCN feedback interact. Advance the simulation, inspect queue growth and compare congestion-control strategies under different traffic conditions.
Congestion engineering configuration
Queue occupancy timeline
Congestion engineering inspector
AI Fabric Congestion
Queue occupancy increases when incoming traffic exceeds available egress capacity.
Engineering check: compare offered load, queue growth and congestion feedback thresholds.Congestion diagnostics console
Congestion engineering findings
InfiniBand Architecture Explained: HCAs, Subnet Managers, LIDs, Queue Pairs and GPU Fabric Engineering
InfiniBand is a high-performance networking architecture designed for low-latency, high-bandwidth communication between compute systems. It provides a native RDMA transport environment and is widely associated with high-performance computing and large-scale GPU infrastructure.
Unlike RoCEv2, which transports RDMA traffic across Ethernet and IP networks, InfiniBand defines its own fabric architecture, link-layer behaviour, addressing, management protocols and transport mechanisms.
Understanding InfiniBand requires examining not only its physical switches and host adapters, but also the subnet management system, forwarding tables, virtual lanes, credit-based flow control and RDMA transport resources.
5.1 — InfiniBand Fabric Architecture
An InfiniBand fabric connects compute nodes through Host Channel Adapters (HCAs), InfiniBand switches and managed forwarding paths.
A Subnet Manager discovers the fabric, assigns addresses and configures forwarding information within the InfiniBand subnet.
Architecture interpretation: The Subnet Manager is a logical fabric management role, not necessarily a dedicated physical appliance. InfiniBand fabrics can support redundant Subnet Managers with one active master for a subnet. The diagram shows a simplified two-tier topology; production deployments may use additional tiers and more complex routing policies.
5.2 — Core InfiniBand Components
Host Channel Adapter
Connects a compute host to the InfiniBand fabric and provides RDMA capabilities.
InfiniBand Switch
Forwards packets using configured fabric forwarding information.
Subnet Manager
Discovers fabric topology and configures subnet forwarding state.
Queue Pair
Provides send and receive work queues for RDMA operations.
Virtual Lane
Supports logical traffic separation and link-level flow-control resources.
Partitioning
Uses partition membership to control communication within the fabric.
5.3 — Subnet Manager and Fabric Discovery
The Subnet Manager plays a central role in InfiniBand fabric operation. It discovers nodes and switches, assigns local identifiers, configures forwarding tables and manages subnet-level configuration.
Actual initialization and recovery procedures depend on fabric topology, hardware support and Subnet Manager implementation.
5.4 — LIDs, GUIDs and InfiniBand Addressing
| Identifier | Purpose |
|---|---|
| GUID | Globally unique identifier associated with fabric components or ports |
| LID | Local Identifier used for forwarding within an InfiniBand subnet |
| GID | Global Identifier used for addressing in relevant InfiniBand contexts |
| QPN | Queue Pair Number identifying a transport endpoint |
| P_Key | Partition key used for fabric partition membership |
Forwarding distinction: Within an InfiniBand subnet, switch forwarding commonly uses destination LIDs and Subnet Manager programmed forwarding tables. This differs from conventional Ethernet MAC learning and IP routing behaviour.
5.5 — InfiniBand Packet Architecture
InfiniBand packets carry link-level and transport-level information required for forwarding and RDMA operations. The exact header sequence depends on the packet type and transport service.
The Local Routing Header supports forwarding within the InfiniBand subnet. The Base Transport Header carries information such as the operation code, destination queue pair and packet sequence number.
5.6 — Virtual Lanes and Credit-Based Flow Control
InfiniBand uses link-level, credit-based flow control. A transmitting port tracks available receive buffer credits for the relevant virtual lane and must respect those credits when sending data.
Virtual Lanes
Virtual lanes provide logical traffic separation with associated buffering and flow-control resources. They can support differentiated traffic handling within the fabric.
Credits
Credits represent available receive buffer capacity. The sender must have sufficient credit before transmitting data on a credit-controlled link.
Engineering distinction: InfiniBand credit-based flow control is not the same mechanism as Ethernet Priority Flow Control. Both address link-level buffer management, but they use different protocol architectures and operational controls.
5.7 — InfiniBand Routing and Adaptive Path Selection
InfiniBand switches forward traffic according to routing information configured by the fabric management system.
Routing algorithms can be selected to suit the topology and workload. Some platforms also support adaptive routing, which can select among eligible paths based on network conditions.
| Routing consideration | Engineering impact |
|---|---|
| Topology awareness | Routing should match the physical fabric structure |
| Path diversity | Multiple available paths can improve resilience and distribution |
| Adaptive routing | May improve utilisation under changing traffic conditions |
| Ordering requirements | Transport and hardware constraints affect path selection |
| Failure recovery | Fabric management and hardware features influence recovery behaviour |
5.8 — InfiniBand Link Speed and Capacity Planning
InfiniBand link generations include HDR, NDR and XDR, with nominal aggregate link rates depending on the generation and lane configuration.
| Generation | Common nominal 4-lane rate | Design consideration |
|---|---|---|
| HDR | 200 Gbit/s | Port density, topology and existing platform compatibility |
| NDR | 400 Gbit/s | High-bandwidth GPU fabric connectivity |
| XDR | 800 Gbit/s | Hardware generation, optics, cabling and ecosystem support |
This calculation describes nominal interface capacity. Actual effective application throughput depends on protocol overhead, traffic distribution, collective operations and fabric congestion behaviour.
5.9 — InfiniBand Partitioning and Security Boundaries
InfiniBand partitioning uses partition keys to control which ports can communicate within a configured fabric partition.
Partitioning provides an important fabric-level access-control mechanism, but it should not be treated as a complete security architecture for untrusted workloads.
Security consideration: Production InfiniBand environments should also consider host security, workload isolation, management access, firmware integrity and physical fabric boundaries.
5.10 — InfiniBand Production Troubleshooting
| Symptom | Investigation area |
|---|---|
| Port not active | Physical connectivity, link negotiation and Subnet Manager state |
| Missing LID | Subnet discovery and management configuration |
| Unexpected routing behaviour | Switch forwarding tables and routing algorithm |
| Low throughput | Link rate, congestion, topology and adapter configuration |
| RDMA operation failure | Queue pair state, memory permissions and transport errors |
| Fabric instability | Link errors, Subnet Manager events and topology changes |
| Communication isolation | Partition membership and P_Key configuration |
These commands are commonly associated with Linux InfiniBand tooling, but availability and supported options vary by installed packages, drivers and platform.
Section 5 — Engineering Takeaway
InfiniBand provides a dedicated high-performance fabric architecture built around HCAs, subnet management, LID-based forwarding, RDMA queue pairs, virtual lanes, credit-based flow control and fabric-aware routing. Successful deployment requires coordinated engineering across the physical topology, fabric management, endpoint configuration, traffic behaviour and operational telemetry.
InfiniBand Fabric Architecture Explorer
Explore InfiniBand Host Channel Adapters, fabric switches, subnet management, local identifiers, forwarding tables, virtual lanes and path selection. Discover the fabric, trace packets and investigate the impact of a failed inter-switch link.
InfiniBand fabric configuration
InfiniBand engineering inspector
Subnet Management
The InfiniBand subnet manager discovers the fabric and configures subnet addressing and forwarding.
Engineering check: inspect LIDs, switch forwarding tables and path availability.Fabric diagnostics console
InfiniBand engineering findings
Ethernet vs RoCEv2 vs InfiniBand: Architecture, Performance, Scalability and AI Fabric Design Decisions
Selecting a network architecture for an AI GPU cluster requires evaluating more than raw link bandwidth. The chosen fabric must support the communication patterns of distributed AI workloads while meeting operational, reliability, compatibility and cost requirements.
Ethernet, RoCEv2 and InfiniBand are frequently discussed together, but they do not represent three equivalent networking layers. Ethernet provides a general-purpose networking foundation, RoCEv2 enables RDMA over UDP/IP and Ethernet, while InfiniBand provides a dedicated high-performance interconnect architecture.
6.1 — Three AI Networking Approaches
The practical comparison is between conventional Ethernet/IP communication, Ethernet with RoCEv2 RDMA, and InfiniBand RDMA fabrics.
Architecture distinction: RoCEv2 is not an alternative physical network to Ethernet. It is an RDMA transport that uses UDP/IP over Ethernet. InfiniBand provides its own link, management and transport architecture. Conventional Ethernet/IP traffic may also coexist with RoCEv2 traffic on appropriately engineered infrastructure.
6.2 — Core Technology Comparison
| Characteristic | Ethernet / IP | Ethernet + RoCEv2 | InfiniBand |
|---|---|---|---|
| Network foundation | Ethernet and IP | Ethernet and IP | InfiniBand fabric |
| RDMA support | Not inherent to conventional sockets | Yes, with compatible RDMA adapters | Native RDMA capabilities |
| Transport | Typically TCP or UDP | RDMA over UDP/IP | InfiniBand transport |
| Routing | IP routing and Ethernet switching | IP routing and Ethernet switching | Subnet-managed forwarding |
| Congestion management | Transport control, QoS and network mechanisms | ECN, DCQCN, PFC and other supported controls | Credit-based flow control and fabric congestion mechanisms |
| Operational tooling | Broad Ethernet/IP ecosystem | Ethernet/IP plus RDMA-specific tools | InfiniBand-specific fabric tooling |
| Typical consideration | General connectivity and application traffic | High-performance RDMA on Ethernet | Dedicated high-performance RDMA fabric |
6.3 — Latency and Throughput Engineering
Network performance must be evaluated using end-to-end workload measurements, not simply interface line rate or a single latency benchmark.
Transport Overhead
Software, adapter and protocol processing influence effective communication latency.
Fabric Latency
Switching, queueing and network hops contribute to end-to-end delay.
Tail Latency
Slow communication operations can delay collective synchronisation.
Aggregate Bandwidth
Available paths and topology determine usable cluster-wide capacity.
Congestion Behaviour
Rate adaptation, buffering and flow control affect sustained performance.
GPU Efficiency
Communication overhead affects useful accelerator execution time.
Performance warning: It is not technically accurate to claim that one fabric technology is always faster than another. Results depend on hardware generation, adapter configuration, topology, software stack, message size, congestion and workload communication patterns.
6.4 — Operational Complexity and Management
Ethernet and RoCEv2 Operations
Ethernet-based AI fabrics can reuse existing IP routing, network automation, telemetry and switching expertise. However, RoCEv2 adds specialised requirements for NIC configuration, QoS mapping, congestion control and RDMA troubleshooting.
InfiniBand Operations
InfiniBand requires expertise in subnet management, LID forwarding, fabric routing, HCAs, virtual lanes and InfiniBand-specific diagnostics. Its management architecture differs from conventional Ethernet/IP operations.
Neither approach is operationally simple by default. The better choice depends on existing engineering skills, automation maturity, hardware support and the expected scale of the deployment.
6.5 — Scalability and Fabric Expansion
Both Ethernet and InfiniBand can support large multi-switch fabrics. Scalability depends on switch radix, link capacity, topology, routing or forwarding algorithms, congestion management and physical infrastructure.
| Scaling factor | Engineering question |
|---|---|
| Switch radix | How many high-speed ports are available per switch? |
| Topology | Can additional nodes be added without excessive oversubscription? |
| Path diversity | Are there enough independent paths between compute groups? |
| Optics and cabling | Can the physical infrastructure support the required port speeds? |
| Management scale | Can configuration and monitoring handle the full fabric? |
| Failure domains | How many workloads are affected by a device or link failure? |
6.6 — Compatibility and Ecosystem Considerations
AI networking architecture must align with the GPU platform, network adapters, switches, drivers, firmware, operating systems, communication libraries and deployment frameworks.
GPU Platform
Validate accelerator and memory interconnect compatibility.
Network Adapter
Confirm supported link speeds, transport modes and RDMA features.
Switching Platform
Verify buffering, routing, congestion and telemetry capabilities.
Software Stack
Check drivers, firmware and communication library support.
Automation
Assess configuration management and deployment repeatability.
Observability
Confirm availability of fabric and endpoint performance counters.
6.7 — Total Cost of Ownership
Fabric selection should consider the full lifecycle cost rather than the purchase price of switches and network adapters alone.
A lower-cost network may be less economical if communication bottlenecks significantly reduce expensive GPU utilisation. Conversely, a premium fabric may provide limited additional value for workloads that are not network constrained.
6.8 — Workload-Based Technology Selection
| Workload scenario | Key requirements | Design consideration |
|---|---|---|
| General AI services | Reliable application connectivity and scalability | Conventional Ethernet/IP may be sufficient |
| Distributed GPU training | High bandwidth, low communication overhead and predictable congestion | Evaluate Ethernet/RoCEv2 and InfiniBand |
| Large collective workloads | Efficient all-reduce and all-to-all communication | Benchmark real collective traffic on candidate fabrics |
| Mixed enterprise infrastructure | Integration with existing networking operations | Ethernet ecosystem and operational compatibility may matter |
| Dedicated HPC environment | Specialised high-performance interconnect and fabric management | InfiniBand may be a strong candidate |
| Inference clusters | Latency, throughput and communication characteristics of serving architecture | Choose based on tensor parallelism and model-serving requirements |
6.9 — Production Engineering Decision Checklist
Architecture recommendation: Use a representative workload benchmark to compare candidate fabrics. Measure not only synthetic network throughput, but also distributed training step time, collective latency, GPU utilisation, failure behaviour and operational complexity.
Section 6 — Engineering Takeaway
The choice between conventional Ethernet/IP, Ethernet with RoCEv2 and InfiniBand should be driven by workload communication requirements, RDMA capabilities, congestion behaviour, topology scalability, ecosystem compatibility, operational maturity and total cost of ownership. No single network technology is universally optimal for every AI infrastructure deployment.
AI Network Technology Decision Lab
Compare Ethernet/TCP, Ethernet/RoCEv2 and InfiniBand for distributed AI workloads. Change deployment requirements and evaluate architectural suitability, operational complexity, ecosystem compatibility, RDMA requirements and infrastructure reuse.
AI infrastructure requirements
Weighted suitability comparison
Reference architecture
Architecture decision inspector
Technology evaluation
Configure the workload and infrastructure requirements to evaluate technology suitability.
Engineering check: validate RDMA requirements, software support and operational constraints.Decision diagnostics console
Engineering recommendation and trade-offs
Distributed GPU Communication Explained: NCCL, All-Reduce, All-Gather, Reduce-Scatter and Parallel AI Training
Large AI models are frequently trained across multiple GPUs and compute nodes. These distributed workloads depend on communication operations that exchange gradients, model parameters, activations and other intermediate data between accelerators.
The efficiency of this communication can significantly influence overall training performance. A fast GPU may remain idle while waiting for another participant to complete a collective operation.
Communication libraries such as NVIDIA Collective Communications Library (NCCL) provide optimised collective operations across supported GPU interconnects and network transports.
7.1 — Distributed GPU Communication Architecture
A distributed training job may span multiple GPU servers. Within a server, GPUs communicate through supported scale-up interconnects. Between servers, communication crosses a scale-out network fabric.
Architecture interpretation: The diagram represents a logical distributed training topology. Actual communication patterns depend on the collective algorithm, parallelism strategy, GPU topology and network transport. A collective does not necessarily send every participant's data to every other participant using a direct physical connection.
7.2 — Fundamental Collective Operations
All-Reduce
Combines values across participants and distributes the reduced result to all.
All-Gather
Collects data partitions from all participants and distributes the combined result.
Reduce-Scatter
Reduces distributed data and delivers a partition of the result to each participant.
Broadcast
Distributes data from one participant to all others.
All-to-All
Exchanges different data partitions between participants.
Point-to-Point
Transfers data between specific participants or pipeline stages.
7.3 — Ring All-Reduce Architecture
Ring all-reduce is a collective algorithm in which participants are arranged in a logical ring. Data is partitioned and exchanged through repeated communication steps.
A common ring all-reduce implementation uses a reduce-scatter phase followed by an all-gather phase.
Engineering distinction: The ring is a logical communication structure. Its participants may be connected through NVLink, NVSwitch, Ethernet/RoCEv2 or InfiniBand, depending on the deployment. The physical fabric does not need to form a literal ring topology.
7.4 — Ring All-Reduce Communication Volume
For a ring all-reduce with N participants and a total buffer size of S bytes per participant, the idealised communication volume per participant is:
This calculation describes the algorithmic communication volume, not the total physical network traffic across every switch link. Actual transfer time also depends on bandwidth, latency, protocol overhead, contention and communication overlap.
7.5 — NCCL Communication Architecture
NCCL provides collective communication operations for supported NVIDIA GPU environments. It can select communication algorithms and transport paths based on hardware topology, message size, software configuration and available network resources.
| Layer | Role |
|---|---|
| AI framework | Coordinates distributed training and collective calls |
| NCCL | Implements and schedules supported GPU communication operations |
| GPU interconnect | Provides local accelerator communication where supported |
| Network transport | Provides communication between compute nodes |
| Network fabric | Forwards traffic across Ethernet/RoCEv2 or InfiniBand infrastructure |
| Telemetry | Exposes communication timing, transport errors and fabric performance |
Important: NCCL does not always use a single collective algorithm. Ring, tree and other algorithmic approaches may be selected depending on the software version, hardware topology and workload characteristics.
7.6 — Data, Tensor and Pipeline Parallelism
| Parallelism | Communication pattern | Network consideration |
|---|---|---|
| Data parallelism | Gradient synchronisation between replicas | All-reduce or related collective communication |
| Tensor parallelism | Exchange intermediate tensor partitions | Frequent latency-sensitive communication |
| Pipeline parallelism | Transfer activations and gradients between stages | Point-to-point bandwidth and pipeline scheduling |
| Expert parallelism | Exchange tokens or activations among experts | Potentially intensive all-to-all communication |
Different parallelism strategies produce different network traffic patterns. A fabric designed for large gradient all-reduce operations may experience different congestion behaviour under all-to-all expert routing or frequent tensor-parallel communication.
7.7 — Communication Latency and Training Efficiency
Distributed training step time depends on compute execution, communication, synchronisation and any overlap between these activities.
The example illustrates why overlapping communication with computation can improve training efficiency. Actual overlap depends on framework scheduling, kernel execution, memory resources and communication dependencies.
7.8 — Collective Communication Performance Metrics
Collective Latency
Time required to complete a collective operation.
Algorithm Bandwidth
Useful data size divided by collective completion time.
Bus Bandwidth
A derived metric accounting for the collective communication pattern.
GPU Utilisation
Indicates accelerator activity but requires workload context.
Network Throughput
Measures traffic carried by links and adapters.
Tail Latency
Highlights slow operations that may delay synchronisation.
Benchmarking: NCCL performance tests can help measure collective communication behaviour. Results should be interpreted alongside network counters, GPU telemetry and representative application workloads.
7.9 — Production Collective Communication Troubleshooting
| Symptom | Investigation area |
|---|---|
| Slow all-reduce | Fabric congestion, algorithm selection and GPU topology |
| Collective timeout | Transport failures, process synchronisation and endpoint availability |
| Uneven GPU progress | Stragglers, workload imbalance and communication dependencies |
| Low bus bandwidth | NIC performance, routing imbalance and communication configuration |
| Intermittent stalls | RDMA retries, PFC pauses, ECN activity and link errors |
| Scaling efficiency decline | Communication overhead, oversubscription and synchronisation cost |
Engineering warning: A slow collective does not automatically indicate a network fault. Compute imbalance, GPU memory pressure, software synchronisation and workload scheduling can produce similar symptoms. Troubleshooting must correlate compute and network evidence.
Section 7 — Engineering Takeaway
Distributed GPU training depends on collective communication, parallelism strategy, GPU topology, network transport and fabric performance. Operations such as all-reduce, all-gather, reduce-scatter and all-to-all create different traffic patterns and communication requirements. Efficient AI network engineering therefore requires understanding both the application's communication algorithm and the physical network that carries its data.
Distributed GPU Collective Communication Visualiser
Investigate how GPU communication libraries coordinate collective operations across distributed accelerators. Compare ring and tree algorithms, explore All-Reduce, All-Gather, Reduce-Scatter and Broadcast, and estimate communication volume and idealised transfer time.
Collective communication configuration
Collective communication ready
Build the model, then advance through the communication stages.
Collective engineering inspector
Distributed GPU Communication
Collective operations coordinate data exchange across multiple GPU ranks.
Engineering check: compare message size, communication steps and network bandwidth.Collective diagnostics console
Communication engineering findings
AI Network Performance Engineering: Throughput, Latency, RDMA Counters, Congestion Telemetry and GPU Fabric Observability
High-performance AI networking requires continuous measurement of the relationship between network behaviour and GPU workload performance. Link bandwidth alone does not reveal whether a distributed training cluster is operating efficiently.
Engineers must correlate switch telemetry, network adapter counters, RDMA transport behaviour, collective communication performance and GPU utilisation.
The objective is to identify where communication time is being lost, determine whether the network is responsible and establish which infrastructure changes will produce measurable improvements.
8.1 — End-to-End AI Fabric Observability Architecture
A production AI fabric should expose telemetry from compute nodes, network adapters, switches, congestion-control mechanisms and application communication libraries.
Architecture interpretation: Observability should connect workload-level symptoms with the underlying network path. A training step slowdown may correlate with RDMA retries, PFC pauses, ECN marking, switch queue growth or GPU execution imbalance. Correlation does not automatically establish causation, so targeted validation remains necessary.
8.2 — The Six Core AI Fabric Performance Metrics
Throughput
Useful data transferred per unit of time.
Latency
Time required for a packet or operation to complete.
Tail Latency
High-percentile delay affecting slow communication operations.
Packet Loss
Dropped packets that may trigger transport recovery.
Congestion
Queue pressure, ECN marking, PFC activity and rate adaptation.
GPU Efficiency
Useful accelerator progress relative to compute and communication overhead.
8.3 — Throughput and Effective Bandwidth
Interface line rate represents the nominal transmission capacity of a link. Effective application throughput is lower because of protocol overhead, contention, scheduling, transport behaviour and workload limitations.
This calculation assumes the measurement represents a single relevant transfer path. Aggregate multi-link measurements must be interpreted according to the topology and number of active interfaces.
8.4 — Latency, Tail Latency and Queueing Delay
Average latency can conceal performance problems that affect only a small fraction of communication operations.
Tail latency metrics such as p95, p99 and p99.9 help identify slow operations that may delay distributed synchronisation.
| Metric | Interpretation |
|---|---|
| Average latency | Mean completion time across measured operations |
| p50 | Median observed latency |
| p95 | 95th percentile latency |
| p99 | 99th percentile latency |
| p99.9 | 99.9th percentile latency |
Engineering implication: Collective communication may be delayed by the slowest required participant. Consequently, a small number of unusually slow network operations can have a disproportionate effect on training step time.
8.5 — RDMA and NIC Performance Counters
RDMA-capable network adapters expose counters that can help diagnose transport errors, packet loss, retries, congestion feedback and hardware problems.
| Counter category | Engineering significance |
|---|---|
| Transmit / receive bytes | Measures network traffic volume |
| Packet errors | Indicates malformed or otherwise invalid traffic |
| Transport retries | May indicate loss, timeouts or transport recovery |
| Completion errors | Highlights failed RDMA work requests |
| CNP counters | Shows congestion notification activity where supported |
| ECN-related counters | Indicates congestion-marked traffic where exposed |
| Physical link errors | Supports diagnosis of cabling, optics or link faults |
Operational note: Counter names and semantics vary between network adapter vendors, drivers, firmware versions and transport implementations. Always confirm the exact meaning of a counter before using it for automated alerting.
8.6 — ECN, PFC and Congestion Correlation
Congestion telemetry should be analysed as a sequence of related events rather than as isolated counter values.
The precise ordering and timing depend on the hardware, traffic conditions and congestion control configuration. PFC is not guaranteed to occur after ECN in every deployment.
8.7 — GPU Utilisation and Network Bottlenecks
Low GPU utilisation can be caused by network delays, but it may also result from data loading, CPU bottlenecks, memory pressure, kernel scheduling or workload imbalance.
Network-Constrained Workload
GPU execution is delayed while waiting for remote data or collective communication to complete. Network counters may show congestion, transport retries or high communication latency.
Compute-Constrained Workload
The GPU spends most of its time executing compute kernels. Increasing network bandwidth may produce little improvement if communication is not the limiting factor.
Performance engineering: Measure training step time, collective completion time, GPU activity and network utilisation together. A single GPU utilisation percentage is insufficient to determine whether the fabric is the bottleneck.
8.8 — Fabric Telemetry Collection Architecture
Modern AI fabric monitoring can combine streaming telemetry, device counters, application logs, GPU metrics and event correlation.
| Telemetry source | Typical measurements |
|---|---|
| Ethernet switches | Port utilisation, queue occupancy, drops, ECN and PFC |
| InfiniBand switches | Port counters, link errors, congestion and fabric state |
| RDMA adapters | Transport errors, throughput and congestion feedback |
| GPU telemetry | Utilisation, memory activity, power and execution behaviour |
| Communication libraries | Collective timing, algorithm behaviour and communication errors |
| Workload orchestration | Job placement, node allocation and workload lifecycle events |
A useful monitoring system should support historical comparison, time-aligned events, per-job visibility and topology-aware correlation.
8.9 — Production Monitoring and Alert Design
Alerting thresholds should be derived from hardware capabilities, known-good workloads and measured operational baselines.
Alerting guidance: Avoid treating every ECN mark or PFC pause as an incident. Some congestion signals are expected under load. Alert on sustained, abnormal or workload-impacting patterns using validated thresholds.
8.10 — Performance Investigation Workflow
The most effective investigations combine application-level evidence with network telemetry and a repeatable test methodology.
Section 8 — Engineering Takeaway
AI network performance engineering requires end-to-end observability across GPUs, RDMA adapters, Ethernet or InfiniBand switches, congestion-control mechanisms and collective communication libraries. The most important measurements are those that explain how network behaviour affects real workload completion time, rather than isolated infrastructure metrics alone.
AI Fabric Performance Analyzer
Investigate production-inspired AI fabric telemetry. Correlate GPU utilisation, throughput, tail latency, ECN marking, PFC pauses and RDMA retry counters. Select devices, inspect network paths and identify the likely cause of distributed training slowdowns.
Performance investigation
GPU utilisation
Percent of observed compute activityNetwork throughput
Aggregate modeled throughput · Gb/sRDMA operation p99 latency
Illustrative tail latency · µsCongestion signals
ECN marks and PFC pause events per secondDevice telemetry inspector
Fabric Observability
Select a GPU host, leaf switch or spine switch to inspect its engineering role.
Compare endpoint telemetry with fabric-wide counters before identifying a bottleneck.Telemetry event console
Engineering diagnosis
Select the most likely explanation for the observed telemetry.
Network interface and fabric counters
Production engineering considerations
Production AI Fabric Troubleshooting: Congestion, RoCEv2 Failures, InfiniBand Incidents and GPU Communication Stalls
Troubleshooting a production AI network requires understanding the complete communication path between distributed GPU workloads. A training job may experience slow collective operations, intermittent timeouts, RDMA transport errors or unexpected performance degradation even when physical network links appear healthy.
These incidents can originate from multiple layers, including GPU software, RDMA adapters, network configuration, switch buffering, congestion control, routing, physical connectivity and workload scheduling.
Effective troubleshooting therefore requires a structured methodology that correlates application symptoms with endpoint and fabric evidence.
9.1 — Production AI Network Incident Architecture
The following architecture illustrates a distributed GPU workload experiencing communication degradation across a high-performance network fabric.
Investigation principle: The highlighted spine path is an illustrative suspect, not a confirmed root cause. A real incident requires validation using switch counters, RDMA transport telemetry, workload timing and path analysis before attributing the problem to a specific device.
9.2 — Six Major AI Fabric Failure Domains
Physical Infrastructure
Optics, cabling, link errors, port speed and hardware failures.
Network Forwarding
Routing imbalance, path failures, incorrect forwarding and MTU problems.
Congestion Control
ECN, DCQCN, PFC, buffer pressure and QoS misconfiguration.
RDMA Transport
Queue pair errors, timeouts, retries and memory access failures.
GPU Communication
NCCL collective stalls, topology problems and communication imbalance.
Workload and Software
Framework synchronisation, driver issues, resource contention and application configuration.
9.3 — Incident 1: RoCEv2 Congestion and RDMA Retries
A distributed training workload begins experiencing longer collective completion times. Network adapters report increased transport retry activity while switch telemetry shows elevated queue occupancy.
The investigation should establish whether congestion is causing packet loss and retries, or whether multiple symptoms share another underlying cause.
Operational caution: Do not immediately increase buffer thresholds or disable congestion controls. These changes may conceal the symptom while worsening fabric stability. Validate the traffic pattern, queue behaviour and rate-control response first.
9.4 — Incident 2: Incorrect QoS and PFC Configuration
RoCEv2 traffic may be classified incorrectly at the network adapter or switching layer. A mismatch between DSCP, PCP, traffic classes and PFC priorities can produce unexpected loss or pause behaviour.
| Evidence | Investigation |
|---|---|
| Unexpected packet drops | Verify the actual switch queue used by RoCEv2 traffic |
| No expected PFC activity | Check whether traffic is mapped to the intended priority |
| Excessive PFC pauses | Investigate congestion, pause thresholds and priority sharing |
| Inconsistent behaviour across switches | Compare QoS mappings and trust settings along the complete path |
| Transport retries under load | Correlate drops, congestion feedback and endpoint counters |
Engineering approach: Trace the actual classification of representative traffic from the sending adapter through each network hop. Do not assume that configured DSCP values automatically produce consistent queue treatment.
9.5 — Incident 3: ECMP Imbalance and Network Hotspots
An Ethernet leaf-spine fabric may have sufficient aggregate bandwidth but still experience congestion on individual links.
ECMP generally distributes flows according to a hashing mechanism. Large flows can collide on the same path, creating uneven utilisation even when alternative paths have available capacity.
Important distinction: ECMP does not guarantee equal byte distribution across all paths. Hash-based forwarding can create uneven utilisation, especially when traffic contains a small number of large flows.
9.6 — Incident 4: InfiniBand Fabric Failure
An InfiniBand incident may involve link state, Subnet Manager operation, LID assignment, forwarding tables, partition membership or transport errors.
| Symptom | Potential cause | Diagnostic direction |
|---|---|---|
| Port not active | Physical link or fabric initialization issue | Check port state, optics and link negotiation |
| Missing LID | Subnet management or discovery failure | Inspect Subnet Manager and addressing state |
| Unexpected forwarding | Routing configuration or fabric topology issue | Review switch forwarding tables |
| Communication denied | Partition membership mismatch | Validate P_Key configuration |
| Reduced throughput | Congestion, link degradation or path imbalance | Inspect port counters and fabric routes |
Command availability and supported options vary by installed InfiniBand software, drivers and hardware platform.
9.7 — Incident 5: NCCL Collective Communication Stalls
A distributed training job may appear to hang during a collective operation. The cause may be network-related, but collective timeouts can also result from software or workload problems.
Transport Failure
RDMA errors, connection failures or unreachable participants.
GPU Straggler
One participant reaches the collective later than the others.
Communication Mismatch
Participants execute incompatible collective sequences or shapes.
Resource Pressure
GPU memory, CPU scheduling or host resource contention.
Fabric Congestion
Excessive queueing, retries or flow-control pressure.
Software Configuration
Incorrect transport, interface or library configuration.
Diagnostic principle: Identify the first participant that stops making progress. Correlate its GPU execution, collective calls, network adapter state and fabric telemetry with the remaining participants.
9.8 — RDMA Transport and Memory Access Failures
RDMA operations can fail because of incorrect queue pair state, memory registration, access permissions, remote addressing or transport errors.
| Failure category | Investigation area |
|---|---|
| Queue pair state error | QP transitions and connection setup |
| Remote access error | Remote memory permissions, address and rkey |
| Local protection error | Local memory registration, lkey and access validity |
| Transport retry exhaustion | Packet loss, reachability and timeout behaviour |
| Completion failure | Work completion status and vendor-specific error details |
| MTU mismatch | Endpoint path MTU and network forwarding constraints |
Security consideration: Remote memory keys and registered memory regions must be managed carefully. Incorrect access permissions can cause operation failures or create unnecessary memory exposure.
9.9 — Structured Fault Isolation Methodology
Production investigations should progress from the observed workload symptom toward the underlying infrastructure, using evidence at each stage.
This layered approach helps avoid unnecessary configuration changes and reduces the risk of misdiagnosing application problems as network failures.
9.10 — Production Incident Investigation Workflow
Operational recommendation: Preserve telemetry before making changes. Where possible, compare the affected environment against a known-good baseline using the same workload, hardware topology and measurement methodology.
9.11 — Root Cause, Corrective Action and Prevention
| Incident finding | Possible corrective action | Prevention |
|---|---|---|
| Persistent egress congestion | Review traffic distribution and available capacity | Capacity planning and congestion telemetry |
| QoS mapping mismatch | Correct validated traffic classification | Automated configuration consistency checks |
| ECMP path imbalance | Review hashing, routing and flow distribution | Per-path utilisation monitoring |
| RDMA configuration failure | Correct QP or memory access configuration | Endpoint configuration validation |
| InfiniBand fabric management issue | Restore correct subnet management state | Management redundancy and monitoring |
| Physical link degradation | Repair or replace faulty components | Physical error trend monitoring |
| Collective software mismatch | Correct distributed workload configuration | Pre-deployment workload validation |
9.12 — Final AI Fabric Engineering Checklist
A mature AI fabric should be designed not only for high performance, but also for predictable failure behaviour, rapid fault isolation and repeatable operational recovery.
Section 9 — Final Engineering Takeaway
Production AI network troubleshooting requires a complete understanding of GPU communication, RDMA transport, Ethernet and InfiniBand forwarding, congestion control, physical infrastructure and application performance. The most effective engineering teams use time-correlated telemetry, structured fault isolation, known-good baselines and controlled validation to identify root causes and restore reliable GPU workload performance.
AI Network Incident Investigation Lab
Investigate a production-inspired AI training incident. Inspect GPU utilisation, RDMA transport counters, Ethernet fabric paths, congestion signals, QoS configuration and physical link diagnostics. Identify the root cause, apply the correct remediation and verify that distributed GPU communication recovers.
Incident investigation workspace
Evidence timeline
Engineering device inspector
AI Fabric Operations
Select a GPU host, leaf switch or spine switch to inspect its engineering role.
Use CLI commands to collect evidence before selecting a remediation.Troubleshooting CLI
Root-cause analysis and remediation
Collect evidence, select the most likely root cause and choose the appropriate corrective action.

- BGP Troubleshooting: Real-World Failures - November 18, 2026
- Kubernetes Security Architecture - November 18, 2026
- AI Networking Architecture: Ethernet, RoCEv2 and InfiniBand - November 18, 2026