
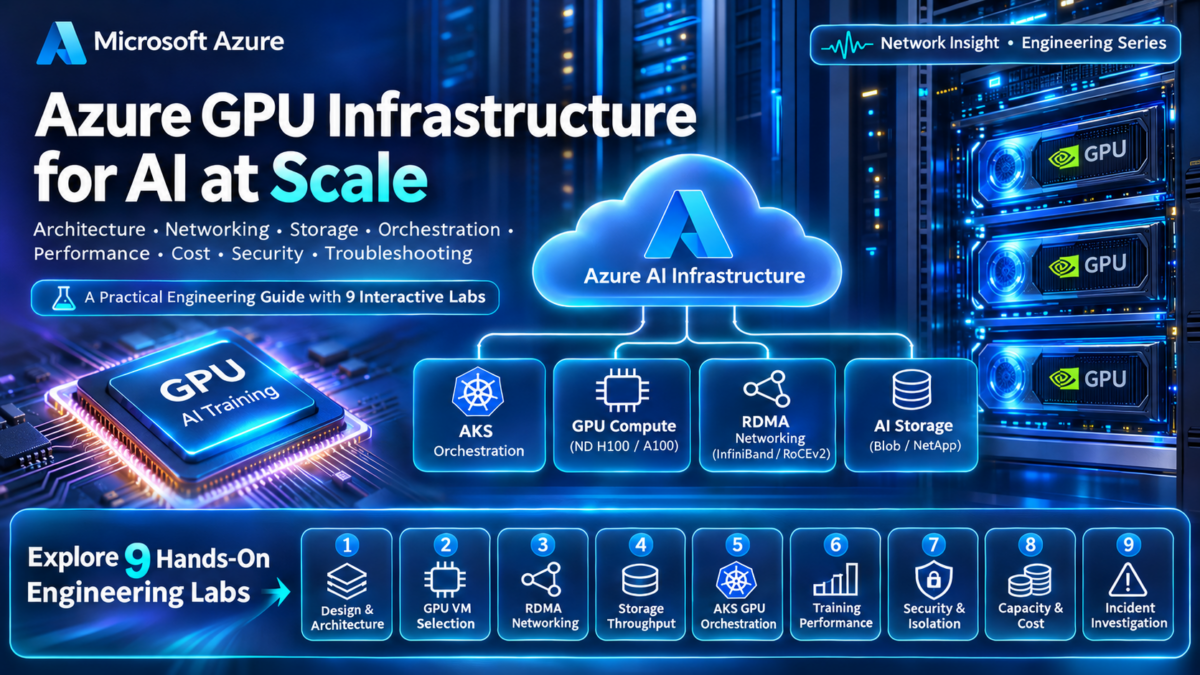
Azure GPU Infrastructure and AI Compute Explained
Modern artificial intelligence depends on more than powerful GPUs. Large-scale training and inference require carefully engineered compute platforms, high-bandwidth networking, scalable storage, workload orchestration, and reliable production operations.
Microsoft Azure provides GPU-enabled virtual machines and cloud infrastructure that support workloads ranging from model experimentation and fine-tuning to distributed training and large-scale inference.
However, building an efficient AI compute environment requires understanding how GPU accelerators, CPU resources, GPU memory, interconnects, storage throughput, and distributed software interact across the complete system.
AI Compute Is a Complete Infrastructure System
A GPU provides massively parallel processing capabilities suited to the matrix operations and numerical computations used by modern machine learning models.
Yet GPU performance depends on the wider infrastructure. Training data must reach the accelerators efficiently, model parameters and intermediate results must fit within available memory, and distributed GPU workers must exchange information across the network.
Poorly designed infrastructure can leave expensive GPUs waiting for data, network communication, storage operations, or synchronization between distributed workers.
GPU Compute
GPU architecture, accelerator memory, CPU-to-GPU communication, device topology, and workload execution.
Cluster Networking
RDMA, InfiniBand, Ethernet, GPU collective communication, and distributed workload performance.
AI Data Infrastructure
Dataset ingestion, shared storage, caching, checkpoints, and data-loading throughput.
Workload Orchestration
GPU scheduling, container deployment, distributed job management, scaling, and resource isolation.
From GPU Provisioning to Production AI Engineering
The challenge is not simply selecting the largest available GPU instance. Engineers must align accelerator capabilities, network communication, storage performance, workload parallelism, and operating cost with the requirements of the AI application.
Designing, Operating, and Troubleshooting Azure GPU Infrastructure
This guide follows the complete Azure GPU infrastructure lifecycle, beginning with architecture fundamentals and accelerator selection before moving into high-performance networking, distributed training, storage, Kubernetes orchestration, security, scaling, and incident investigation.
Throughout the guide, dedicated interactive engineering labs will allow readers to investigate GPU infrastructure decisions and understand how individual components influence overall AI workload performance.
Explore the core architectural layers of an Azure GPU environment and trace how AI workloads move between orchestration, compute, accelerator memory, networking, and storage.
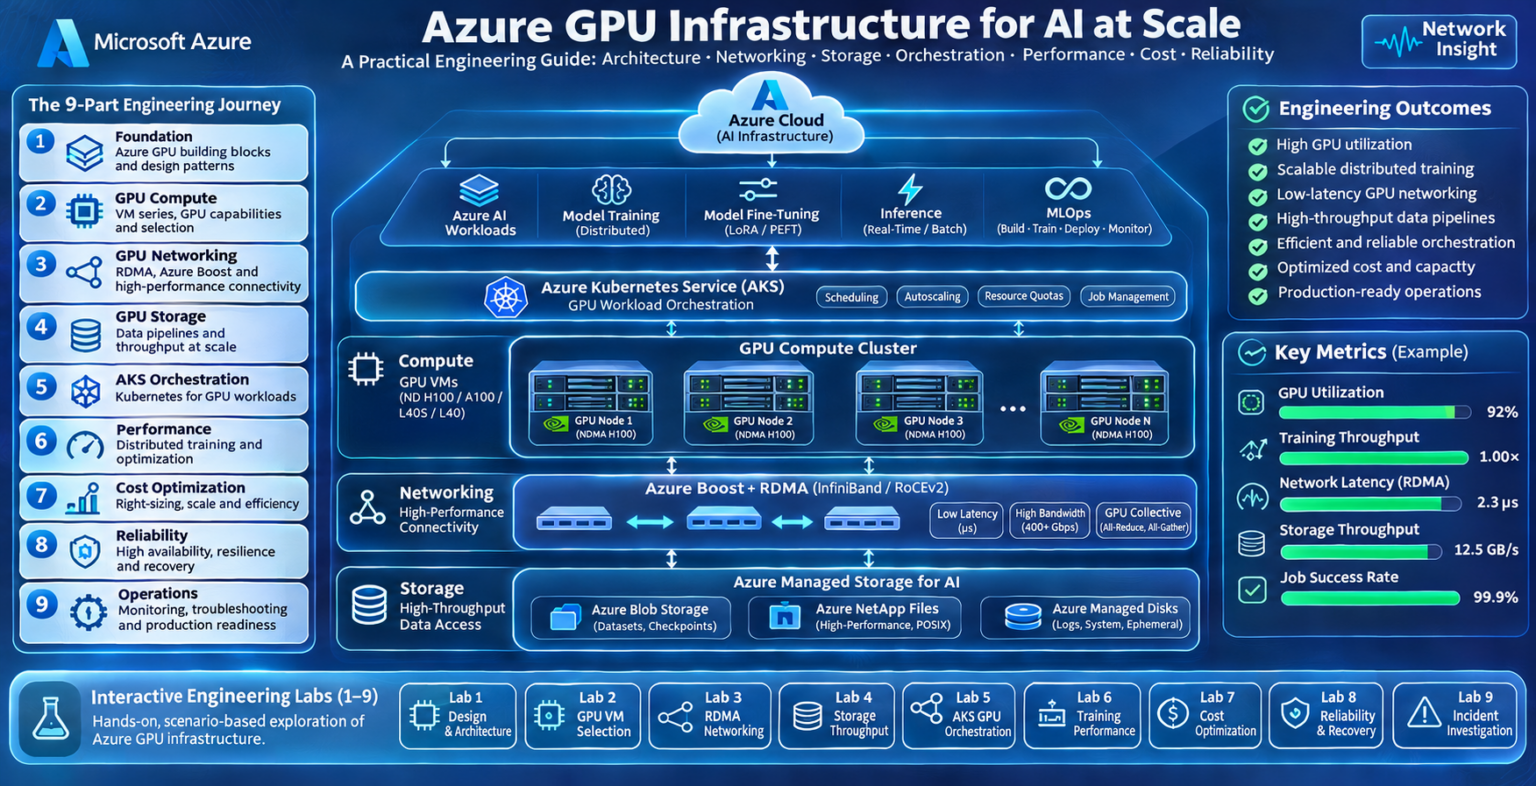
Explore Azure GPU Infrastructure
Nine interconnected engineering domains. Follow the journey from GPU architecture and high-performance networking to distributed training, security, optimization, and production troubleshooting.
COMPUTE Infrastructure Core
Azure GPU Infrastructure Architecture Fundamentals
Azure GPU infrastructure combines accelerator-enabled compute nodes, high-performance communication networks, scalable storage, workload orchestration, and cloud management services into a unified platform for AI workloads.
Understanding how these components interact is essential for designing efficient training, fine-tuning, and inference environments.
Understanding the Layers of an Azure GPU Environment
A GPU cluster is not simply a group of virtual machines with attached accelerators. It is a distributed compute system where processing, communication, storage, and orchestration must work together.
At the infrastructure level, Azure provides GPU-enabled virtual machines, networking, and storage. Higher-level services and software coordinate workload placement, execution, monitoring, and lifecycle management.
Compute Layer
GPU-enabled Azure virtual machines provide CPUs, system memory, accelerators, and local resources.
Communication Layer
High-performance interconnects support data exchange and synchronization between GPU workers.
Storage Layer
Shared storage, object storage, and caching supply training datasets and persist checkpoints.
Orchestration Layer
Scheduling and workload management coordinate resource allocation, deployment, and execution.
Inside an Azure GPU Cluster
The Internal Architecture of a GPU-Enabled Azure Virtual Machine
Each GPU-enabled Azure virtual machine contains multiple resource domains that influence workload performance.
The CPU prepares and coordinates work, system memory holds application state and host-side data, while GPU accelerators execute highly parallel computations using their own memory systems.
| Component | Primary Role | Engineering Consideration |
|---|---|---|
| CPU | Host-side processing, orchestration, data preparation | CPU bottlenecks can starve GPUs of work |
| System RAM | Host memory for datasets and application processes | Insufficient RAM increases paging or data-loading pressure |
| GPU Accelerator | Parallel tensor and numerical computation | Compute throughput depends on model and workload characteristics |
| GPU Memory | Stores tensors, model weights, activations, and intermediate data | Memory capacity can limit model size and batch configuration |
| CPU–GPU Interconnect | Transfers data between host and accelerator | Transfer overhead may limit effective utilization |
| GPU–GPU Interconnect | Supports communication between accelerators where available | Topology affects multi-GPU collective operations |
| Network Interface | Connects the node to storage, services, and other workers | Bandwidth, latency, and RDMA support vary by VM family |
GPU compute capability alone does not determine application performance. Accelerator memory, host processing, data transfer, and interconnect topology can become equally important constraints.
Separating Cluster Management from AI Workload Execution
A useful way to understand Azure GPU architecture is to separate management responsibilities from workload data movement.
Control Plane
Handles resource provisioning, job scheduling, deployment, configuration, identity, and lifecycle management. Azure Resource Manager and orchestration services participate at different management layers.
Data Plane
Executes AI workloads and moves tensors, datasets, model parameters, gradients, and inference data between compute, networking, and storage resources.
Azure management operations and high-performance GPU communication are different traffic categories. A dedicated RDMA-capable communication path, where supported, is not interchangeable with ordinary application networking or Azure management APIs.
Following an AI Training Job Through the Infrastructure
Consider a distributed training workload submitted to a GPU-enabled Azure environment.
The workload passes through several operational stages before producing a trained model or checkpoint.
During execution, the GPUs repeatedly process training batches. In distributed configurations, workers may exchange gradients or other tensors through collective communication operations.
The frequency and volume of communication depend on the selected training parallelism strategy and model architecture.
Why High-Performance Networking Matters for GPU Clusters
Multi-node training introduces communication overhead that does not exist in the same form for a single-GPU workload.
Distributed training frameworks may use collective operations such as all-reduce, all-gather, and reduce-scatter to coordinate computation across workers.
Intra-Node Communication
Communication between GPUs within a compute node may use PCIe, NVLink, or NVSwitch, depending on the hardware.
Inter-Node Communication
Communication between GPU nodes uses supported network interfaces and cluster fabrics, potentially including RDMA-enabled InfiniBand.
As a training job expands across more GPU nodes, communication efficiency becomes increasingly important. Poor collective communication performance can reduce the benefit of additional accelerators.
Connecting High-Performance Compute to AI Datasets
GPU clusters need storage architectures capable of supplying training data and persisting model artifacts.
Azure Blob Storage can provide durable object storage, while high-performance file systems and local caches can support demanding training access patterns.
| Storage Component | Typical Role | Potential Bottleneck |
|---|---|---|
| Azure Blob Storage | Datasets, model artifacts, long-term storage | Object access patterns, request throughput, transfer time |
| Azure Managed Lustre | High-performance parallel file access | File-system sizing, throughput, and workload behavior |
| Local NVMe or Cache | Temporary data staging and frequently accessed content | Capacity, cache misses, and data lifecycle |
| Checkpoint Storage | Training recovery and model state persistence | Large checkpoint write times and synchronization |
Choosing the Right Azure GPU Infrastructure Pattern
The correct architecture depends on workload characteristics, model size, GPU memory, distributed communication, storage requirements, and operational constraints.
Single-Node AI Compute
Suitable for experimentation, smaller training workloads, fine-tuning, and inference when model and memory requirements fit the selected node.
Multi-Node GPU Training
Supports larger distributed workloads but introduces communication, scheduling, fault tolerance, and storage coordination challenges.
GPU-Accelerated Inference
Optimizes model serving, request throughput, latency, memory allocation, and accelerator utilization.
Managed GPU Orchestration
Uses services such as Azure Machine Learning or AKS to coordinate deployment, scheduling, and operational management.
GPU VM availability, quotas, accelerator models, network capabilities, and regional capacity vary. Verify the requirements of the selected Azure VM family before finalizing a production design.
The Foundation of Reliable Azure GPU Infrastructure
Azure GPU architecture brings together compute resources, accelerator memory, high-performance communication, data storage, and workload orchestration.
The efficiency of the complete platform depends on how well these layers are aligned with the AI workload.
Designing Azure GPU infrastructure requires a systems-level understanding of accelerator compute, memory capacity, CPU-to-GPU communication, multi-node networking, storage throughput, and orchestration. GPU utilization and application performance are outcomes of the complete architecture, not simply the number of GPUs provisioned.
Azure GPU Infrastructure Architecture Explorer
Explore the complete Azure AI compute stack. Trace workloads through orchestration, GPU virtual machines, accelerator hardware, high-performance networking, storage and production operations.
Configure the Azure GPU Architecture
Azure GPU Infrastructure Reference Architecture
Follow the AI workload across the major infrastructure domains.
GPU Compute Cluster Visualization
Selected architecture shown as logical GPU compute nodes.
Selected Infrastructure Configuration
Architecture Execution Trace
Inspect the infrastructure dependencies encountered by the selected workload.
Engineering Assessment
Architecture Design Principle
Azure GPU Virtual Machines and Accelerator Architecture
Azure GPU-enabled virtual machines provide access to specialized accelerators for machine learning, distributed training, model inference, and GPU-intensive computation.
Selecting the correct VM requires understanding more than the GPU model. Accelerator memory, CPU resources, interconnect topology, network capabilities, and software compatibility all influence real workload performance.
What Makes an Azure GPU Virtual Machine Different?
A conventional virtual machine executes most application processing on CPUs. A GPU-enabled Azure VM exposes one or more accelerators to supported workloads, allowing highly parallel operations to execute on specialized GPU hardware.
GPUs are particularly effective for workloads that perform large numbers of matrix multiplications and tensor operations, which are common in deep learning.
Host Compute
CPUs coordinate application execution, data preparation, system processes, and communication with accelerators.
GPU Acceleration
NVIDIA GPU accelerators execute highly parallel compute kernels and tensor operations.
Accelerator Memory
Dedicated GPU memory stores model parameters, activations, gradients, and intermediate tensors.
High-Speed Connectivity
PCIe, supported GPU-to-GPU interconnects, and network interfaces move data between processing domains.
Inside a Multi-GPU Azure Compute Node
A multi-GPU compute node contains several interconnected hardware subsystems. The CPU communicates with GPU devices through supported host interconnects, while GPUs may communicate directly through dedicated accelerator links.
Two virtual machines with similar GPU counts can exhibit different multi-GPU performance when accelerator interconnects, host bandwidth, memory capacity, or network configurations differ.
Understanding Azure GPU Compute Categories
Azure offers GPU-enabled VM families optimized for different classes of workloads. Some focus on high-end AI training, while others are designed for inference, visualization, or general GPU acceleration.
| Azure VM Family | Representative GPU | Primary Workloads | Design Consideration |
|---|---|---|---|
| ND A100 v4 | NVIDIA A100 | Distributed training and large-scale AI compute | High-performance multi-GPU configurations and RDMA networking |
| ND H100 v5 | NVIDIA H100 | Large-model training and demanding AI workloads | Accelerator memory, GPU fabric, and cluster communication |
| NC A100 v4 | NVIDIA A100 | AI training, fine-tuning, and compute-intensive workloads | GPU count, available memory, and scaling requirements |
| NCas T4 v3 | NVIDIA T4 | Inference, smaller training jobs, and GPU acceleration | Cost, model size, and inference throughput |
| NV Series | Varies by generation | Visualization, graphics, and virtual workstations | Graphics-oriented capabilities versus AI training requirements |
GPU VM families differ by region, generation, quota, and availability. The examples above are representative, not a complete current Azure catalog. Verify the exact VM SKU, accelerator, GPU memory, networking features, and regional availability before deployment.
Understanding GPU Compute Resources
NVIDIA data-centre GPUs contain parallel processing resources designed to execute many operations concurrently. Modern AI accelerators also include specialized Tensor Cores for supported matrix operations.
Actual throughput depends on GPU architecture, numerical precision, model structure, memory bandwidth, kernel efficiency, and workload scheduling.
Streaming Multiprocessors
Execute groups of GPU threads and provide the underlying compute resources used by GPU kernels.
Tensor Cores
Accelerate supported matrix operations used by machine learning workloads.
GPU Memory Subsystem
Provides high-bandwidth access to model parameters, activations, and intermediate computation data.
Memory Hierarchy
Registers, caches, shared memory, and device memory influence data locality and execution efficiency.
Why GPU Memory Often Determines Workload Feasibility
GPU memory is one of the most important constraints when selecting infrastructure for large AI models.
Training requires memory not only for model parameters, but also for gradients, optimizer state, activations, temporary buffers, and communication workspaces.
| Memory Component | Purpose | Typical Impact |
|---|---|---|
| Model Weights | Stores learned model parameters | Scales with parameter count and precision |
| Activations | Stores intermediate values required by computation | Influenced by batch size, sequence length, and architecture |
| Gradients | Stores parameter derivatives during training | Additional memory required for backpropagation |
| Optimizer State | Maintains optimizer-specific training values | Can significantly increase training memory requirements |
| Runtime Buffers | Temporary tensors, kernels, and communication buffers | Varies by framework and execution configuration |
A model with 7 billion parameters stored at 16 bits per parameter requires approximately 14 GB of raw parameter storage (decimal units). This excludes activations, optimizer state, gradients, runtime overhead, and additional memory needed for training or inference.
PCIe, NVLink, and NVSwitch
Communication between CPUs and GPUs, and between GPUs themselves, can become a limiting factor for demanding workloads.
PCI Express
Provides a standard high-speed interconnect for host I/O and accelerator connectivity. Bandwidth depends on PCIe generation, lane allocation, and topology.
NVLink
Provides high-bandwidth GPU communication on supported NVIDIA accelerator platforms.
NVSwitch
Enables high-bandwidth communication among multiple GPUs in supported systems using an NVLink switching fabric.
Inter-Node RDMA
Supports efficient communication between compute nodes on RDMA-capable Azure configurations.
NVLink and NVSwitch are not universal features of Azure GPU VMs. Their availability depends on the accelerator platform and VM family. Similarly, RDMA support must be verified for the selected Azure SKU.
Matching GPU Infrastructure to AI Workload Requirements
GPU selection should begin with the requirements of the model and application, rather than the assumption that the most powerful accelerator is always the best choice.
Small inference workloads may benefit from lower-cost GPU configurations, while large-scale distributed training may require high-memory accelerators and specialized cluster networking.
What to Verify Before Deploying Azure GPU VMs
| Validation Area | Engineering Check | Why It Matters |
|---|---|---|
| GPU Hardware | GPU model, count, memory, and compute capabilities | Determines model compatibility and compute capacity |
| GPU Interconnect | PCIe, NVLink, NVSwitch, and actual topology | Influences multi-GPU communication performance |
| Networking | NIC capabilities, RDMA support, and cluster placement | Important for distributed training efficiency |
| Software | GPU drivers, CUDA, frameworks, and container compatibility | Prevents runtime and accelerator initialization failures |
| Capacity | Regional availability, quota, and deployment limits | Ensures the requested cluster can be provisioned |
| Operations | Monitoring, cost controls, patching, and recovery procedures | Supports reliable production operation |
On a properly configured NVIDIA GPU
Linux environment, nvidia-smi
can inspect visible GPUs, memory,
and driver status.
nvidia-smi topo -m
can help examine the reported
GPU and NIC topology.
The output must be interpreted
in the context of the VM
and driver configuration.
GPU VM Selection Is an Architecture Decision
Azure GPU virtual machines differ in accelerator hardware, GPU memory, host resources, interconnect capabilities, networking, and intended workload characteristics.
Understanding these differences allows engineers to choose infrastructure that balances model compatibility, computational performance, scalability, and cost.
The best Azure GPU VM is not necessarily the instance with the highest theoretical compute throughput. Successful selection requires evaluating GPU memory, accelerator topology, communication bandwidth, software compatibility, and workload-specific performance requirements.
GPU VM & Accelerator Architecture Workbench
Inspect accelerator hardware, GPU memory, CPU-to-GPU topology, interconnect capabilities and workload memory requirements. Determine whether an AI model fits the selected GPU architecture.
Configure the GPU Virtual Machine
GPU Virtual Machine Hardware Topology
Explore the relationship between CPU resources, GPU accelerators, high-bandwidth memory and interconnects.
GPU Memory Feasibility Analysis
Compare modeled memory requirements with available accelerator memory.
Engineering Assessment
Accelerator Architecture Trace
GPU Architecture Design Principle
GPU Networking: InfiniBand, RDMA, and Ethernet
Distributed AI training depends on fast, predictable communication between GPU workers. As models and training clusters grow, network performance becomes a critical part of overall accelerator efficiency.
Azure high-performance GPU configurations can provide specialized networking capabilities, including RDMA and InfiniBand, alongside conventional Ethernet connectivity for application and infrastructure traffic.
Why Distributed GPU Workloads Need High-Performance Networks
A single GPU can execute many operations without communicating with another machine. Distributed training introduces a different architecture: multiple accelerators work together on a shared computational task.
Depending on the parallelism strategy, GPUs must exchange gradients, parameters, activations, or other intermediate tensors.
If communication takes too long, accelerators may spend significant time waiting for synchronization rather than performing useful computation.
Bandwidth
Determines how quickly large tensor buffers can be transferred between distributed workers.
Latency
Influences the time required to initiate and complete communication, especially for smaller messages.
Congestion
Competing traffic, oversubscribed links, and queueing can reduce collective communication efficiency.
Synchronization
Slow workers or communication paths can delay progress across an entire distributed training job.
Reference Architecture: GPU Nodes and the Communication Fabric
A distributed Azure GPU environment contains multiple compute nodes connected through network infrastructure.
Supported high-performance VM configurations may expose specialized RDMA-capable network interfaces for communication-intensive training workloads.
Remote Direct Memory Access and GPU Cluster Performance
Remote Direct Memory Access, or RDMA, enables supported network interfaces to transfer data directly between registered memory regions with reduced involvement from the remote CPU in the data path.
This can reduce CPU overhead and improve communication efficiency for high-performance distributed applications.
Conventional Network I/O
Traditional socket-based communication involves operating-system networking processing and may require additional data movement. Exact overhead depends on the implementation.
RDMA Communication
RDMA-capable hardware supports efficient memory-to-memory transfers using registered memory and specialized network operations.
On supported NVIDIA hardware and software configurations, GPUDirect RDMA can allow compatible network devices to access GPU memory without staging every transfer through host system memory. This requires compatible hardware, drivers, and runtime configuration.
Understanding the Different Networking Technologies
InfiniBand and Ethernet are network technologies, while RDMA describes a family of remote-memory communication capabilities.
RDMA can operate over InfiniBand and, with appropriate technologies such as RoCE, over Ethernet. However, these are not interchangeable deployment configurations.
| Technology | Primary Role | Engineering Consideration |
|---|---|---|
| Ethernet / IP | General-purpose networking, application connectivity, and storage access | Throughput, latency, routing, and congestion behavior |
| InfiniBand | High-performance interconnect for supported HPC and AI systems | Fabric configuration, link health, topology, and supported hardware |
| RDMA | Efficient memory-oriented network communication | Registered memory, NIC support, transport, and software stack |
| RoCE | RDMA over Converged Ethernet | Ethernet fabric design, congestion management, and deployment support |
| GPUDirect RDMA | Supported network-device access to GPU memory | GPU/NIC compatibility, drivers, and memory registration |
| NCCL | GPU communication library supporting collective operations | Topology discovery, transport selection, and communication efficiency |
Do not assume that every Azure GPU VM provides InfiniBand, RDMA, RoCE, or GPUDirect RDMA. Supported capabilities depend on the VM family, hardware, image, drivers, and cluster deployment configuration.
How Distributed GPUs Exchange Training Data
Distributed training frameworks use collective communication operations to coordinate multiple GPU workers.
The communication pattern depends on whether the workload uses data, tensor, pipeline, or another form of parallelism.
All-Reduce
Combines values from multiple workers and distributes the reduced result to participating workers.
All-Gather
Collects distributed data fragments and makes the gathered result available to participating workers.
Reduce-Scatter
Reduces distributed values and distributes different portions of the result among workers.
Broadcast
Distributes data from one designated source worker to other participating workers.
Each worker computes gradients for its assigned training batch. A collective reduction can combine those gradients before model parameters are updated consistently across workers.
Tracing a Distributed GPU Collective Operation
Consider a collective operation spanning several Azure GPU compute nodes.
Depending on the selected collective algorithm, data may traverse several workers or communication stages before the operation completes.
The overall duration depends on message size, algorithm, number of participants, topology, bandwidth, and communication latency.
Understanding Communication Bottlenecks
GPU networking performance should be evaluated using application-level collective throughput and latency, not just theoretical NIC link speed.
| Performance Issue | Potential Cause | Observed Effect |
|---|---|---|
| Low Collective Bandwidth | Transport selection, network contention, or topology limitations | Longer gradient synchronization time |
| High Communication Latency | Small-message overhead, congestion, or software delays | Reduced efficiency for frequent synchronization |
| Uneven Worker Performance | Stragglers, compute imbalance, or inconsistent connectivity | Other workers wait for slower participants |
| Communication Timeout | Network faults, process failures, or stalled collective operations | Distributed training job may fail or hang |
| Unexpected TCP Fallback | Unavailable RDMA transport or configuration issues | Different CPU overhead and communication performance |
Low GPU utilization does not automatically indicate a GPU hardware problem. Data loading, CPU processing, communication waits, and synchronization delays can all reduce effective accelerator utilization.
Validating GPU Cluster Communication
Network investigation should begin by confirming the expected accelerator, network interface, driver, and communication configuration.
NVIDIA NCCL diagnostic logging can help identify transport initialization, topology discovery, and communication errors.
For controlled benchmarking, NCCL Tests can measure collective communication behavior across supported GPU configurations.
The presence of a network interface or GPU device does not by itself prove that the intended RDMA transport is active. Confirm the selected transport, device health, and measured collective performance.
Networking Is a Core Component of Distributed AI Compute
Distributed GPU infrastructure depends on efficient communication between accelerators, compute nodes, and training processes.
InfiniBand, RDMA, supported GPU memory transfer technologies, and collective communication libraries help enable high-performance multi-node AI workloads.
Adding more GPUs does not guarantee proportional training speedup. Effective scaling depends on communication topology, bandwidth, latency, collective algorithm efficiency, transport configuration, and the ability of distributed workers to remain synchronized.
GPU Collective Communication Simulator
Explore GPU-to-GPU communication across Azure AI compute clusters. Compare all-reduce strategies, RDMA-capable fabrics, Ethernet networking and the effects of congestion on distributed training synchronization.
Configure the Collective Communication Operation
Distributed GPU Collective Communication Topology
Workers exchange data through the selected network fabric. Animated paths illustrate communication phases.
Communication Performance Model
Collective Communication Trace
Network Bottleneck Assessment
Engineering Design Principle
Distributed AI Training on Azure
Distributed training enables multiple GPUs and compute nodes to cooperate on machine learning workloads that exceed the capacity or performance of a single accelerator.
Azure GPU infrastructure can support distributed training through accelerator-enabled virtual machines, high-performance networking, shared storage, and orchestration platforms such as Azure Machine Learning and AKS.
Why AI Training Expands Beyond a Single GPU
Large neural networks require substantial compute capacity and memory. As model parameter counts, training datasets, and sequence lengths increase, individual GPUs may no longer provide sufficient resources.
Distributed training addresses these limitations by spreading computation, model state, or data across multiple participating devices.
Compute Scaling
Additional accelerators can process more training work concurrently, subject to communication and synchronization overhead.
Memory Scaling
Model and optimizer state can be partitioned across devices using suitable distributed training strategies.
Dataset Throughput
Multiple workers can process separate portions of training data in parallel.
Training Duration
Efficient parallel execution can reduce time to train, although speedup is rarely perfectly linear.
Distributed GPU Training Across Azure Compute Nodes
A distributed training environment consists of a job scheduler, participating compute workers, training frameworks, a communication fabric, and persistent storage.
Training Model Replicas on Different Data Batches
Data parallelism distributes different portions of training data among workers. In conventional synchronous data-parallel training, each worker maintains a replica of the model.
Workers compute gradients using their assigned mini-batches. Gradient values are then combined, commonly through collective communication, before the optimizer update.
Conventional data parallelism does not automatically reduce the memory required to store a full model replica on each worker. Sharded approaches such as FSDP or ZeRO can distribute selected model, gradient, and optimizer states.
Distributing the Model Instead of Only the Data
When a model is too large for one accelerator, engineers can partition model computation across multiple GPUs.
Tensor Parallelism
Splits selected tensor operations or model layers across GPUs. Participating devices exchange partial results through collective communication. Fast GPU interconnects are particularly valuable.
Pipeline Parallelism
Assigns different groups of model layers to different stages. Micro-batches move through those stages, allowing overlapping execution when the pipeline is sufficiently full.
Tensor parallelism can introduce frequent communication within individual layers, while pipeline parallelism introduces stage-to-stage transfers and potential idle periods known as pipeline bubbles.
Large training systems may combine data, tensor, and pipeline parallelism, along with optimizer or parameter sharding, to balance memory capacity, computation, and communication.
Choosing a Distributed Training Strategy
| Strategy | Distribution Method | Communication Pattern | Primary Trade-Off |
|---|---|---|---|
| Data Parallelism | Different data batches, replicated model | Gradient synchronization | Replica memory and communication overhead |
| Tensor Parallelism | Partitions selected tensor computations | Frequent tensor exchanges and collectives | High interconnect demand |
| Pipeline Parallelism | Distributes model layers across stages | Activation and gradient transfers between stages | Pipeline bubbles and stage imbalance |
| FSDP / ZeRO | Shards selected model and training state | All-gather, reduce-scatter, or related operations | Memory savings versus communication and complexity |
| Hybrid Parallelism | Combines multiple strategies | Multiple communication patterns | Topology-aware placement and tuning complexity |
How Azure Infrastructure Supports Distributed Training Software
Azure provides infrastructure and orchestration services, while distributed training frameworks implement model execution, communication, and synchronization behavior.
| Technology | Role | Engineering Focus |
|---|---|---|
| Azure Machine Learning | Managed training jobs and compute orchestration | Job definitions, distributed configurations, environments |
| Azure Kubernetes Service | Container orchestration for GPU workloads | GPU scheduling, placement, resource management |
| PyTorch Distributed | Distributed training primitives and execution | Process groups, ranks, collectives, DDP, FSDP |
| DeepSpeed | Large-model training optimizations | Memory optimization, ZeRO, parallel execution |
| Megatron-LM | Large-scale transformer training techniques | Tensor, pipeline, and hybrid parallelism |
| NVIDIA NCCL | GPU collective communication | Topology, transport selection, collective performance |
Multi-node GPU training depends on compatible VM SKUs, sufficient regional capacity and quota, supported drivers, container images, network interfaces, and appropriate distributed training configuration. High-performance RDMA is not available on every Azure GPU VM.
Why Doubling GPU Count Does Not Always Double Performance
The benefit of adding more accelerators depends on how much work can be performed concurrently and how much overhead is introduced by communication, synchronization, scheduling, and data loading.
For a fixed workload, speedup = single-device execution time divided by multi-device execution time. Parallel efficiency = speedup divided by the number of devices. For example, an 8-GPU system delivering 6× speedup has 75% parallel efficiency.
Strong Scaling
The total workload remains approximately fixed while more accelerators are added. Communication overhead can become a larger fraction of execution time.
Weak Scaling
Workload size grows with the number of accelerators. Efficiency is assessed by how well execution time is maintained as the system expands.
Scaling experiments must also account for changes in global batch size, optimizer behavior, and training convergence. Higher samples-per-second does not necessarily mean a model reaches its target quality faster.
Operating Reliable Distributed GPU Training Jobs
Distributed training introduces failure modes that may not appear in single-node workloads. A failed worker, network timeout, storage bottleneck, or inconsistent software environment can interrupt the entire training job.
| Symptom | Possible Cause | Investigation |
|---|---|---|
| Training hangs during synchronization | Collective mismatch, failed rank, or communication problem | Inspect worker logs, rank participation, NCCL diagnostics |
| CUDA out-of-memory | Model state, activation growth, or batch configuration | Review memory allocation, precision, and sharding |
| Low GPU utilization | Data loading, CPU overhead, or synchronization waits | Profile data pipeline and compute/communication phases |
| Poor multi-node scaling | Communication overhead or workload imbalance | Benchmark collectives and compare worker step times |
| Repeated job restarts | Node failures, resource pressure, or orchestrator behavior | Inspect job events, node health, and restart policy |
| Slow checkpoint writes | Storage throughput, large state size, or concurrent writes | Measure checkpoint duration and storage performance |
For recoverability, engineers should establish checkpoint frequency, durable storage locations, model and optimizer state restoration, and validation of resumed training.
Checkpointing introduces a trade-off. Frequent checkpoints reduce the amount of computation lost after failure but increase storage I/O and operational overhead. The optimal interval depends on job duration, failure exposure, checkpoint size, and recovery objectives.
Distributed Training Is a Compute, Memory, and Communication Problem
Azure distributed AI training combines GPU compute nodes, orchestration, communication libraries, storage, and training frameworks.
Effective architecture requires selecting parallelism strategies that match model size, accelerator memory, available interconnects, and workload characteristics.
Distributed training performance depends on more than GPU count. Data parallelism, tensor parallelism, pipeline parallelism, state sharding, communication efficiency, storage throughput, and fault recovery must be engineered together to achieve reliable scaling on Azure.
Distributed Training Parallelism Lab
Investigate how data, tensor and pipeline parallelism distribute AI training workloads across GPU accelerators. Explore model placement, microbatch scheduling, pipeline bubbles and GPU utilization.
Configure Distributed Training
GPU Parallelism Placement Architecture
Each GPU is assigned a logical training responsibility based on the selected parallelism strategy.
Distributed Training Microbatch Timeline
Blue represents forward computation; violet represents backward computation; grey indicates an idle slot.
Parallelism Efficiency Analysis
Distributed Training Execution Trace
Engineering Assessment
Parallelism Design Principle
Azure AI Storage and Data Pipelines
High-performance GPU clusters require equally capable data infrastructure. Even powerful accelerators can remain underutilized when training data arrives too slowly or checkpoint operations interrupt computation.
Azure provides multiple storage technologies that can be combined to build scalable AI data pipelines, including Azure Blob Storage, Azure Managed Lustre, and VM-local storage where supported.
Why Storage Performance Matters for AI Compute
AI training workloads repeatedly load datasets, decode samples, prepare batches, transfer data into accelerator memory, and persist training state.
If the data pipeline cannot supply batches at the rate the GPUs consume them, accelerator utilization may decline even when sufficient GPU compute capacity is available.
Dataset Throughput
Storage and data-loading systems must provide enough sustained throughput to support training.
Metadata Operations
Large numbers of small files can create significant file-opening and metadata overhead.
Data Locality
Caching frequently accessed content closer to compute can reduce repeated remote reads.
Checkpoint Persistence
Large model and optimizer checkpoints require reliable write throughput and recovery procedures.
Tracing Training Data from Azure Storage to GPU Memory
A typical Azure AI training pipeline uses durable storage for datasets and model artifacts, while higher-performance storage or caches may stage data closer to the GPU workers.
Choosing Storage for Different AI Workload Patterns
| Storage Technology | Primary Role | Strength | Design Consideration |
|---|---|---|---|
| Azure Blob Storage | Durable datasets and model artifacts | Scalable object storage | Request patterns, throughput, latency, and access costs |
| Azure Managed Lustre | High-performance parallel file system | Shared file access for demanding HPC and AI workloads | Capacity sizing, throughput, data import/export, and cost |
| Local NVMe Storage | Temporary dataset staging and cache | Low-latency local access where available | Ephemeral lifecycle, capacity, and cache reconstruction |
| Azure Files | Managed shared file storage | File-sharing semantics for compatible workloads | Performance tier, protocol, and workload suitability |
| Azure Managed Disks | Persistent VM-attached block storage | Managed block volumes | Disk throughput, IOPS, and VM limits |
Storage services differ in access protocol, performance characteristics, persistence, and operational behavior. The fastest local cache is not necessarily the appropriate location for durable training checkpoints or irreplaceable datasets.
Building a Reliable AI Training Data Pipeline
Before a GPU processes a training sample, the data must be retrieved, decoded, transformed, and assembled into a batch.
Training frameworks commonly use data-loader workers to perform CPU-side operations concurrently with GPU execution.
Prefetching, asynchronous host-to-device transfers, and suitable data formats can help reduce idle time between training steps.
Understanding DataLoader Performance
In PyTorch, the DataLoader component coordinates dataset iteration, batching, and optional multiprocessing.
Data-loading performance depends on storage throughput, CPU processing capacity, file formats, preprocessing cost, and worker configuration.
Worker Processes
Additional loader workers may improve throughput for CPU-bound preprocessing, but excessive workers can create contention.
Prefetching
Preparing future batches in advance can overlap data loading with GPU computation.
Pinned Memory
Page-locked host memory can support efficient host-to-device transfers in compatible configurations.
Dataset Sharding
Distributing dataset partitions among workers helps avoid unintended duplicate processing in distributed training.
Increasing the number of data-loader workers does not guarantee better throughput. Measure CPU utilization, storage wait time, batch preparation latency, and GPU idle periods before changing worker counts.
Calculating the Data Rate Required by a GPU Cluster
Engineers can estimate the minimum sustained input throughput needed to feed a training workload.
Suppose a training cluster processes 8,000 samples per second and each stored sample averages 256 KB in decimal units. The raw input rate is approximately 2.048 GB/s. Actual storage requirements depend on caching, compression, preprocessing, read amplification, and concurrency.
| Metric | Example | Engineering Meaning |
|---|---|---|
| Samples per Second | 8,000 | Training consumption rate across the cluster |
| Average Stored Sample Size | 256 KB | Approximate bytes retrieved per sample |
| Raw Input Rate | 2.048 GB/s | Estimated aggregate data demand |
| Cache Hit Ratio | Workload-dependent | Influences how much data must be fetched remotely |
| Effective Storage Throughput | Measured | Determines whether the pipeline can sustain demand |
This simplified calculation estimates raw dataset bandwidth, not total end-to-end system performance. Real pipelines may be limited by metadata operations, decoding, CPU processing, or transfer overhead before reaching storage bandwidth limits.
Persisting Large AI Training State
Distributed training jobs periodically save checkpoints so that computation can resume after interruptions.
A checkpoint may contain model parameters, optimizer state, scheduler state, random number generator state, and other information required to restore training.
Checkpoint Size
Large models and optimizer states can create substantial storage write requirements.
Write Parallelism
Distributed checkpoint formats may allow multiple ranks to write different state partitions.
Durability
Checkpoints must be stored in a location that survives expected node or job failures.
Recovery Testing
Validate checkpoint integrity, compatibility, and successful restoration before relying on recovery.
A 1 TB checkpoint written at an effective aggregate rate of 10 GB/s would require approximately 100 seconds for raw data transfer alone. Serialization, synchronization, metadata, and storage overhead can increase elapsed checkpoint time.
Investigating GPU Data Pipeline Bottlenecks
| Symptom | Possible Cause | Engineering Investigation |
|---|---|---|
| GPU utilization repeatedly drops | Data-loader stalls or slow batch preparation | Measure batch wait time and GPU compute time |
| High storage read latency | Remote access, request patterns, or congestion | Inspect storage latency and request metrics |
| Slow first training epoch | Cold cache or dataset staging | Compare cold-cache and warm-cache performance |
| CPU utilization is saturated | Expensive decoding or transformations | Profile preprocessing and data-loader workers |
| Checkpoint operations stall training | Large synchronous writes or storage contention | Measure checkpoint duration and aggregate throughput |
| Distributed workers show uneven step times | Data skew, storage locality, or inconsistent loading | Compare per-worker batch times and dataset partitions |
These commands provide initial host-level visibility. Storage service metrics, training framework profiling, and application timing are also required to isolate the actual bottleneck.
Do not assume that low GPU utilization is caused by slow storage. A similar symptom can result from CPU preprocessing, synchronization waits, small batch sizes, or application inefficiency. Measure each pipeline stage before making infrastructure changes.
High-Performance GPU Compute Requires High-Performance Data Delivery
Azure AI storage architecture must align with the throughput, latency, access pattern, and durability requirements of the training workload.
Combining durable object storage, suitable high-performance file systems, local caching, efficient data loaders, and reliable checkpointing can help reduce idle GPU time and improve operational resilience.
GPU infrastructure performance depends on the complete data path: storage, networking, CPU preprocessing, host memory, accelerator transfers, and checkpoint operations. Efficient AI storage design focuses on sustained data delivery and recovery reliability, not simply selecting the storage service with the highest advertised throughput.
GPU Data Loading & Storage Bottleneck Lab
Investigate how Azure storage throughput, dataset caching, CPU data-loader concurrency and preprocessing affect GPU utilization. Identify why powerful accelerators can remain idle while waiting for training data.
Configure the AI Data Pipeline
Azure GPU Training Data Pipeline
Follow dataset reads from storage through cache, preprocessing and GPU execution.
GPU Data Pipeline Performance
Data Pipeline Execution Trace
Storage Bottleneck Assessment
Engineering Design Principle
Azure Kubernetes Service and GPU Orchestration
Azure Kubernetes Service provides a managed Kubernetes platform for deploying, scheduling, and operating containerized GPU workloads.
AKS can coordinate GPU-enabled node pools, container execution, resource requests, workload placement, and scaling policies while Kubernetes components manage the lifecycle of application pods.
Why GPU Clusters Need an Orchestration Platform
A GPU cluster may contain many compute nodes running training, inference, and data-processing workloads. Without orchestration, engineers must manually coordinate resource allocation, deployment, monitoring, and recovery.
Kubernetes introduces a declarative model in which applications describe resource requirements, and the scheduler attempts to place workloads on suitable nodes.
Resource Scheduling
Places workloads on nodes with sufficient advertised CPU, memory, and GPU resources.
Container Lifecycle
Manages pod creation, restart behavior, image execution, and workload lifecycle operations.
Cluster Scaling
Node autoscaling can add or remove compute capacity within configured constraints.
Operational Control
Supports namespaces, access policies, observability, configuration, and workload isolation.
How GPU Workloads Reach Azure Kubernetes Nodes
AKS separates Kubernetes control-plane functions from the worker nodes that execute application containers.
GPU-enabled node pools use compatible Azure VM SKUs, while supported NVIDIA drivers and device plugins make accelerator resources available to Kubernetes.
How Kubernetes Recognizes NVIDIA GPUs
Kubernetes does not automatically treat every accelerator as a schedulable resource. A compatible device plugin advertises available GPU devices to the kubelet.
For supported NVIDIA configurations, GPUs commonly appear as extended resources under the name nvidia.com/gpu.
The number of physical GPUs visible to the operating system may differ from the resources advertised to Kubernetes if devices are unhealthy, the device plugin is unavailable, or a supported partitioning configuration is in use.
How Kubernetes Places GPU Workloads
Kubernetes schedules pods according to declared resource requirements and scheduling constraints.
GPU workloads commonly specify an extended resource limit such as nvidia.com/gpu: 1. The scheduler considers available advertised GPU resources alongside CPU, memory, and placement rules.
This illustrative manifest requests one NVIDIA GPU for a container. It requires a compatible node, container image, driver, and GPU device plugin.
Standard Kubernetes GPU extended resources are integer-valued. Fractional GPU sharing, MIG partitions, or time-slicing require supported configurations and additional resource-management mechanisms.
Designing GPU Node Pools for Different AI Workloads
A production AKS cluster may use different node pools for CPU-based services, GPU training, and inference.
| Node Pool | Typical Workload | Placement Strategy | Design Concern |
|---|---|---|---|
| System Pool | Cluster system workloads | Dedicated system-oriented capacity | Protect essential cluster services |
| GPU Training Pool | Training and fine-tuning jobs | GPU node selectors, affinity, and taints | GPU availability and distributed placement |
| GPU Inference Pool | Model-serving containers | Workload-specific placement policies | Latency, utilization, and scaling behavior |
| CPU Data Pool | Preprocessing and data services | CPU and memory-based scheduling | Avoid unnecessary GPU resource consumption |
Node labels, taints, tolerations, affinity, and topology-spread constraints help control placement.
However, Kubernetes placement rules do not by themselves guarantee optimal physical GPU interconnect topology or high-performance network locality.
Sharing and Isolating Accelerators Between Workloads
GPU resource isolation depends on the hardware platform, device plugin, driver capabilities, and configured sharing mechanism.
Whole-GPU Allocation
A workload receives an allocated GPU device under the standard device plugin model.
Multi-Instance GPU
Supported NVIDIA GPUs can expose hardware partitions with defined compute and memory resources.
Time-Slicing
Compatible GPU sharing configurations allow multiple workloads to share execution time, without automatically providing strong memory isolation.
Workload Separation
Namespaces, admission controls, resource quotas, and node placement policies help manage multi-tenant deployments.
GPU time-slicing and MIG provide different resource sharing properties. Neither should be treated as a universal security boundary without reviewing the hardware, software, and threat model.
Scaling AKS GPU Infrastructure
AKS can use Kubernetes cluster autoscaling to adjust supported node pool capacity in response to unschedulable workloads and configured scaling policies.
GPU scaling differs from CPU-only scaling because accelerator instances may have higher provisioning costs, longer initialization requirements, and regional capacity constraints.
Scale-Out
Additional GPU nodes increase potential workload capacity when Azure capacity and quotas permit.
Scale-In
Unneeded nodes may be removed subject to workload disruption rules, scheduling, and autoscaler constraints.
A pending GPU pod does not guarantee that autoscaling will successfully add a node. Regional capacity, quota limits, node pool maximums, and incompatible scheduling constraints can prevent provisioning.
Investigating GPU Scheduling and Runtime Problems
| Symptom | Possible Cause | Investigation |
|---|---|---|
| GPU pod remains Pending | Insufficient allocatable GPUs or placement constraints | Inspect pod events and node capacity |
| GPU resource not advertised | Device plugin, driver, or node initialization issue | Inspect plugin pods and node allocatable resources |
| CUDA initialization failure | Driver, runtime, or image incompatibility | Inspect container logs and GPU driver status |
| Node autoscaling fails | Quota, regional capacity, or node pool configuration | Review autoscaler events and Azure provisioning failures |
| GPU utilization is low | Data-loading, application, or communication bottleneck | Profile workload and GPU metrics |
| Distributed job cannot communicate | Network policy, DNS, routing, or transport configuration | Inspect pod connectivity and distributed framework logs |
These commands provide initial visibility into Kubernetes scheduling and workload behavior. Azure node provisioning diagnostics, GPU driver information, and application logs may be needed for deeper investigation.
Distinguish scheduling failures from runtime failures. A Pending pod indicates that placement has not completed, while a running pod with GPU errors requires investigation of drivers, container runtime, device allocation, or application behavior.
AKS Connects GPU Infrastructure to Cloud-Native AI Operations
Azure Kubernetes Service provides a platform for orchestrating containerized AI workloads across GPU-enabled compute nodes.
Effective GPU orchestration requires compatible node hardware, correct driver and device plugin configuration, resource-aware scheduling, workload placement, and reliable monitoring.
Kubernetes manages workload placement and lifecycle, but GPU performance and isolation still depend on the underlying accelerator hardware, driver stack, device plugin, networking, and workload architecture. Production AKS GPU clusters must be engineered across both Kubernetes and Azure infrastructure layers.
AKS GPU Scheduling & Placement Lab
Investigate how Kubernetes schedules GPU workloads across Azure GPU node pools. Explore resource requests, GPU allocation, node affinity, taints, tolerations and pending workload diagnostics.
Configure the Kubernetes GPU Workload
AKS GPU Node Pool Architecture
Green slots are available GPUs. Blue slots are allocated. Red slots represent unavailable capacity.
GPU Workload Placement
Kubernetes Scheduler Event Trace
Scheduling Diagnostics
Engineering Design Principle
GPU Cluster Security and Isolation on Azure
Production GPU clusters process valuable model weights, proprietary datasets, training artifacts, and inference requests. Securing these systems requires controls across identity, networking, compute, containers, storage, and operational access.
Azure GPU security is best approached through defence in depth, combining Microsoft Entra ID, Azure RBAC, private networking, managed identities, encryption, workload isolation, and continuous monitoring.
Understanding the GPU Infrastructure Attack Surface
GPU infrastructure introduces security considerations beyond ordinary virtual machine deployments because multiple components participate in model execution and data movement.
The attack surface can include management APIs, container images, training datasets, model artifacts, storage credentials, cluster networks, GPU drivers, and shared compute nodes.
Identity and Privilege
Unauthorized identities or excessive permissions can expose cluster resources, model assets, and management operations.
Network Exposure
Unnecessary public endpoints, unrestricted egress, and weak segmentation can expand the attack surface.
Compute Isolation
Shared GPU nodes and container environments require careful tenant separation and supported isolation mechanisms.
Model and Data Protection
Training data, checkpoints, model weights, and secrets require access controls, encryption, and lifecycle management.
Security Boundaries Around an Azure GPU Cluster
A secure GPU environment should not rely on a single network rule or access control. Multiple independent protections reduce the impact of individual failures.
Microsoft Entra ID, Azure RBAC, and Managed Identities
Azure GPU environments commonly involve human administrators, automated deployment systems, training workloads, and model-serving applications.
Each identity should receive only the permissions required for its responsibilities.
| Control | Purpose | Engineering Consideration |
|---|---|---|
| Microsoft Entra ID | Authenticates users and supported workload identities | Identity governance, conditional access, and credential protection |
| Azure RBAC | Controls access to Azure resources | Least-privilege role assignments and scope |
| Kubernetes RBAC | Controls Kubernetes API permissions | Namespace and cluster-level authorization |
| Managed Identities | Provides Azure identities without application-managed secrets | Correct role assignments and token usage |
| AKS Workload Identity | Federates supported Kubernetes workloads with Microsoft Entra identities | Service account configuration and federated credentials |
| Privileged Identity Management | Supports controlled activation of privileged roles | Approval, auditability, and time-limited access |
Azure RBAC and Kubernetes RBAC protect different operations. Permission to manage an AKS resource in Azure does not automatically imply unrestricted Kubernetes API authorization. Cluster authentication and authorization settings determine the effective access model.
Tracing Secure Access to GPU Infrastructure
Consider an application running in AKS that must retrieve a training dataset from protected Azure Storage.
Identity authorization and network reachability are separate requirements. A workload can possess valid credentials but still fail because private DNS, routing, firewall rules, or network policy prevent connectivity.
Reducing Exposure Across Cluster and Storage Networks
Azure GPU environments frequently communicate with storage systems, container registries, orchestration APIs, monitoring services, and distributed workers.
Private networking helps reduce unnecessary exposure, but it must be combined with identity controls and workload-level segmentation.
Private Endpoints
Provide private IP connectivity to supported Azure services through Private Link.
Network Security Groups
Apply network traffic filtering at supported subnet or network interface boundaries.
Kubernetes Network Policies
Restrict selected pod ingress and egress communication when enforced by a supported networking implementation.
Controlled Egress
Limit outbound access to approved destinations, including required platform and workload dependencies.
GPU cluster communication may use specialized network interfaces and transports. Do not assume that conventional VNet security controls inspect or enforce policies on every RDMA or InfiniBand data path. Validate security boundaries for the actual VM family and network architecture.
Protecting Multi-Tenant Accelerator Workloads
GPU sharing creates additional resource isolation and trust considerations. A shared node may execute workloads from different applications or teams.
| Mechanism | Isolation Property | Important Limitation |
|---|---|---|
| Dedicated GPU Nodes | Separates workloads onto different compute nodes | Still depends on host, network, and management security |
| Kubernetes Namespaces | Logical organization and policy scope | Not a complete security boundary by themselves |
| Container Security Context | Restricts selected process privileges and capabilities | Depends on kernel and runtime enforcement |
| NVIDIA MIG | Hardware-based GPU resource partitioning on supported devices | Security guarantees depend on platform and threat model |
| GPU Time-Slicing | Shares execution time across workloads | Does not inherently provide strong memory isolation |
| Separate Clusters | Provides stronger administrative and workload separation | Higher infrastructure and operational overhead |
For workloads with materially different trust levels, dedicated node pools, separate clusters, or stronger infrastructure isolation may be more appropriate than relying only on GPU sharing features.
Securing the AI Assets Stored and Processed by GPU Clusters
AI infrastructure often handles sensitive intellectual property, including model weights, proprietary datasets, checkpoints, and application prompts.
Storage Access Control
Use scoped identity permissions and storage authorization policies to limit data access.
Encryption
Protect stored and transmitted data using supported encryption mechanisms and appropriate key management.
Secrets Management
Use Azure Key Vault and supported identity-based access rather than embedding credentials in application images.
Artifact Integrity
Validate container images, model artifacts, and checkpoint sources before executing or loading them.
Model files and training artifacts are not automatically safe because they originate from a familiar repository. Some serialization formats can execute code during loading. Use trusted sources, integrity checks, and safer loading mechanisms where supported.
Detecting Configuration Drift and Suspicious Activity
Production GPU security requires visibility across Azure control-plane activity, Kubernetes events, node health, identity access, and storage operations.
| Security Signal | Potential Concern | Investigation Focus |
|---|---|---|
| Unexpected role assignment | Privilege escalation or misconfiguration | Azure Activity Log and RBAC changes |
| Unusual storage access | Unauthorized dataset or model retrieval | Storage access logs and identity context |
| Privileged container deployment | Excessive host-level permissions | Pod security settings and admission events |
| Unexpected network egress | Data exfiltration or compromised workload | Network telemetry and approved destinations |
| Unknown container image | Untrusted software supply chain | Image provenance and registry access |
| Unexplained GPU activity | Unexpected compute workload | Process inventory, workload ownership, and node telemetry |
These commands provide initial operational visibility. A complete investigation may also require Microsoft Defender for Cloud, Azure Monitor, identity sign-in records, and storage or network diagnostic logs where configured.
GPU utilization metrics are not sufficient security telemetry. Correlate accelerator activity with Kubernetes workload identity, deployment changes, Azure resource activity, and data access records.
Securing GPU Infrastructure Requires Multiple Trust Boundaries
Azure GPU security spans identity, networking, operating systems, container runtimes, GPU devices, storage, and AI application assets.
Effective protection requires least-privilege access, carefully controlled network paths, compatible workload isolation, secure model handling, and continuous monitoring.
GPU cluster security is not achieved by a private subnet or Kubernetes namespace alone. Production architectures must combine identity controls, network segmentation, accelerator-aware isolation, data protection, software supply-chain security, and operational detection across the complete AI infrastructure stack.
GPU Infrastructure Trust Boundary Lab
Investigate identity, authorization, private networking and workload isolation across Azure GPU infrastructure. Trace security decisions and diagnose why an AI workload can—or cannot—access protected data.
Configure the Security Investigation
Azure GPU Infrastructure Trust Boundaries
Follow the access request through identity, authorization, network isolation and protected storage.
Security Policy Evaluation
Security Decision Trace
Security Engineering Assessment
Engineering Design Principle
GPU Performance, Scaling, and Cost Optimization on Azure
The objective of GPU infrastructure optimization is not simply to maximize accelerator count. It is to deliver useful AI computation efficiently while controlling infrastructure cost, training duration, and operational complexity.
Effective Azure GPU engineering combines workload profiling, accelerator utilization, distributed scaling analysis, storage and network tuning, and cost-aware capacity planning.
Understanding GPU Infrastructure Efficiency
GPU performance depends on how effectively an application uses accelerator compute, memory bandwidth, communication resources, and the surrounding infrastructure.
A powerful GPU can remain underutilized when CPU preprocessing, data loading, synchronization, or network communication limits the rate of useful work.
Compute Utilization
Measures how actively GPU execution resources are being used. High reported activity does not necessarily mean peak application efficiency.
Memory Efficiency
GPU memory capacity, allocation behavior, memory bandwidth, and data movement influence workload performance.
Communication Efficiency
Distributed workloads depend on fast collective communication, low synchronization overhead, and suitable interconnects.
Cost Efficiency
Infrastructure cost must be evaluated against completed training work, inference throughput, and application quality objectives.
Tracing the Performance Dependencies of a GPU Cluster
GPU performance is determined by a complete execution pipeline rather than a single accelerator specification.
Measuring Useful Accelerator Work
GPU utilization is an important operational signal, but it should not be interpreted as a complete measure of AI training efficiency.
| Metric | What It Indicates | Important Limitation |
|---|---|---|
| GPU Utilization | Reported GPU activity over a sampling interval | Does not directly measure useful FLOP efficiency |
| GPU Memory Usage | Allocated or occupied accelerator memory | High allocation does not imply efficient bandwidth use |
| GPU Memory Bandwidth | Rate of memory traffic | Must be interpreted relative to workload behavior |
| Training Throughput | Samples or tokens processed per second | Can change with batch size and workload configuration |
| Model FLOPs Utilization | Estimated achieved model computation relative to theoretical peak | Depends on counting conventions and hardware assumptions |
| Step Time | Elapsed duration of a training iteration | Requires breakdown into compute, communication, and input waits |
A GPU can report high utilization while running inefficient kernels or performing work that does not advance model training effectively. Use application-level throughput and profiling metrics alongside hardware utilization.
Measuring GPU Scaling Efficiency
Adding accelerators can increase throughput, but distributed training introduces communication, synchronization, and scheduling overhead.
Strong scaling evaluates how execution time changes as more GPUs process approximately the same total workload.
Speedup = single-GPU execution time divided by multi-GPU execution time. Parallel efficiency = speedup divided by GPU count. For example, a 16-GPU configuration delivering 12× speedup achieves 75% parallel efficiency.
Illustrative scaling values, not measured Azure benchmark results. Bar lengths are normalized to an ideal 16× speedup.
Compute-Bound Workloads
Additional GPUs can be effective when enough independent computation is available.
Communication-Bound Workloads
Scaling may flatten when synchronization and collective communication dominate execution time.
Understanding the Cost of AI Compute
GPU infrastructure cost is often evaluated using GPU-hours, VM-hours, training job cost, or cost per inference request.
Azure VM pricing is generally associated with the selected VM configuration and purchasing model, not simply an independent price assigned to each physical GPU.
Assume a GPU VM costs €20 per hour and a training job runs for 40 hours. The compute charge would be €800 before storage, networking, licensing, and other applicable costs. This is a hypothetical example, not an Azure price quotation.
| Cost Component | Primary Driver | Optimization Opportunity |
|---|---|---|
| GPU VM Compute | VM size, runtime, region, and purchasing model | Right-sizing and reducing idle capacity |
| Persistent Storage | Capacity, performance tier, and operations | Lifecycle policies and storage tier selection |
| High-Performance Storage | Provisioned capacity and service configuration | Match performance to active training demand |
| Data Transfer | Traffic direction, region, and service path | Data locality and avoiding unnecessary transfers |
| Operational Overhead | Provisioning, failed jobs, and recovery time | Automation and reliable checkpointing |
Balancing Cost, Availability, and Interruption Risk
Azure offers different compute purchasing options, although eligibility and availability vary by VM family, region, and subscription.
| Model | Typical Advantage | Primary Trade-Off |
|---|---|---|
| Pay-As-You-Go | Flexible usage without a long-term compute commitment | Price and capacity availability |
| Azure Spot VMs | Potentially lower compute cost | Eviction risk and capacity uncertainty |
| Azure Reservations | Potential discounts for eligible committed usage | Commitment and scope constraints |
| Capacity Reservations | Reserve eligible VM capacity in a region or zone | Capacity-related charges and supported SKU constraints |
A pricing reservation and a capacity reservation serve different purposes. A discounted billing commitment does not automatically guarantee GPU capacity. Verify current Azure eligibility, quotas, and capacity arrangements before designing production workloads.
Reducing the Cost of Useful AI Computation
Effective optimization should focus on cost per useful training result or inference output rather than GPU hourly price alone.
Right-Size Accelerators
Match GPU memory, compute capability, and interconnects to actual model requirements.
Optimize Precision
Supported mixed precision techniques can improve throughput and reduce memory pressure when numerically appropriate.
Improve Data Delivery
Remove storage, decoding, and data-loader bottlenecks before purchasing more accelerators.
Reduce Idle Runtime
Automate job completion handling, capacity shutdown, and cleanup of unused resources.
A cheaper VM is not necessarily more economical if training takes significantly longer. Compare complete job cost, model convergence, reliability, and operational overhead across candidate configurations.
Identifying Where GPU Capacity Is Being Wasted
| Symptom | Possible Cause | Engineering Investigation |
|---|---|---|
| Low GPU utilization | Data loading, CPU overhead, or synchronization waits | Profile execution phases and input pipeline |
| High GPU memory usage | Large model state, activations, or caching allocator behavior | Inspect memory allocation and workload configuration |
| Poor multi-node scaling | Communication overhead or worker imbalance | Measure collectives and per-rank step times |
| High compute cost per job | Idle capacity, inefficient kernels, or long runtime | Compare utilization, throughput, and billing |
| Slow training epochs | Dataset bottlenecks or insufficient compute efficiency | Profile storage, preprocessing, and GPU kernels |
| Repeated training failures | Capacity issues, OOM errors, or unstable distributed execution | Review failures, checkpoint recovery, and restart costs |
Hardware telemetry should be correlated with framework-level profiling, training throughput, and Azure billing data to identify meaningful optimization opportunities.
Optimize for Useful Work, Not Maximum GPU Count
Azure GPU performance and cost optimization requires a system-level understanding of accelerator compute, memory, networking, storage, orchestration, and workload behavior.
Engineers should measure throughput, scaling efficiency, training duration, and complete infrastructure cost before increasing cluster capacity.
The most cost-effective GPU architecture is not necessarily the one with the cheapest accelerator or the highest GPU utilization. It is the architecture that delivers the required AI workload performance, reliability, and model quality at the lowest practical total cost.
GPU Cluster Capacity & Cost Engineering Lab
Explore GPU cluster sizing, utilization, distributed scaling efficiency and AI training cost. Determine whether increasing accelerator capacity improves workload performance or simply increases expenditure.
Configure GPU Cluster Economics
GPU Cluster Capacity Visualization
Green represents the effective compute contribution. Red represents modeled unavailable or wasted capacity.
GPU Capacity Efficiency
Cluster Economics Trace
Engineering Assessment
Capacity Planning Principle
Production Azure GPU Cluster Troubleshooting
Production GPU failures can originate from compute hardware, drivers, accelerator memory, high-performance networking, storage, Kubernetes scheduling, or distributed training software.
Effective troubleshooting requires identifying the failing layer, collecting evidence, isolating the fault domain, and validating recovery without introducing additional operational risk.
Why GPU Cluster Incidents Are Difficult to Diagnose
Distributed GPU workloads depend on several infrastructure layers operating correctly at the same time. A failure in one worker can cause synchronization delays or terminate a distributed job.
Similar symptoms can originate from different causes. For example, a training job that appears frozen may be waiting for storage, a slow GPU worker, or a failed collective communication operation.
Compute Faults
GPU device errors, accelerator memory failures, node health, and hardware instability.
Software Faults
Driver incompatibilities, CUDA errors, container runtime problems, and application bugs.
Communication Faults
RDMA transport issues, NCCL timeouts, collective mismatches, and slow workers.
Platform Faults
AKS scheduling failures, unavailable Azure capacity, storage latency, and configuration errors.
Tracing a Distributed GPU Training Failure
Consider a distributed training job running across three GPU workers. Two workers remain healthy, while one experiences an application or communication failure.
The worker reporting a timeout is not necessarily the worker responsible for the original failure. Correlate timestamps, rank progress, and logs across all participants.
A Seven-Stage GPU Incident Investigation
A consistent troubleshooting process reduces the risk of changing unrelated infrastructure components before identifying the actual cause.
Preserve relevant logs and job state before restarting workers or modifying cluster configuration. Recovery actions can remove evidence needed for root-cause analysis.
Investigating Accelerator and Driver Failures
GPU device problems may appear as CUDA initialization errors, out-of-memory failures, missing devices, GPU resets, or hardware error reports.
| Symptom | Possible Cause | Investigation |
|---|---|---|
| GPU not detected | Driver initialization, device health, or VM configuration | Inspect NVIDIA driver status and node logs |
| CUDA out-of-memory | Model state, activation memory, or allocation pressure | Profile memory usage and application configuration |
| CUDA initialization error | Driver/runtime compatibility or device access | Check driver version, container runtime, and permissions |
| GPU Xid messages | Hardware, driver, or application-related GPU errors | Correlate Xid codes with NVIDIA diagnostics |
| Unexpected GPU throttling | Power, thermal, or platform limits | Inspect clocks, temperature, power, and throttling indicators |
CUDA application compatibility depends on the installed NVIDIA driver, container runtime, CUDA runtime requirements, and supported GPU architecture. A CUDA toolkit version displayed inside a container is not necessarily the host driver version.
Diagnosing Distributed GPU Communication Failures
Distributed training frameworks use communication libraries such as NCCL to exchange gradients, activations, and model state.
Depending on the Azure VM configuration, communication may use high-performance RDMA-capable networking, conventional Ethernet, or intra-node accelerator interconnects.
| Symptom | Potential Cause | Diagnostic Direction |
|---|---|---|
| NCCL collective timeout | Failed rank, collective mismatch, or transport failure | Correlate rank logs and collective progress |
| Low collective bandwidth | Transport selection, topology, or network contention | Benchmark collectives and inspect topology |
| RDMA interface unavailable | Unsupported SKU, driver issue, or interface configuration | Inspect device availability and platform support |
| Intermittent multi-node failures | Worker instability, network problems, or synchronization bugs | Compare failure timestamps across nodes |
| Unexpected transport fallback | RDMA not available or not selected | Review NCCL logs and transport configuration |
Compare a single-node GPU workload with a multi-node execution of the same workload. If the failure appears only during multi-node execution, investigate distributed synchronization, network configuration, rank placement, and transport selection. This narrows the investigation but does not by itself prove a network fault.
Investigating Kubernetes GPU Scheduling Problems
GPU workloads deployed on AKS may fail before execution because of resource scheduling constraints, missing GPU resources, or node provisioning problems.
| Symptom | Possible Cause | Investigation |
|---|---|---|
| Pod remains Pending | Insufficient GPU capacity, taints, or affinity constraints | Inspect scheduling events and allocatable resources |
| GPU resource missing | Device plugin or driver initialization issue | Inspect GPU plugin and node status |
| Container repeatedly restarts | Application crash, memory pressure, or initialization failure | Inspect previous container logs and termination reasons |
| Node provisioning fails | Quota, Azure capacity, or node pool configuration | Review Azure provisioning diagnostics |
| Distributed pods cannot communicate | DNS, network policy, routing, or application configuration | Test connectivity and review framework logs |
When GPU Failures Are Actually Data Delivery Problems
A training job may show low GPU utilization or slow progress because its data pipeline cannot provide batches quickly enough.
Potential causes include slow remote reads, metadata bottlenecks, insufficient CPU preprocessing capacity, cache misses, or checkpoint storage contention.
Storage Throughput
Measure sustained read and write performance relative to workload demand.
Data Loader Latency
Compare batch preparation time with GPU computation time.
Cache Behavior
Determine whether cold-cache reads or repeated dataset transfers affect throughput.
Checkpoint Duration
Measure checkpoint write time, synchronization overhead, and recovery reliability.
Do not increase GPU capacity before verifying that the existing accelerators are receiving enough useful work. Additional GPUs may worsen shared storage contention.
Applying a Fault-Domain Investigation Approach
Scenario A — Collective Timeout
A distributed job stalls after several successful iterations. Compare per-rank progress, GPU errors, and communication logs before concluding that the fabric failed.
Scenario B — GPU Pod Pending
An AKS training pod cannot start. Inspect advertised GPU resources, placement constraints, autoscaler events, quota, and Azure capacity.
Scenario C — Low GPU Throughput
GPU utilization repeatedly drops. Profile data loading, CPU preprocessing, synchronization, and GPU kernels to locate the bottleneck.
Scenario D — Checkpoint Failure
A long-running training job fails during checkpoint persistence. Investigate storage availability, write errors, capacity, and checkpoint consistency.
Record the observed symptom, affected components, relevant timestamps, supporting evidence, tested hypotheses, remediation, and post-recovery validation. Separate confirmed causes from plausible contributing factors.
Restoring GPU Cluster Health and Preventing Recurrence
Successful incident response does not end when a failed training job restarts. Engineers should confirm that the underlying problem has been resolved and that the workload is progressing correctly.
Recovery validation may include GPU health checks, distributed communication benchmarks, storage performance measurements, checkpoint restoration tests, and sustained application-level throughput monitoring.
| Recovery Check | Validation Objective |
|---|---|
| GPU Device Health | Devices initialize correctly and no relevant errors recur |
| Distributed Communication | Participating ranks complete collectives reliably |
| Training Progress | Iterations continue and expected training metrics advance |
| Storage Performance | Data delivery and checkpoint operations meet workload requirements |
| Orchestration Health | Pods, nodes, and scheduling behavior remain stable |
| Operational Monitoring | Alerts, logs, and metrics provide adequate future visibility |
Azure GPU cluster troubleshooting requires a layered approach. Compute, accelerator memory, CUDA, NVIDIA drivers, RDMA networking, NCCL collectives, storage pipelines, Kubernetes scheduling, and distributed training frameworks must be investigated as an interconnected system. Reliable recovery depends on evidence, controlled remediation, and measurable post-incident validation.
Azure GPU Cluster Incident Investigation
Diagnose production GPU infrastructure incidents using telemetry, command-line investigation, root-cause analysis and remediation. Restore the AI workload and verify healthy cluster operation.
Production Incident Selection
Production Azure GPU Cluster
Inspect the affected infrastructure component and follow the incident through the AI workload environment.
Incident Investigation Console
Enter a supported diagnostic command. Type help to view commands.
Incident Evidence & Root Cause
Engineering Assessment
Investigation Workflow
Production Troubleshooting Principle

- Azure Machine Learning Architecture Explained - November 15, 2026
- Azure GPU Infrastructure and AI Compute Explained - November 15, 2026
- Azure AI RAG Architecture Explained - November 15, 2026