

prometheus Monitoring

Prometheus Monitoring: The Pull Approach

Prometheus Monitoring: The Pull Approach

In modern monitoring and observability environments, Prometheus is widely used to collect, store, query, and alert on time-series metrics. One of its defining architectural characteristics is the pull-based collection model: rather than requiring every monitored application to continuously send metrics to a central monitoring service, the Prometheus server periodically connects to configured targets and scrapes their current metric values.

Prometheus was originally developed at SoundCloud and was designed around the operational requirements of dynamic, service-oriented environments. Its multi-dimensional data model identifies time series using metric names and labels, while PromQL provides a powerful language for filtering, aggregating, calculating rates, and analysing behaviour across infrastructure and applications. This combination makes Prometheus particularly effective for environments where services and workloads change frequently.

The pull model gives operators direct control over what is monitored, when it is scraped, and whether a target is currently reachable. A Prometheus server maintains a set of scrape targets through its configuration or service-discovery mechanisms and periodically requests metrics from each target’s HTTP endpoint. If a target becomes unavailable, that failure can itself become monitoring data, allowing operators to distinguish between an application reporting a problem and an endpoint that cannot be scraped at all.

The Prometheus Server forms the central component of this architecture. It discovers or receives its configured targets, performs metric scrapes, stores the resulting time-series data locally, evaluates recording and alerting rules, and provides PromQL query capabilities. The server therefore acts as both the collection engine and the primary query interface for the monitoring system.

Not every application exposes metrics in Prometheus’s native format. Exporters provide an integration layer for systems that need their existing statistics translated into Prometheus metrics. Node Exporter, for example, exposes operating-system and hardware-related metrics, while other exporters can provide visibility into databases, network services, storage platforms, or external systems. The exporter itself becomes a scrape target from the perspective of Prometheus.

Prometheus also separates metric evaluation from notification delivery through Alertmanager. Prometheus evaluates alerting rules and sends firing alerts to Alertmanager, which can then group related alerts, suppress duplicates, apply inhibition rules, and route notifications to appropriate receivers. This separation allows the monitoring engine to concentrate on detecting conditions while Alertmanager manages the operational notification workflow.

For visualisation, Prometheus integrates closely with Grafana. Grafana can query Prometheus using PromQL and transform the resulting time-series data into dashboards, graphs, tables, gauges, and other visual representations. This creates a practical observability workflow in which Prometheus provides collection, storage, querying, and alert evaluation while Grafana provides the visual interface used by engineers and operators.

The pull approach is therefore more than a mechanism for retrieving metrics. It forms part of Prometheus’s overall monitoring architecture, combining target discovery, periodic scraping, labelled time series, PromQL analysis, alert evaluation, and external visualisation. Understanding how these components interact provides the foundation for designing reliable Prometheus monitoring across dynamic infrastructure and distributed applications.

Prometheus Monitoring • Block 1

Pull vs Push Architecture

Prometheus asks targets for metrics on a controlled schedule. Compare that pull model with a traditional push architecture and see what happens when a monitored target becomes unavailable.

Collection direction
◉
Prometheus Server Controls when metrics are collected
→
HTTP scrape request
GET /metrics
▣
Application / Exporter Exposes metrics for Prometheus
Prometheus initiates the connection. It discovers a target, sends an HTTP request to its metrics endpoint, receives the samples, and records the result.

Prometheus scrape cycle

1
Discover target Configuration or service discovery identifies what should be scraped.
2
Open connection Prometheus connects to the target's reachable HTTP endpoint.
3
GET /metrics The scrape request asks the target for its current metric exposition.
4
Receive samples Prometheus parses the returned metrics and timestamps the samples.
5
Store and evaluate Samples enter the time-series database and become available to PromQL and alerting.

Failure visibility

Current target state
Target reachable
The last scrape completed successfully. Prometheus can record up = 1 for the target.
In Prometheus, up is a standard scrape-health metric: 1 means the last scrape succeeded; 0 means it failed.

Operational characteristics

Pull model

  • Monitoring system controls scrape timing.
  • Target discovery can be dynamic.
  • Failed scrapes provide explicit collection feedback.
  • Endpoint can be tested directly with tools such as curl.
  • Targets do not need to initiate unsolicited telemetry connections.

Push model

  • Targets or agents initiate telemetry delivery.
  • Collector address and delivery behaviour are target-side concerns.
  • Missing data may require heartbeat or timeout logic.
  • Useful for some event-driven or short-lived workloads.
  • Push systems can be appropriate when scraping is impractical.
Engineering takeaway Pull is more than a transport choice. It makes the monitoring system the active controller of collection, giving Prometheus predictable scrape timing, direct failure visibility, and a simple troubleshooting path from target → /metrics → stored time series.
Push is not inherently wrong. Prometheus also supports push-oriented patterns for specific use cases such as short-lived batch jobs through Pushgateway. It should not be treated as a general replacement for scraping long-running services.

Highlights: Prometheus Monitoring

Created by SoundCloud

In this post, I would like to discuss Prometheus monitoring and its pull-based approach ( Prometheus Pull ) to the metric collection and the Prometheus metric types. Prometheus is a powerful open-source monitoring system created by SoundCloud to monitor and alert the infrastructure and applications within their environment. It has since become one of the most popular monitoring systems due to its ability to monitor various services, from simple applications to complex distributed systems.

Pull-based System:

– Prometheus is designed to be simple to use. It uses a pull-based system, meaning it collects data from the services it monitors rather than having the services push the data to Prometheus. This makes it easy to set up and configure, allowing for great flexibility in the services it can monitor. It also has an intuitive user interface, making it easy to use and navigate.

– Understanding Prometheus’s architecture is crucial for effectively deploying and leveraging its capabilities. At its core, Prometheus consists of a server responsible for data collection, a time-series database for storing metrics, and a user interface for visualization and querying. The server scrapes metrics from various targets using exporters or service discovery, while the time-series database facilitates efficient storage and retrieval of collected data.

– Prometheus Monitoring integrates with many systems, making it highly versatile in diverse environments. It provides exporters with popular technologies like Kubernetes, Docker, and AWS, allowing an accessible collection of relevant metrics. Moreover, Prometheus can be integrated with other monitoring tools, such as Grafana, to create comprehensive dashboards and visualizations.

Key Features of Prometheus Monitoring:

1. Time-Series Database: Prometheus utilizes its own time-series database, tailored explicitly for efficiently storing and querying time-series data. This allows for real-time monitoring and analysis, enabling quick troubleshooting and performance optimization.

2. Flexible Query Language: PromQL, Prometheus’s query language, offers a powerful and expressive way to retrieve and manipulate metrics data. It supports various operations, including filtering, aggregation, and mathematical calculations, empowering users to extract meaningful insights from their monitoring data.

3. Alerting and Alert Manager: Prometheus has a built-in alerting mechanism that allows users to define alert rules based on specific conditions. Prometheus can trigger alerts when the Alert Manager component meets, manages, and routers such situations.

Prometheus Monitoring — The Pull‑Based Approach Explained

Prometheus is built around a pull‑based monitoring model, where the Prometheus server actively scrapes metrics from targets at regular intervals. This design is one of the core reasons Prometheus is reliable, scalable, and predictable in cloud‑native environments. Instead of agents pushing data into a central system, Prometheus controls the entire data‑collection lifecycle.

Why Prometheus Uses a Pull Model

Prometheus intentionally uses a pull approach because it provides:

  • full control over when and how metrics are collected
  • consistent sampling intervals for accurate time‑series analysis
  • simple failure detection (if a target doesn’t respond, it’s down)
  • secure, predictable data flow (no inbound connections required)
  • easy debugging (you can curl the metrics endpoint directly)
  • clean separation between metrics generation and metrics collection

The pull model is foundational to Prometheus’s reliability.

How the Pull Model Works

Prometheus performs the following steps:

  1. Reads the scrape configuration from prometheus.yml
  2. Discovers targets (static, Kubernetes, Consul, EC2, etc.)
  3. Sends HTTP GET requests to each target’s /metrics endpoint
  4. Receives plain‑text metrics in Prometheus exposition format
  5. Stores the metrics in its time‑series database (TSDB)
  6. Applies retention, compression, and indexing
  7. Exposes the data to PromQL queries, dashboards, and alerts

Every scrape is a controlled, predictable sampling event.

The `/metrics` Endpoint — The Heart of Prometheus Pull

Targets expose metrics via an HTTP endpoint, usually: 

This endpoint returns:

  • counters
  • gauges
  • histograms
  • summaries

All in Prometheus’s text‑based exposition format.

You can test it manually: curl http://localhost:9100/metrics

Service Discovery — Dynamic Pull in Cloud‑Native Environments

Prometheus integrates with multiple service‑discovery systems:

  • Kubernetes API
  • Consul
  • EC2
  • Azure
  • GCP
  • Docker Swarm
  • Static configs

In Kubernetes, Prometheus automatically discovers:

  • pods
  • services
  • endpoints
  • nodes

This makes the pull model ideal for dynamic, ephemeral workloads.

Security Benefits of Pull‑Based Monitoring

The pull model improves security because:

  • targets do not need to open inbound ports
  • Prometheus initiates all connections
  • firewall rules are simple (outbound only)
  • no agents push unverified data into the system
  • TLS and authentication can be applied per scrape

This reduces the attack surface significantly.

Advantages of Pull vs Push

Pull Advantages

  • predictable scrape intervals
  • easy debugging
  • simple failure detection
  • no agents required
  • consistent time‑series sampling
  • secure outbound‑only model

Push Advantages (rare cases)

  • high‑frequency events
  • short‑lived batch jobs
  • IoT devices with no HTTP stack

Prometheus supports push via the Pushgateway, but only for specific use cases.

Outcome — Reliable, Predictable, Cloud‑Native Monitoring

The pull approach ensures:

  • consistent time‑series data
  • simple debugging
  • secure data collection
  • scalable architecture
  • accurate alerting
  • deep integration with Kubernetes

Prometheus’s pull model is one of the reasons it became the de‑facto standard for cloud‑native monitoring.

**Challenge: The traditional approach** 

First, let us roll back in time before we had Prometheus network monitoring, say ten years, and look at the birth of monitoring and the tools used. The monitoring tools often operated in a silo, which led to more blind spots. 

The old approach to monitoring is considerably different from today’s approach to Observability.  Traditionally, you can use something like Ganglia to monitor. Ganglia was often used to monitor CDN networks involving several PoPs in different locations. However, within this CDN network, the PoPs look the same. The same servers, storage, etc., and only with the difference in the number of transit providers and servers.

Then, to alert people, we can use Icinga and have this on the back of the Ganglia. With this monitoring design, the infrastructure pushes metrics to the central collectors. The central collectors are in one location, maybe two for backup, but often two locations.

**Complexity and distributed systems**

However, you will see some issues as infrastructure grows ( infrastructure does grow at alarming rates ), and there is a need to push more metrics into Ganglia. For example, with some monitoring systems, the pushing style of the metric collection can cause scalability issues as the number of servers increases. Especially in more effective distributed systems observability use cases.

Within this CDN monitoring design, only one or two machines collect the telemetry for your infrastructures. So, as you scale your infrastructure and throw more data at the system, you have to scale up instead of out. This can be costly and will often hit bottlenecks.

**Scale with the Infrastructure**

However, you want a monitoring solution to scale your infrastructure growth. As you roll out new infrastructure to meet demands, you want to have monitoring systems that can scale. The monitoring system can scale as the infrastructure scales, such as in the use case with Prometheus network monitoring. However, with Ganglia and Icinga, we also have limited graphing functions.

Creating custom dashboards on unique metrics was difficult, and no alerting support existed. Also, there was no API to get and consume the metric data around that time. If you wanted to access the data and consume it in a different system or perform interesting analyses, all of it was locked into the Ganglia.


Prometheus Monitoring

Prometheus Monitoring • Block 2

Scrape & Service Discovery Lab

Prometheus does not need every target to be manually entered forever. Service discovery can dynamically identify targets, attach useful labels, and present Prometheus with scrape endpoints. Explore how a target moves from discovery to a queryable time series.

prometheus.yml

With static configuration, the scrape targets are explicitly defined in the Prometheus configuration.

Discovered target

node-exporter-01
UP

From discovery to time series

1
Configure Define scrape job
2
Discover Find targets
3
Label Build target labels
4
Endpoint Resolve /metrics
5
Scrape Collect samples
6
Store Write time series
7
Query PromQL / alerts
Step 1 — Configure: Prometheus reads the scrape job definition. This determines which discovery mechanism or static target list should be used and how the resulting targets will be scraped.

Target labels

Label Value Purpose
Example PromQL up{job="node"}
Engineering takeaway Service discovery separates where targets come from from how Prometheus scrapes them. Whether the target comes from a static file, Kubernetes, Consul, or a cloud API, the result is a set of scrape targets with labels that can become part of your monitoring model.
In real deployments, discovery metadata can also be transformed with relabeling before scraping. The exact discovery configuration depends on the Prometheus deployment and environment.

Understanding Prometheus’ Pull-Based System

Prometheus operates on a pull-based model, meaning it actively fetches metrics from the targets it monitors. Instead of waiting for the targets to push metrics to it, Prometheus takes the initiative and pulls the data at regular intervals. This approach offers several advantages over traditional push-based systems.

1. Flexibility and Reliability: One of the key benefits of the pull-based system is its flexibility. Prometheus can quickly adapt to dynamic environments and handle changes in the configuration of monitored targets. It can automatically discover new targets and adjust the scraping frequency based on the importance of metrics. This flexibility ensures that Prometheus can keep up with the ever-changing nature of modern infrastructure.

2. Efficiency and Scalability: The pull-based system also provides efficiency and scalability. By fetching metrics directly from the targets, Prometheus reduces the resource overhead on each target. This is particularly beneficial in scenarios where the number of targets is large, or the resources on the targets are limited. Additionally, Prometheus can distribute the scraping workload across multiple instances, enabling horizontal scalability and ensuring smooth operations even under heavy loads.

3. Data Integrity and Consistency: Another advantage of the pull-based system is its ability to ensure data integrity and consistency. Since Prometheus fetches metrics directly from the targets, potential data loss in a push-based system is eliminated. By actively pulling the data, Prometheus guarantees that the most up-to-date and accurate metrics are available for analysis and alerting.

4. Alerting and Monitoring: Prometheus’ pull-based system seamlessly integrates with its powerful alerting and monitoring capabilities. By regularly fetching metrics, Prometheus can evaluate them against predefined rules and trigger alerts when certain thresholds are exceeded. This proactive approach to monitoring ensures that any potential issues or anomalies are promptly detected, allowing for timely remedial actions.

Example: Prometheus is Google Cloud

In the following example, I have set up a  Google Kubernetes Engine cluster ad and then deployed the Managed Service for Prometheus to ingest metrics from a simple application. Remember that the Managed Service for Prometheus is Google Cloud’s fully managed storage and query service for Prometheus metrics. This service is built on Monarch, the same globally scalable data store as Cloud Monitoring.

Note: A thin fork of Prometheus replaces existing Prometheus deployments and sends data to the managed service with no user intervention. This data can then be queried using PromQL through the Prometheus Query API supported by the managed service and the existing Cloud Monitoring query mechanisms.
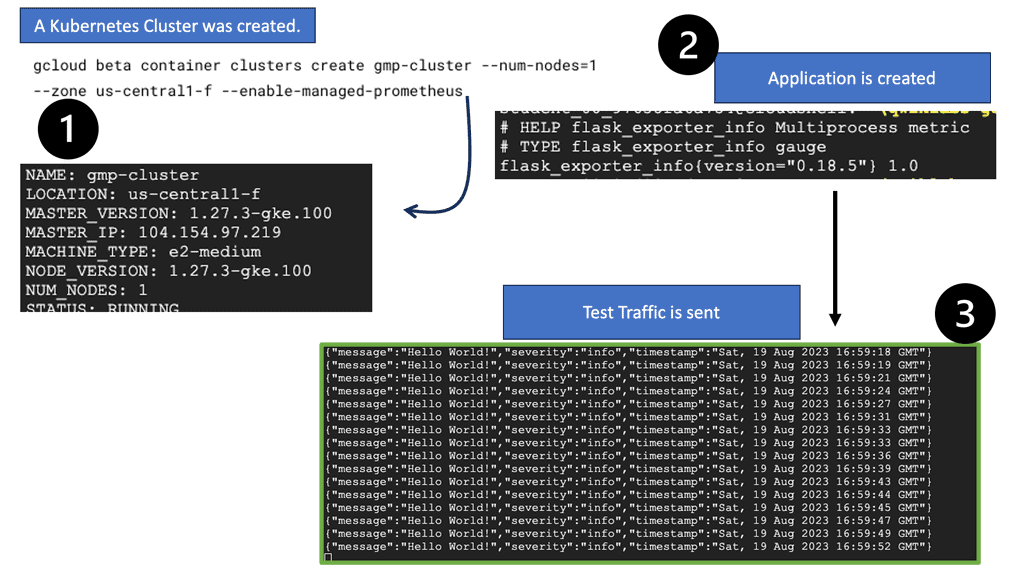
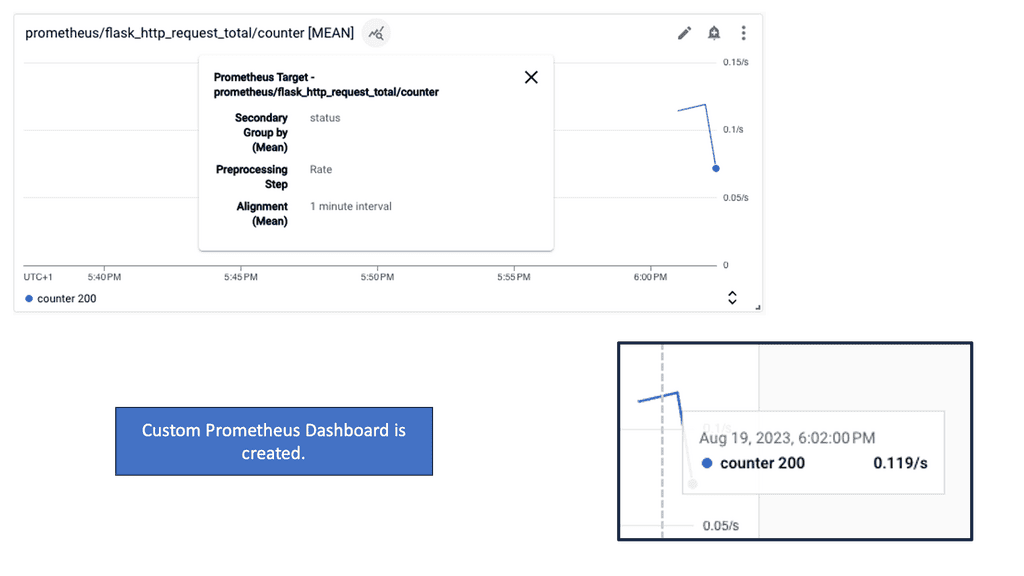
In this last section, quickly use gcloud to deploy a custom monitoring dashboard that shows the metrics from this application in a line chart. Once created, navigate to Monitoring > Dashboards to see the newly created
Prometheus Network Monitoring

Prometheus network monitoring is an open-source, metrics-based system. It includes a robust data model and a query language that lets you analyze how your applications and infrastructure are performing. It does not try to solve problems outside the metrics space and works solely in metric-based monitoring.

However, it can be augmented with tools and a platform for additional observability. For Prometheus to work, you need to instrument your code.

Available Client libraries

Client libraries are available in all the popular languages and runtimes for instrumenting your code, including Go, Java/JVM, C#/.Net, Python, Ruby, Node.js, Haskell, Erlang, and Rust. In addition, software like Kubernetes and Docker are already instrumented with Prometheus client libraries. So you say these are out of the box, so are you ready for Prometheus to scrap their metrics?

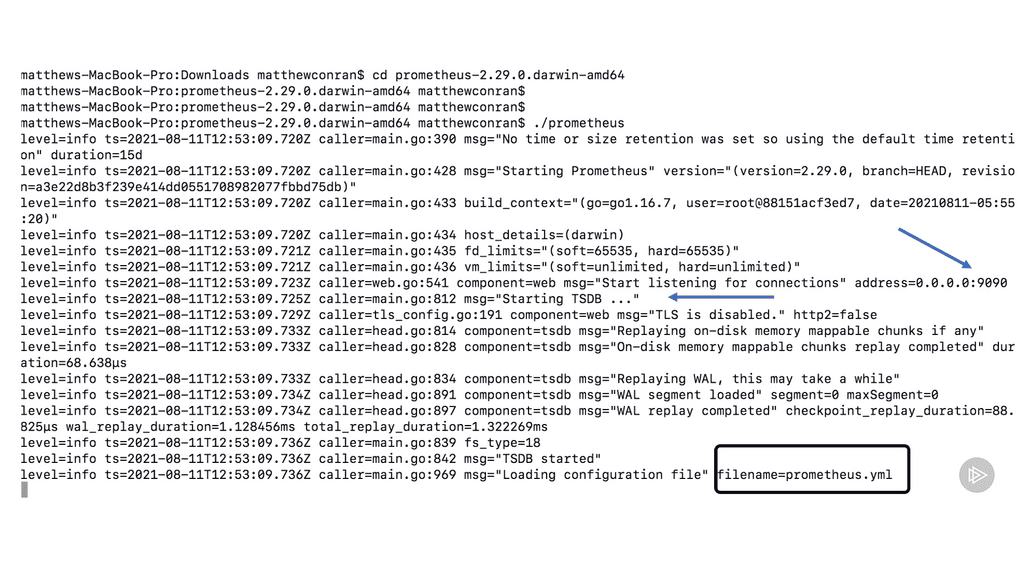
In the following diagram, you will see the Prometheus settings from a fresh install. I have downloaded Prometheus from the Prometheus website on my local machine. Prometheus, by default, listens on port 9090 and contains a highly optimized Time Series Database (TSDB), which you can see is started. Also displayed at the very end of the screenshot is the default name of the Prometheus configuration file.
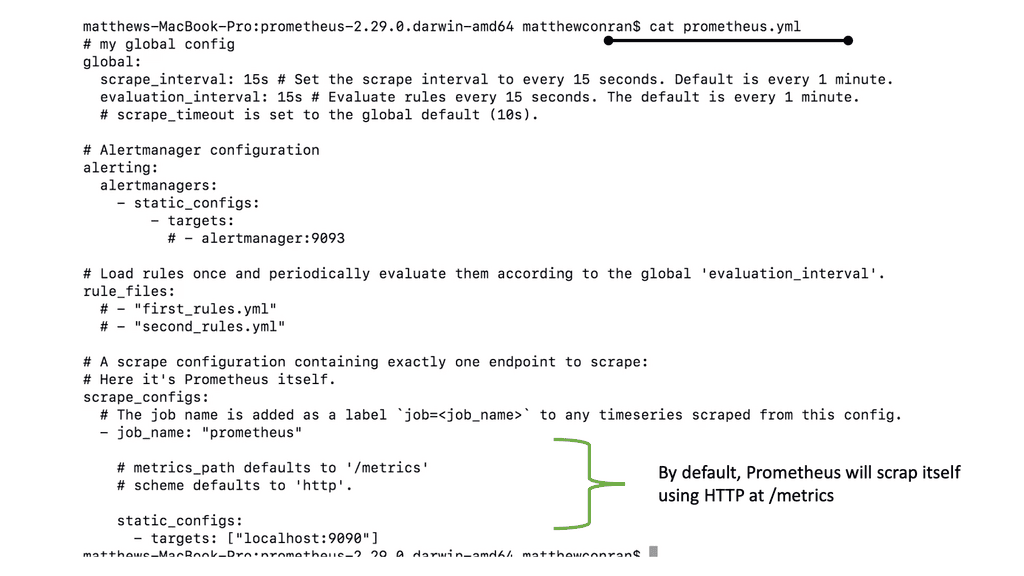
The Prometheus configuration file is written in YAML format and is defined by the scheme. I have done a CAT on the Prometheus configuration file to give you an idea of what it looks like. In the default configuration, a single job called Prometheus scrapes the time series data exposed by the Prometheus server. The job contains a single, statically configured target, the local host on port 9090. 
The Transition to Prometheus network monitoring

Around eight years ago, Ganglia introduced SaaS-based monitoring solutions. These now solved some problems with alerting built-in and API to get to the data. However, now there are two systems, and this introduces complexity. The collector and the agents are pushing to the SaaS-based system along with an on-premises design.

These systems may need to be managed by two different teams. There can be cloud teams looking after the cloud-based SaaS solution and on-premises network or security teams looking at the on-premises monitoring. So, there is already a communication gap, not to mention the creation of a considerably siloed environment in one technology set—monitoring.

Also, questions arise about where to put the metrics in the SaaS-based product or Ganga. For example, we could have different metrics in the same place or the same metrics in only one spot. How can you keep track and ensure consistency?

Ideally, if you have a dispersed PoP design and expect your infrastructure to grow and plan for the future, you don’t want to have centralized collectors. But unfortunately, most on-premise solutions still have a push-based centralized model. 

Prometheus Monitoring: Prometheus Pull

Then Prometheus Pull came around and offered a new approach to monitoring. It can handle millions of metrics on modest hardware. In general, rather than having external services push metrics to it, Prometheus uses a pull approach compared to a push approach.

Prometheus network monitoring is a server application written in GO. It is an open-source, decentralized monitoring tool that can be centralized using the federate option. Prometheus has a server component, which you run in each environment. You can also run a Prometheus container in each Kubernetes pod.

We use a time-series database for Prometheus monitoring, and every metric is recorded with a timestamp. Prometheus is not an SQL database; you need to use PromQL as its query language, which allows you to query the metrics. 

Prometheus Monitoring: Legacy System

So, let us expand on this and look at two environments for monitoring. We have a legacy environment and a modern Kubernetes environment. We are running a private cloud for the legacy with many SQL, Windows, and Linux servers. There is nothing new here. Here, you would run Prometheus on the same subnet. A Prometheus agent would also be installed. 

We would have Node Exporters for both Linux and Windows, extracting and creating a metric endpoint on your servers. The metric endpoint is needed on each server or host so Prometheus can scrap the metrics. So, a Daemon is running, collecting all of the metrics. These metrics are exposed on a page, for example, http://host:port/metrics, that allows Prometheus to scrape. 

There is also a Prometheus federation feature. You can have a federated endpoint, allowing Prometheus to expose its metrics to other services. This will enable you to pull metrics around different subnets. So, we can have another Prometheus in a different subnet, scrapping the other Prometheus. The federate option will enable you to link these two Prometheus solutions quickly. 
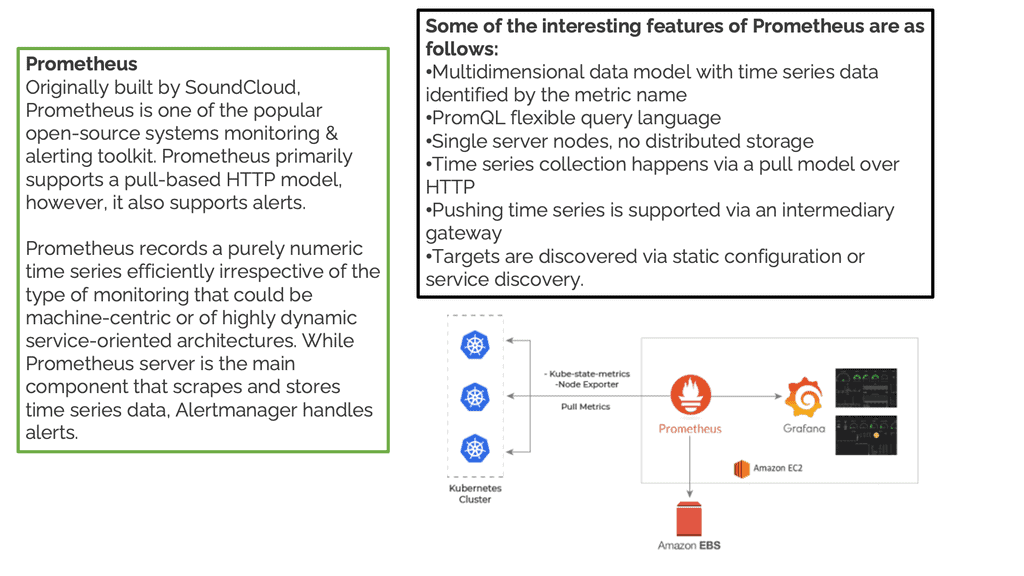
Prometheus Monitoring
Diagram: Prometheus Monitoring. Source is Opcito

Prometheus Monitoring: Modern Kubernetes

Here, we have a microservices observability platform and a bunch of containers or VMs running in a Kubernetes cluster. In this environment, we usually create a namespace; for example, we could call the namespace monitoring. So, we deploy a Prometheus pod in our environments.

The Prometheus pod YAML file will point to the Kubernetes API. The Kubernetes API has a metric server that gets all metrics from your environments. So here we are, getting metrics for the container processes. You can deploy the library in your code if you want to instrument your application.

This can be done with Prometheus code libraries. We now have a metrics endpoint similar to before, and we can grab metrics specific to your application. We also have a metrics endpoint on each container that Prometheus can scrape.

**What is Prometheus Exporter**

Prometheus exporter is a specialized component that extracts and exposes metrics from third-party systems, applications, and services. It bridges Prometheus, an open-source monitoring and alerting toolkit, and the target system or application.

By implementing the Prometheus exporter, users can conveniently collect and monitor custom metrics, enabling them to gain valuable insights into their systems’ health and performance.

How Does Prometheus Exporter Work?

Prometheus exporter follows a simple and efficient architecture. It utilizes a built-in HTTP server to expose metrics in a format that Prometheus understands. The exporter periodically collects metrics from the target system or application and makes them available over HTTP endpoints. Prometheus then scrapes these endpoints, discovers and stores the metrics, and performs analysis and alerting based on the defined rules.

Benefits of Prometheus Exporter:

1. Flexibility: The Prometheus exporter provides flexibility in monitoring various metrics, making it suitable for multiple systems and applications. With its support for custom metrics, users can easily monitor specific aspects and gain insights into their systems’ behavior.

2. Compatibility: Due to its popularity, many systems and applications offer native support for Prometheus exporters. This compatibility allows users to effortlessly integrate the exporter into their existing monitoring infrastructure, eliminating the need for complex configurations or additional tools.

3. Extensibility: Prometheus exporter encourages extensibility by offering a straightforward mechanism to develop and expose custom metrics. This capability enables users to monitor specific application-level metrics critical to their unique monitoring requirements.

4. Scalability: With Prometheus exporter, users can scale their monitoring infrastructure as their systems grow. The exporter’s lightweight design and efficient data collection mechanism ensure that monitoring remains reliable and efficient, even in high-throughput environments.

Exposing Runtime Metrics: The Prometheus Exporter

  • Exporter Types:

To enable Prometheus monitoring, you must add a metric API to the application containers to support this. For applications that don’t have their metric API, we use what is known as an Exporter. This utility reads the runtime metrics the app has already collected and exposes them on an HTTP endpoint.

Prometheus can then look at this HTTP endpoint. So we have different types of Exporters that collect metrics for other runtimes, such as a JAVA Exporter, which will give you a set of JVM statistics, and a .NET Exporter, which will provide you with a set of Windows performance metrics.

Essentially, we are adding a Prometheus endpoint to the application. In addition, we use an Exporter utility alongside the application. So, we will have two processes running in the container. 

With this approach, you don’t need to change the application. This could be useful for some regulatory environments where you can’t change the application code. So now you have application runtime metrics without changing any code.

This is the operating system and application host data already collected in the containers. To make these metrics available to Prometheus, add an Exporter to the Docker Image. Many use the Exporters for legacy applications instead of changing the code to support Prometheus monitoring.

Essentially, we are exporting the statistics to a metric endpoint.

Prometheus Monitoring • Block 3

Exporter & Kubernetes Monitoring Lab

Not every system can expose Prometheus metrics directly. Choose the environment and see when direct instrumentation, an exporter, or Kubernetes-aware discovery is the better monitoring pattern.

Application you control

You own the application code and can add Prometheus client-library instrumentation directly into the application.

Recommended collection pattern
Direct instrumentation
This gives the application a native metrics interface for application-specific measurements such as request rates, latency, queue depth, and business-level counters.
GET /metrics

Architecture

Application Instrumented code
→
Prometheus Scrapes metrics
→
PromQL Query / alert

Can you change the application?

Kubernetes monitoring pattern

Kubernetes introduces a dynamic environment where workloads can be created, removed, rescheduled, and scaled. Prometheus can use the Kubernetes API for service discovery and then scrape appropriate targets.

1
Kubernetes API Provides current cluster objects and metadata.
2
Discovery Prometheus identifies eligible targets.
3
Labels Namespace, pod, service and application context.
4
Scrape Prometheus requests metrics from the target.
5
Query PromQL powers dashboards and alerts.
In Kubernetes environments, the exact configuration depends on the Prometheus deployment. A plain Prometheus configuration can use Kubernetes service discovery; Prometheus Operator-based environments may additionally use resources such as ServiceMonitor or PodMonitor to define scrape intent.

Collection method cheat sheet

Environment Pattern Why
Application you own Client library Expose application-specific metrics directly from the code.
Linux host Node Exporter Expose operating-system and host-level metrics without modifying the OS.
Existing database Database exporter Translate database statistics into Prometheus-compatible metrics.
HTTP / network endpoint Blackbox Exporter Probe availability, latency, status codes, DNS, TLS and related behaviour.
Kubernetes workload Discovery + scrape Handle dynamically changing workloads and attach Kubernetes context.
Engineering takeaway Use direct instrumentation when you control the application and need application-specific metrics. Use an exporter when you need to expose metrics from an existing system that cannot reasonably be instrumented. In Kubernetes, combine dynamic discovery with the appropriate scrape pattern so monitoring follows the workload as it changes.
Exporters are not all the same: some expose host or application statistics, while probing exporters such as Blackbox Exporter actively test an external endpoint. The common pattern is that Prometheus still scrapes the exporter's metrics endpoint.