WAN Monitoring
In today's digital landscape, the demand for seamless and reliable network connectivity is paramount. This is where Software-Defined Wide Area Networking (SD-WAN) comes into play. SD-WAN offers enhanced agility, cost savings, and improved application performance. However, to truly leverage the benefits of SD-WAN, effective monitoring is crucial. In this blogpost, we will explore the importance of SD-WAN monitoring and how it empowers businesses to conquer the digital highway.
SD-WAN monitoring involves the continuous observation and analysis of network traffic, performance metrics, and security aspects within an SD-WAN infrastructure. It provides real-time insights into network behavior, enabling proactive troubleshooting, performance optimization, and security management.
WAN monitoring refers to the practice of actively monitoring and managing a wide area network to ensure its smooth operation. It involves collecting data about network traffic, bandwidth utilization, latency, packet loss, and other key performance indicators. By continuously monitoring the network, administrators can identify potential issues, troubleshoot problems, and optimize performance.
Proactive Network Management: WAN monitoring enables proactive identification and resolution of network issues before they impact users. By receiving real-time alerts and notifications, administrators can take immediate action to mitigate disruptions and minimize downtime.
Enhanced Performance: With WAN monitoring, administrators gain granular visibility into network performance metrics. They can identify bandwidth bottlenecks, optimize routing, and allocate resources efficiently, resulting in improved network performance and user experience.
Security and Compliance: WAN monitoring helps detect and prevent security breaches by monitoring traffic patterns and identifying anomalies. It enables the identification of potential threats, such as unauthorized access attempts or data exfiltration. Additionally, it aids in maintaining compliance with industry regulations by monitoring network activity and generating audit logs.
Scalability: When selecting a WAN monitoring solution, it is important to consider its scalability. Ensure that the solution can handle the size and complexity of your network infrastructure, accommodating future growth and network expansions.
Real-time Monitoring: Look for a solution that provides real-time monitoring capabilities, allowing you to detect issues as they occur. Real-time data and alerts enable prompt troubleshooting and minimize the impact on network performance.
Comprehensive Reporting: A robust WAN monitoring solution should offer detailed reports and analytics. These reports provide valuable insights into network performance trends, usage patterns, and potential areas for improvement.Matt Conran
Highlights: WAN Monitoring
Cloud-based Services
Cloud-based services, such as SaaS applications, are becoming increasingly popular among enterprises, increasing reliance on the Internet to deliver WAN traffic. Because many critical applications and services are no longer internal, traditional MPLS services make suboptimal use of expensive backhaul WAN bandwidth. Consequently, enterprises are migrating to hybrid WANs and SD-WAN technologies that combine traditional MPLS circuits with direct Internet access (DIA).
Over the last several years, a thriving SD-WAN vendor and managed SD-WAN provider market has met this need. As enterprises refresh their branch office routers, SD-WAN solutions, and associated network monitoring capabilities are expected to become nearly ubiquitous.
Key Points: –
a) Choosing the Right Monitoring Tools: Selecting robust network monitoring tools is crucial for effective WAN monitoring. These tools should provide real-time insights, customizable dashboards, and comprehensive reporting capabilities to track network performance and identify potential issues.
b) Setting Up Performance Baselines: Establishing performance baselines helps organizations identify deviations from normal network behavior. IT teams can quickly identify anomalies and take corrective actions by defining acceptable thresholds for critical metrics, such as latency or packet loss.
c) Implementing Proactive Alerts: Configuring proactive alerts ensures that IT teams are promptly notified of performance issues or abnormalities. These alerts can be set up for specific metrics, such as bandwidth utilization exceeding a certain threshold, allowing IT teams to investigate and resolve issues before they impact users.
WAN Monitoring Metrics
**Overcome: Suboptimal Performance**
With a growing distributed workforce, enterprises are increasingly leveraging cloud-based applications. As evolving business needs have dramatically expanded to include software as a service (SaaS) and the cloud, enterprises are moving to wide area networks (WANs) that are software-defined, Internet-centric, and architected for optimal interconnection with cloud and external services to combat rising transport costs and suboptimal application performance.
**Gaining: WAN Valuable Insights**
Monitoring a WAN’s performance involves tracking various metrics that provide valuable insights into its health and efficiency. These metrics include latency, packet loss, jitter, bandwidth utilization, and availability. Explore these metrics and understand their importance in maintaining a robust network infrastructure.
1. Latency: Latency refers to the time data travels from the source to the destination. Even minor delays in data transmission can significantly impact application performance, especially for real-time applications like video conferencing or VoIP. We’ll discuss how measuring latency helps identify potential network congestion points and optimize data routing for reduced latency.
2. Packet Loss: Packet loss occurs when data packets fail to reach their intended destination. This can lead to retransmissions, increased latency, and degraded application performance. By monitoring packet loss rates, network administrators can pinpoint underlying issues, such as network congestion or hardware problems, and take proactive measures to mitigate packet loss.
3. Jitter: Jitter refers to the variation in delay between data packets arriving at their destination. High jitter can lead to inconsistent performance, particularly for voice and video applications. We’ll explore how monitoring jitter helps identify network instability and implement quality of service (QoS) mechanisms to ensure smooth data delivery.
4. Bandwidth Utilization: Effective bandwidth utilization is crucial for maintaining optimal network performance. Monitoring bandwidth usage patterns helps identify peak usage times, bandwidth-hungry applications, and potential network bottlenecks. We’ll discuss the significance of bandwidth monitoring and how it enables network administrators to allocate resources efficiently and plan for future scalability.
Example Product: Cisco ThousandEyes
### Introduction to Cisco ThousandEyes
In today’s hyper-connected world, maintaining a reliable, high-performance Wide Area Network (WAN) is crucial for businesses of all sizes. Enter Cisco ThousandEyes, a robust network intelligence platform designed to provide unparalleled visibility into your WAN performance. From detecting outages to diagnosing complex network issues, ThousandEyes is a game-changer in the realm of WAN monitoring.
### Why WAN Monitoring Matters
WAN monitoring is essential for ensuring that your network operates smoothly and efficiently. With the increasing reliance on cloud services, SaaS applications, and remote work environments, any disruption in WAN can result in significant downtime and lost productivity. Cisco ThousandEyes offers a comprehensive solution by continuously monitoring the health of your WAN, identifying potential issues before they escalate, and providing actionable insights to resolve them promptly.
### Key Features of Cisco ThousandEyes
1. **Synthetic Monitoring**: Simulate user interactions to proactively identify potential issues.
2. **Real-Time Data Collection**: Gather real-time metrics on latency, packet loss, and jitter.
3. **Path Visualization**: Visualize the entire network path from end-user to server, identifying bottlenecks.
4. **Alerts and Reporting**: Set up custom alerts and generate detailed reports for proactive management.
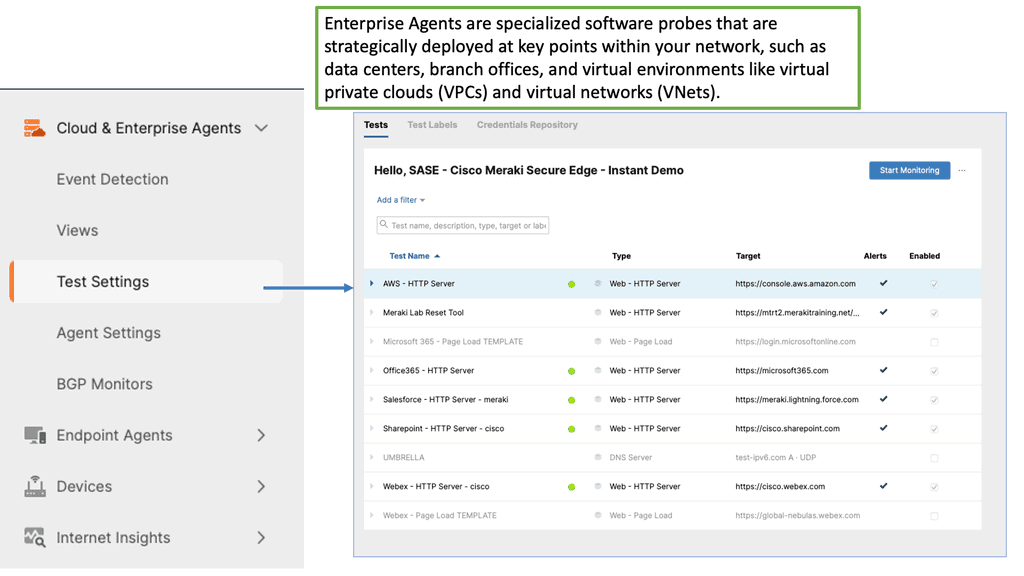
5. **Global Agent Coverage**: Deploy agents globally to monitor network performance from various locations.
WAN Monitoring Tools
WAN monitoring tools are software applications or platforms that enable network administrators to monitor, analyze, and troubleshoot their wide area networks.
These tools collect data from various network devices and endpoints, providing valuable insights into network performance, bandwidth utilization, application performance, and security threats. Organizations can proactively address issues and optimize their WAN infrastructure by comprehensively understanding their network’s health and performance.
WAN monitoring tools offer a wide range of features to empower network administrators. These include real-time monitoring and alerts, bandwidth utilization analysis, application performance monitoring, network mapping and visualization, traffic flow analysis, and security monitoring.
With these capabilities, organizations can identify bottlenecks, detect network anomalies, optimize resource allocation, ensure Quality of Service (QoS), and mitigate security risks. Furthermore, many tools provide historical data analysis and reporting, enabling administrators to track network performance trends and make data-driven decisions.
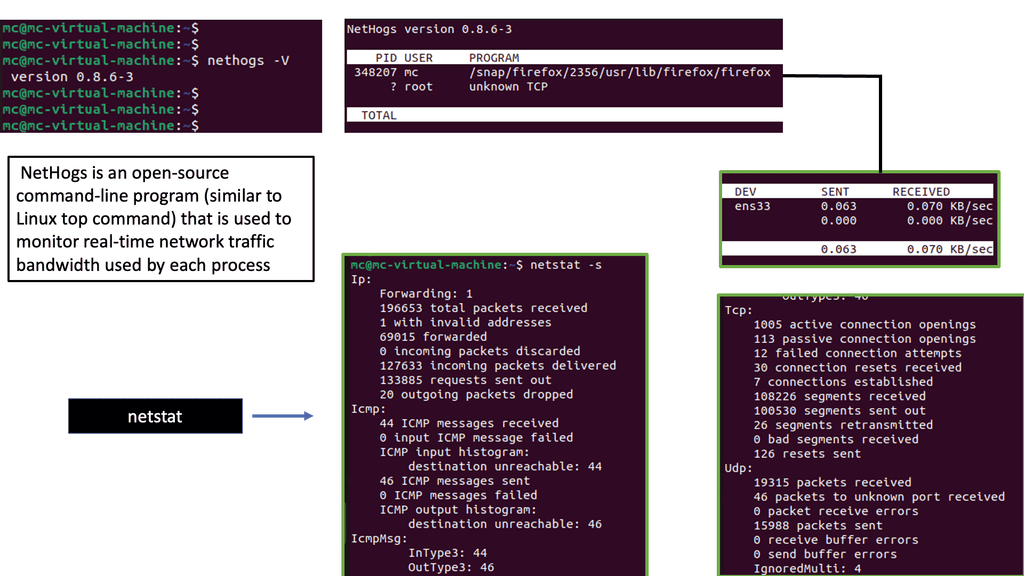
Example Monitoring Technology: Nethogs
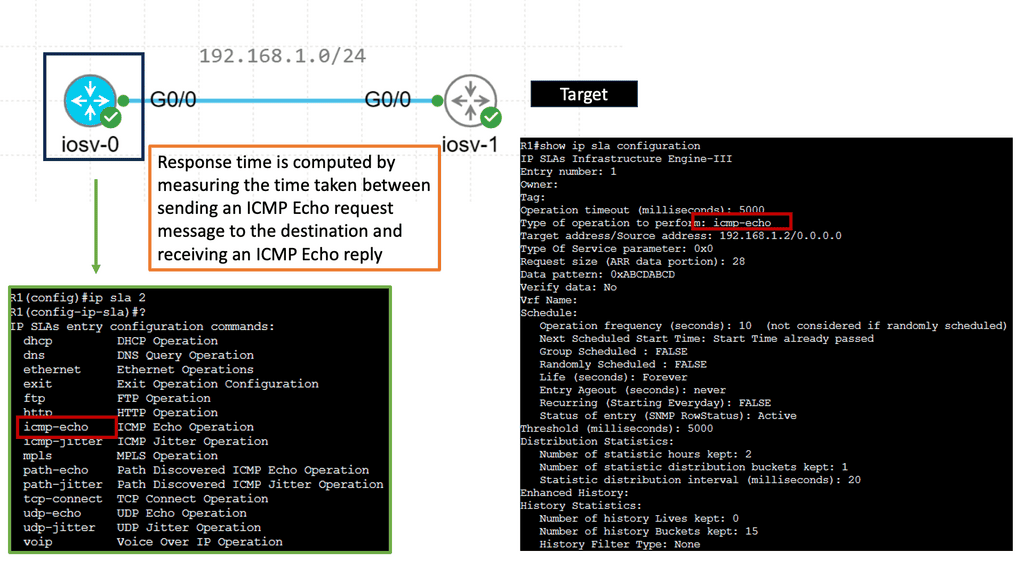
IP SLAs ICMP Echo Operation
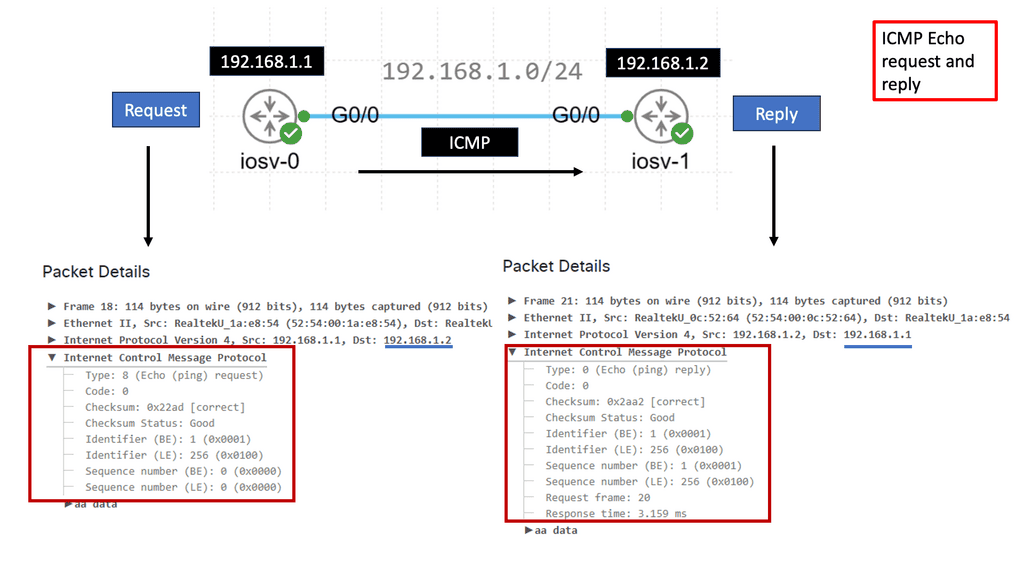
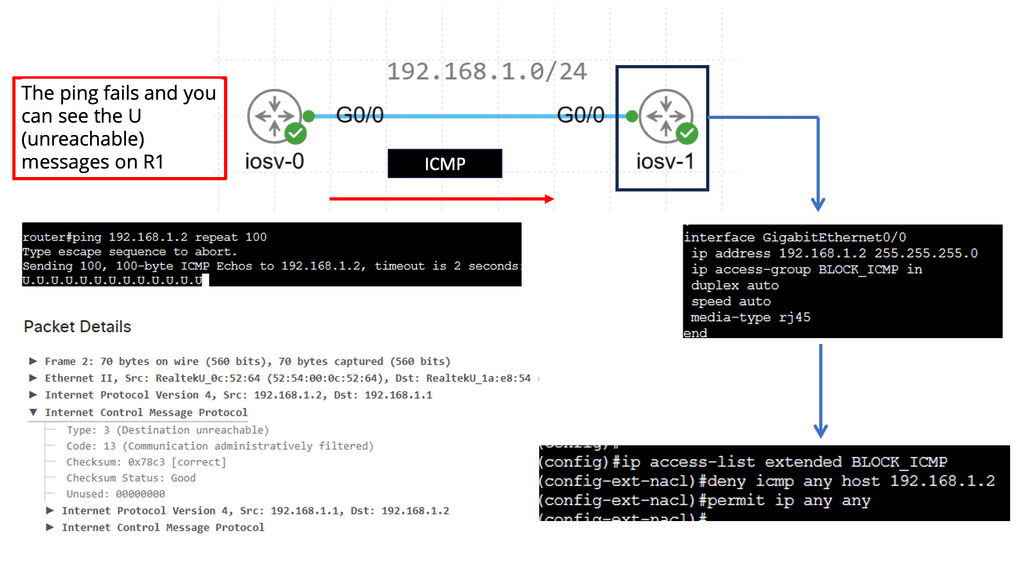
IP SLAs ICMP Echo Operations, also known as Internet Protocol Service Level Agreements Internet Control Message Protocol Echo Operations, is a feature Cisco devices provide. It allows network administrators to measure network performance by sending ICMP echo requests (ping) between devices, enabling them to gather valuable data about network latency, packet loss, and jitter.
Network administrators can proactively monitor network performance, identify potential bottlenecks, and troubleshoot connectivity issues using IP SLAs ICMP Echo Operations. The key benefits of this feature include:
1. Performance Monitoring: IP SLAs ICMP Echo Operations provides real-time monitoring capabilities, allowing administrators to track network performance metrics such as latency and packet loss.
2. Troubleshooting: With IP SLAs ICMP Echo Operations, administrators can pinpoint network issues and determine whether network devices, configuration, or external factors cause them.
3. SLA Compliance: Organizations relying on Service Level Agreements (SLAs) can leverage IP SLAs ICMP Echo Operations to ensure compliance with performance targets and quickly identify deviations.
Understanding Traceroute
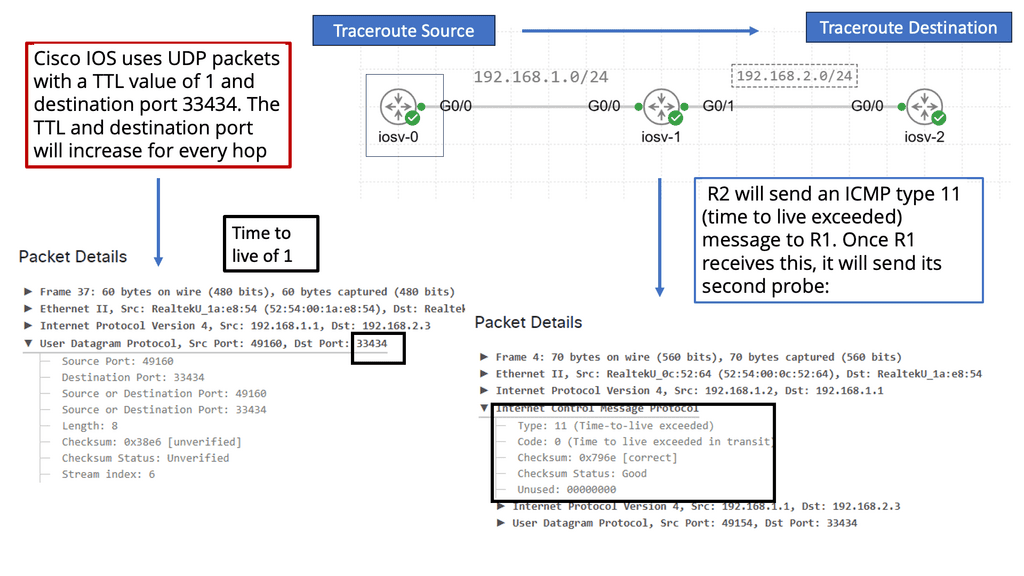
Traceroute, also known as tracert in Windows, is a network diagnostic tool that traces the path packets taken from your device to a destination. It provides valuable insights into the various hops or intermediate devices that data encounters. By sending a series of specially crafted packets, traceroute measures the time it takes for each hop to respond, enabling us to visualize the network path.
- Time-to-Live (TTL) field in IP packets
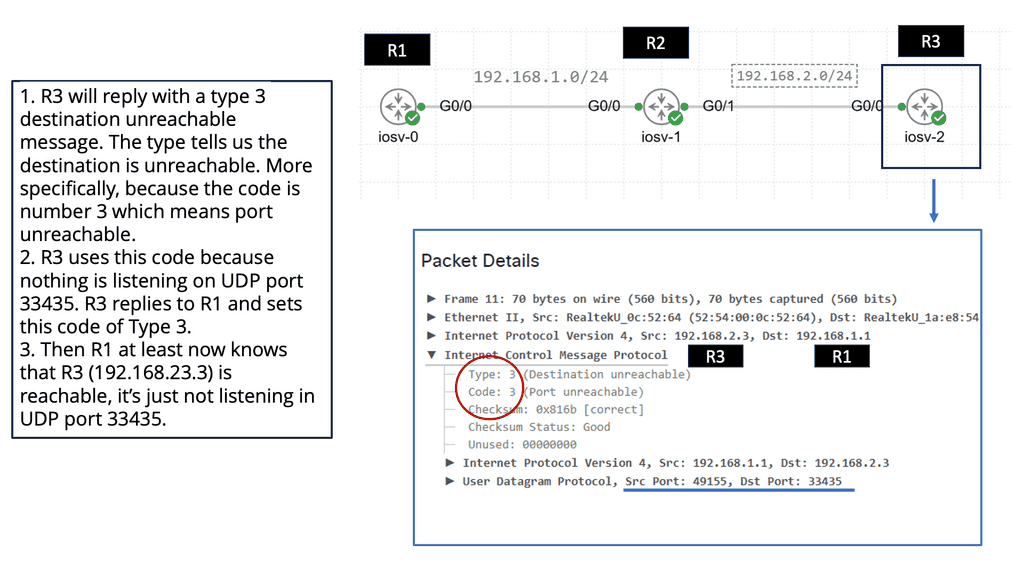
Behind the scenes, traceroute utilizes the Time-to-Live (TTL) field in IP packets to gather information about the hops. It starts by sending packets with a TTL of 1, which ensures they are discarded by the first hop encountered. The hop then sends back an ICMP Time Exceeded message, indicating its presence. Traceroute then repeats this process, gradually incrementing the TTL until it reaches the destination and receives an ICMP Echo Reply.
- Packet’s round-trip time (RTT).
As the traceroute progresses through each hop, it collects IP addresses and measures each packet’s round-trip time (RTT). These valuable pieces of information allow us to map the network path. By correlating IP addresses with geographical locations, we can visualize the journey of our data on a global scale.
- Capture Network Issues
Traceroute is not only a fascinating tool for exploration but also a powerful troubleshooting aid. We can identify potential bottlenecks, network congestion, or even faulty devices by analyzing the RTT values and the number of hops. This makes traceroute an invaluable resource for network administrators and tech enthusiasts alike.
Understanding ICMP Basics
ICMP, often called the “heart and soul” of network troubleshooting, is an integral part of the Internet Protocol Suite. It operates at the network layer and is responsible for vital functions such as error reporting, network diagnostics, and route change notifications. By understanding the basics of ICMP, we can gain insights into how it contributes to efficient network communication.
ICMP Message Types
ICMP encompasses a wide range of message types that serve different purposes. From ICMP Echo Request (ping) to Destination Unreachable, Time Exceeded, and Redirect messages, each type serves a unique role in network diagnostics and troubleshooting. Exploring these message types and their significance will shed light on the underlying mechanisms of network communication.
**Round-trip time, packet loss, and network congestion**
Network administrators and operators heavily rely on ICMP to monitor network performance. Key metrics such as round-trip time, packet loss, and network congestion can be measured using ICMP tools and techniques. This section will delve into how ICMP aids in network performance monitoring and the benefits it brings to maintaining optimal network operations.
Use Case: At the WAN Edge
**Performance-Based Routing**
Performance-based or dynamic routing is a method of intelligently directing network traffic based on real-time performance metrics. Unlike traditional static routing, which relies on predetermined paths, performance-based routing adapts dynamically to network conditions. By continuously monitoring factors such as latency, packet loss, and bandwidth availability, performance-based routing ensures that data takes the most optimal path to reach its destination.
Key Points: –
A. Enhanced Network Reliability: By constantly evaluating network performance, performance-based routing can quickly react to failures or congestion, automatically rerouting traffic to alternate paths. This proactive approach minimizes downtime and improves overall network reliability.
B. Improved Application Performance: Performance-based routing can prioritize traffic based on specific application requirements. Critical applications, such as video conferencing or real-time data transfer, can be allocated more bandwidth and given higher priority, ensuring optimal performance and user experience.
C. Efficient Resource Utilization: Performance-based routing optimizes resource utilization across multiple network paths by intelligently distributing network traffic. This results in improved bandwidth utilization, reduced congestion, and a more efficient use of available resources.
D. Performance Metrics and Monitoring: Organizations must deploy network monitoring tools to collect real-time performance metrics to implement performance-based routing. These metrics serve as the foundation for decision-making algorithms that determine the best path for network traffic.
E. Dynamic Path Selection Algorithms: Implementing performance-based routing requires intelligent algorithms capable of analyzing performance metrics and selecting the most optimal path for each data packet. These algorithms consider latency, packet loss, and available bandwidth to make informed routing decisions.
F. Network Infrastructure Considerations: Organizations must ensure their network infrastructure can support the increased complexity before implementing performance-based routing. This may involve upgrading network devices, establishing redundancy, and configuring routing protocols to accommodate dynamic path selection.
Ensuring High Availability and Performance
– Network downtime and performance issues can significantly impact business operations, causing financial losses and damaging reputation. Network monitoring allows organizations to proactively monitor and manage network infrastructure, ensuring high availability and optimal performance.
– Network administrators can identify and address issues promptly by tracking key performance indicators, such as response time and uptime, minimizing downtime, and maximizing productivity.
– As businesses grow and evolve, their network requirements change. Network monitoring provides valuable insights into network capacity utilization, helping organizations plan for future growth and scalability.
– By monitoring network traffic patterns and usage trends, IT teams can identify potential capacity bottlenecks, plan network upgrades, and optimize resource allocation. This proactive approach enables businesses to scale their networks effectively, avoiding performance issues associated with inadequate capacity.
Monitoring TCP
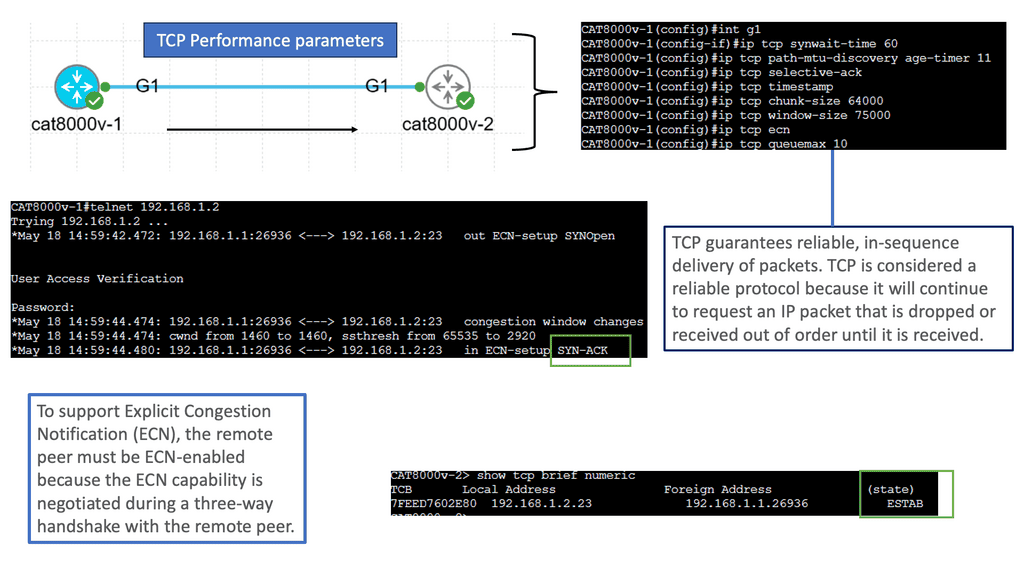
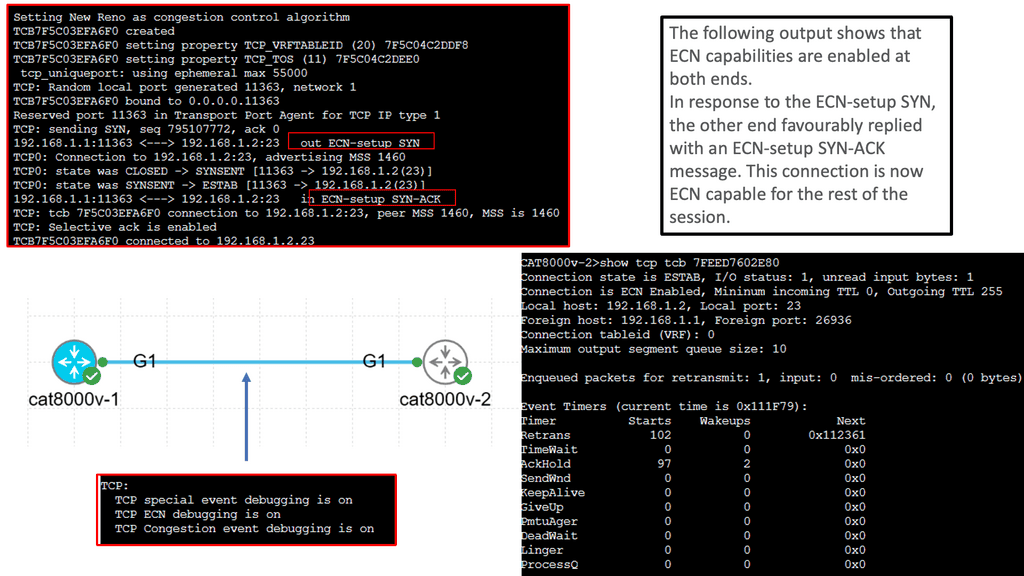
TCP (Transmission Control Protocol) is a fundamental component of Internet communication, ensuring reliable data transmission. Behind the scenes, TCP performance parameters are crucial in optimizing network performance.
TCP Performance Parameters:
TCP performance parameters are configuration settings that govern the behavior of TCP connections. These parameters determine various aspects of the transmission process, including congestion control, window size, timeouts, and more. Network administrators can balance reliability, throughput, and latency by adjusting these parameters.
Congestion Window (CWND): CWND represents the number of unacknowledged packets a sender can transmit before awaiting an acknowledgment. Adjusting CWND can affect the amount of data sent, impacting throughput and congestion control.
Maximum Segment Size (MSS): MSS refers to the maximum amount of data transmitted in a single TCP segment. Optimizing MSS can help reduce overhead and improve overall efficiency.
Window Scaling: Window scaling allows for adjusting the TCP window size beyond its traditional limit of 64KB. Enabling window scaling can enhance throughput, especially in high-bandwidth networks.
Note: To fine-tune TCP performance parameters, network administrators must carefully analyze their network’s requirements and characteristics. Here are some best practices for optimizing TCP performance:
Analyze Network Conditions: Understanding the network environment, including bandwidth, latency, and packet loss, is crucial for selecting appropriate performance parameters.
Conduct Experiments: It’s essential to test different parameter configurations in a controlled environment to determine their impact on network performance. Tools like Wireshark can help monitor and analyze TCP traffic.
Monitor and Adjust: Network conditions are dynamic, so monitoring TCP performance and adjusting parameters accordingly is vital for maintaining optimal performance.
What is TCP MSS?
TCP MSS refers to the maximum amount of data transmitted in a single TCP segment. It represents the payload size within the segment, excluding the TCP header. The MSS value is negotiated during the TCP handshake process, allowing both ends of the connection to agree upon an optimal segment size.
**Amount of data in each segement**
Efficiently managing TCP MSS is crucial for various reasons. Firstly, it impacts network performance by directly influencing the amount of data sent in each segment. Controlling MSS can help mitigate packet fragmentation and reassembly issues, reducing the overall network overhead. Optimizing TCP MSS can also enhance throughput and minimize latency, improving application performance.
**Crucial Factors to consider**
Several factors come into play when determining the appropriate TCP MSS value. Network infrastructure, such as routers and firewalls, may impose limitations on the MSS. Path MTU (Maximum Transmission Unit) discovery also affects TCP MSS, as it determines the maximum packet size that can be transmitted without fragmentation. Understanding these factors is vital for configuring TCP MSS appropriately.
Gaining WAN Visibility
Example Technology: NetFlow
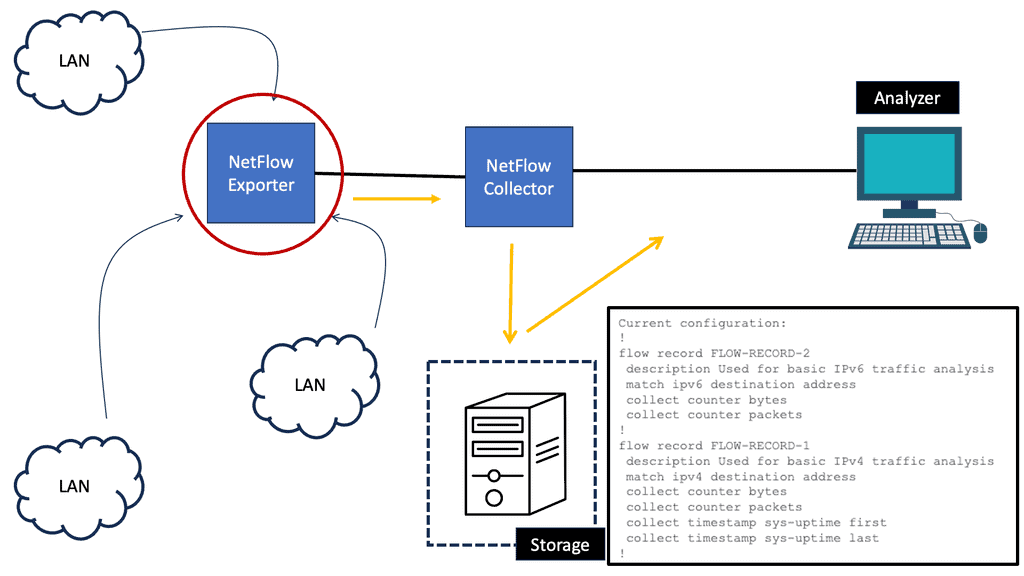
Implementing NetFlow provides numerous advantages for network administrators. Firstly, it enables comprehensive traffic monitoring, helping identify and troubleshoot performance issues, bottlenecks, or abnormal behavior. Secondly, NetFlow offers valuable insights into network security, allowing the detection of potential threats, such as DDoS attacks or unauthorized access attempts. Additionally, NetFlow facilitates capacity planning by providing detailed traffic statistics, which helps optimize network resources and infrastructure.
Implementing NetFlow
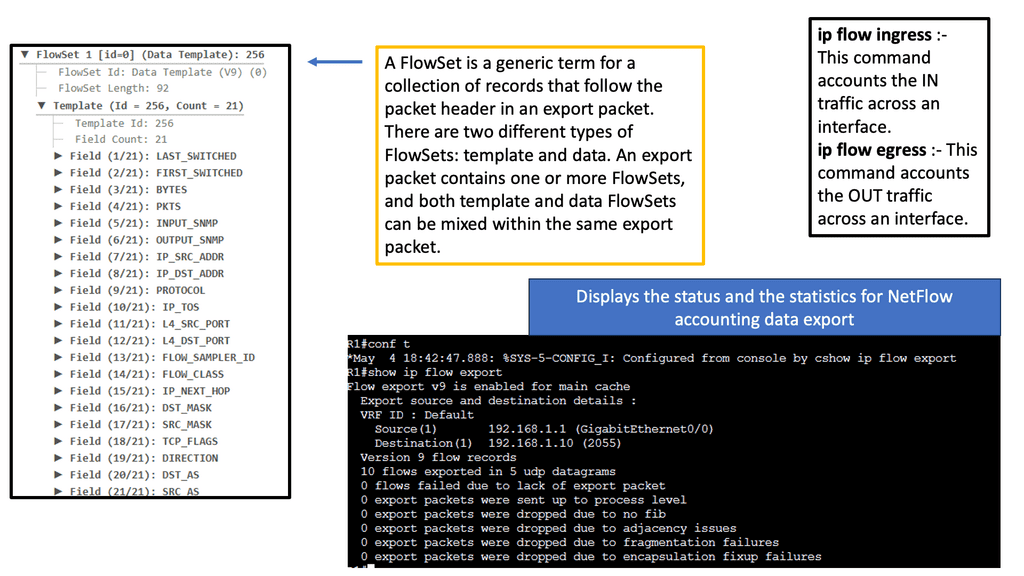
Implementing NetFlow requires both hardware and software components. Network devices like routers and switches need to support NetFlow functionality. Configuring NetFlow on these devices involves defining flow record formats, setting sampling rates, and specifying collector destinations. In terms of software, organizations can choose from various NetFlow collectors and analyzers that process and visualize the collected data. These tools offer powerful reporting capabilities and advanced features for network traffic analysis.
NetFlow use cases
NetFlow finds application in various scenarios across different industries. NetFlow data is instrumental in detecting and investigating security incidents, enabling prompt response and mitigation in cybersecurity. Network administrators leverage NetFlow to optimize bandwidth allocation, ensuring efficient usage and fair distribution. Moreover, NetFlow analysis plays a vital role in compliance monitoring, aiding organizations in meeting regulatory requirements and maintaining data integrity.
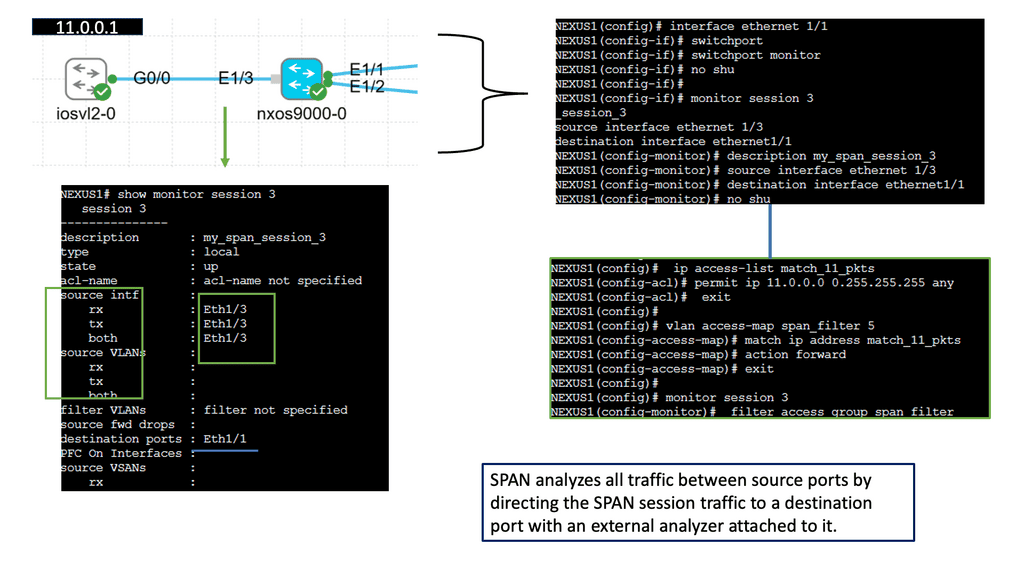
Ethernet Switched Port Analyzer:
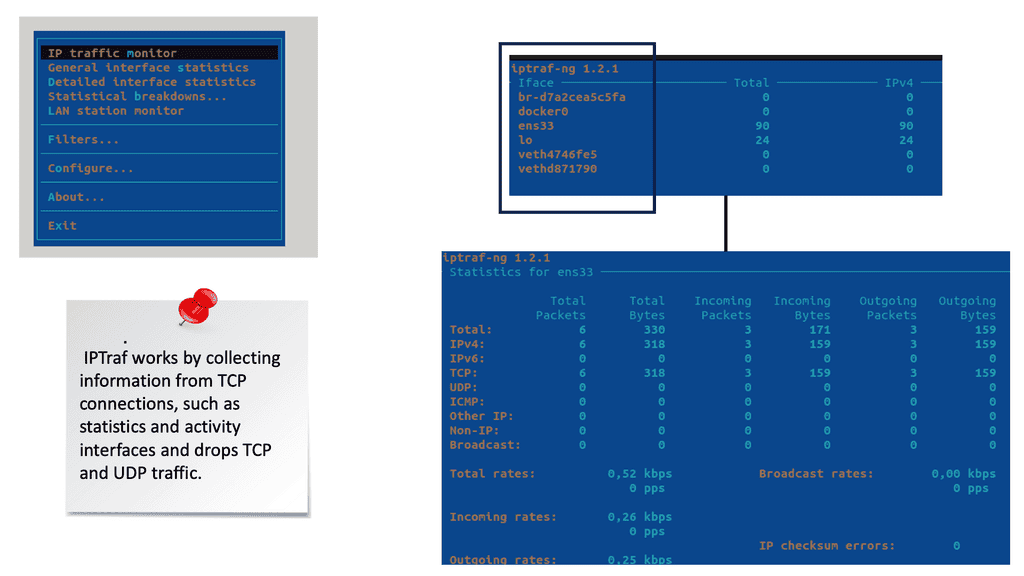
SPAN, also known as port mirroring, is a feature that enables the network switch to copy traffic from one or more source ports and send it to a destination port. This destination port is typically connected to a packet analyzer or network monitoring tool. By monitoring network traffic in real time, administrators gain valuable insights into network performance, security, and troubleshooting.
Proactive Monitoring:
The implementation of SPAN offers several advantages to network administrators. Firstly, it allows for proactive monitoring, enabling timely identification and resolution of potential network issues. Secondly, SPAN facilitates network troubleshooting by capturing and analyzing traffic patterns, helping to pinpoint the root cause of problems. Additionally, SPAN can be used for security purposes, such as detecting and preventing unauthorized access or malicious activities within the network.
Understanding sFlow:
sFlow is a technology that enables real-time network monitoring by sampling packets at wire speed. It offers a scalable and efficient way to collect comprehensive data about network performance, traffic patterns, and potential security threats. By leveraging the power of sFlow, network administrators gain valuable insights that help optimize network performance and troubleshoot issues proactively.
Implementing sFlow on Cisco NX-OS brings several key advantages. Firstly, it provides granular visibility into network traffic, allowing administrators to identify bandwidth-hungry applications, detect anomalies, and ensure optimal resource allocation. Secondly, sFlow enables real-time network performance monitoring, enabling rapid troubleshooting and minimizing downtime. Additionally, sFlow helps in capacity planning, allowing organizations to scale their networks effectively.
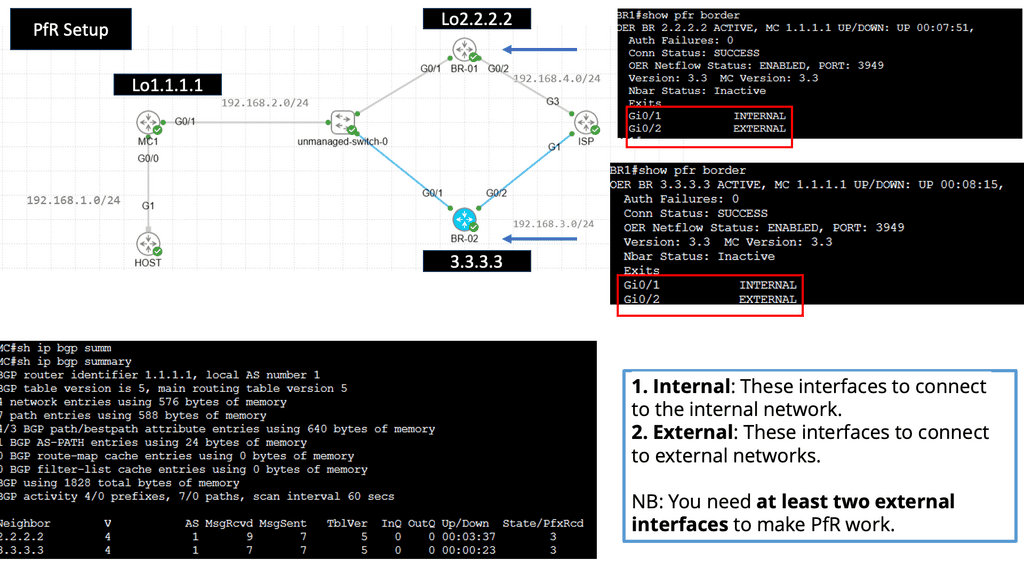
Use Case: Cisco Performance Routing
Understanding Cisco Pfr
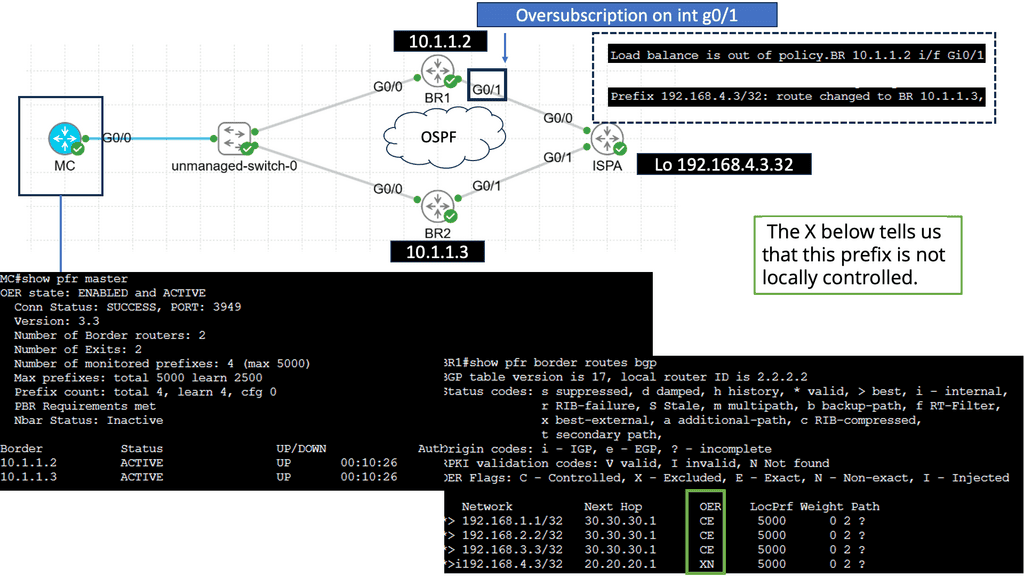
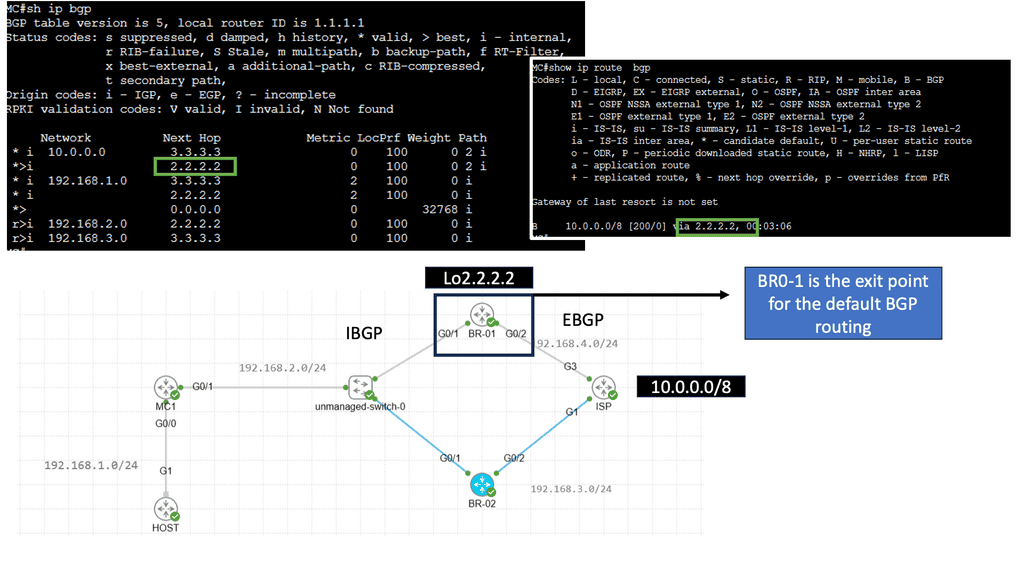
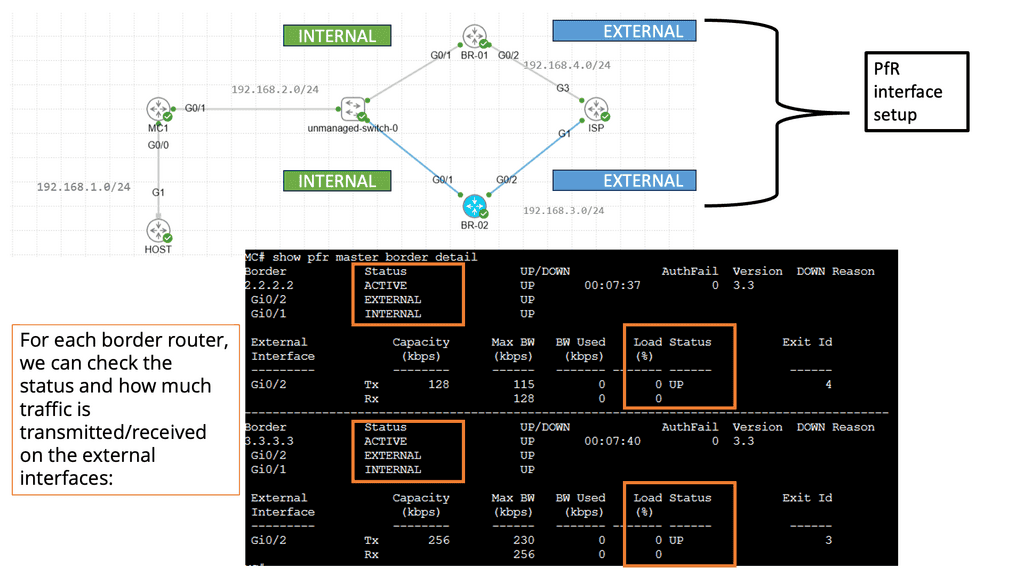
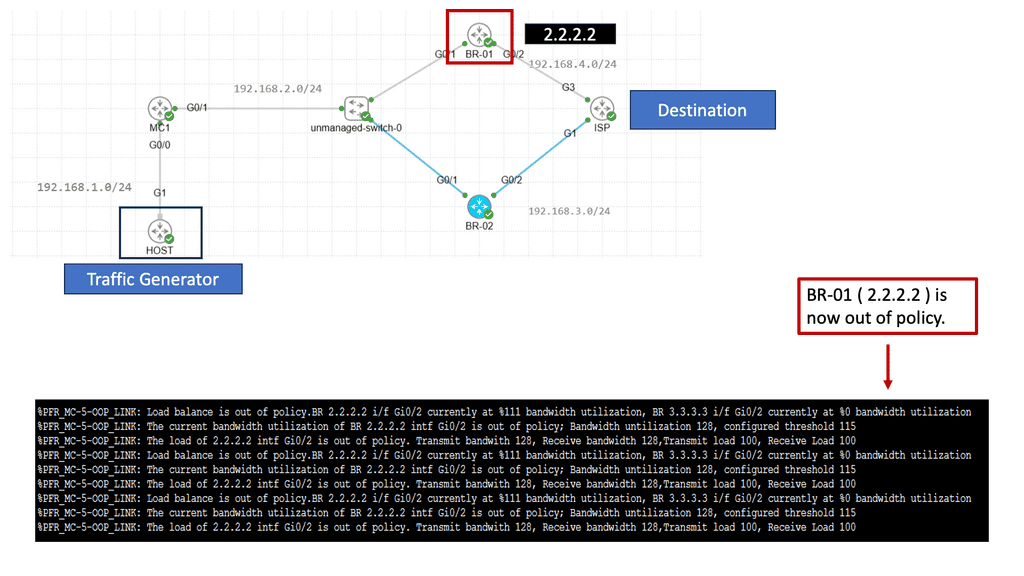
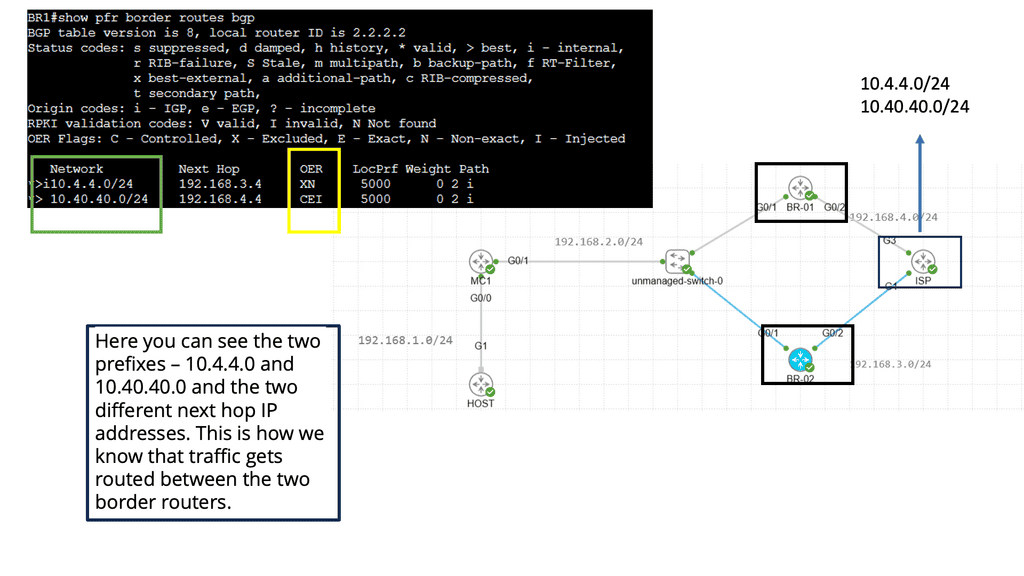
Cisco Pfr, also known as Optimized Edge Routing (OER), is an advanced routing technology that automatically selects the best path for network traffic based on real-time performance metrics. It goes beyond traditional routing protocols by considering link latency, jitter, packet loss, and available bandwidth. By dynamically adapting to changing network conditions, Cisco Pfr ensures that traffic is routed through the most optimal path, improving application performance and reducing congestion.
Enhanced Network Performance: Cisco Pfr optimizes traffic flow by intelligently selecting the most efficient path, reducing latency, and improving overall network performance. This leads to enhanced end-user experience and increased productivity.
Resilience and Redundancy: Cisco Pfr ensures high network availability by dynamically adapting to network changes. It automatically reroutes traffic in case of link failures, minimizing downtime and providing seamless connectivity.
Improved Application Performance: By intelligently routing traffic based on application-specific requirements, Cisco Pfr prioritizes critical applications and optimizes their performance. This ensures smooth and reliable application delivery, even in bandwidth-constrained environments.
SD-WAN Monitoring: The Components
WAN Chalenges:
So, within your data center topology, the old approach to the WAN did not scale very well. First, there is cost, complexity, and the length of installation times. The network is built on expensive proprietary equipment that is difficult to manage, and then we have expensive transport costs that lack agility.
1.Configuration Complexity:
Not to mention the complexity of segmentation with complex BGP configurations and tagging mechanisms used to control traffic over the WAN. There are also limitations to forwarding routing protocols. It’s not that they redesigned it severely; it’s just a different solution needed over the WAN.
2.Distributed Control Plane:
There was also a distributed control plane where every node had to be considered and managed. And if you had multi-vendor equipment at the WAN edge, different teams could have managed this in other locations.
You could look at 8 – 12 weeks as soon as you want to upgrade. With the legacy network, all the change control is with the service provider, which I have found to be a major challenge.
3.Architectural Challenges:
There was also a significant architectural change, where a continuous flow of applications moved to the cloud. Therefore, routing via the primary data center where the security stack was located was not as important. Instead, it was much better to route the application directly into the cloud in the first cloud world.
WAN Modernization
The initial use case of SD-WAN and other routing control platforms was to increase the use of Internet-based links and reduce the high costs of MPLS. However, when you start deploying SD-WAN, many immediately see the benefits. So, as you deploy SD-WAN, you are getting 5 x 9s with dual internal links, and MPLS at the WAN edge of the network is something you could move away from, especially for remote branches.
Required: Transport Independence
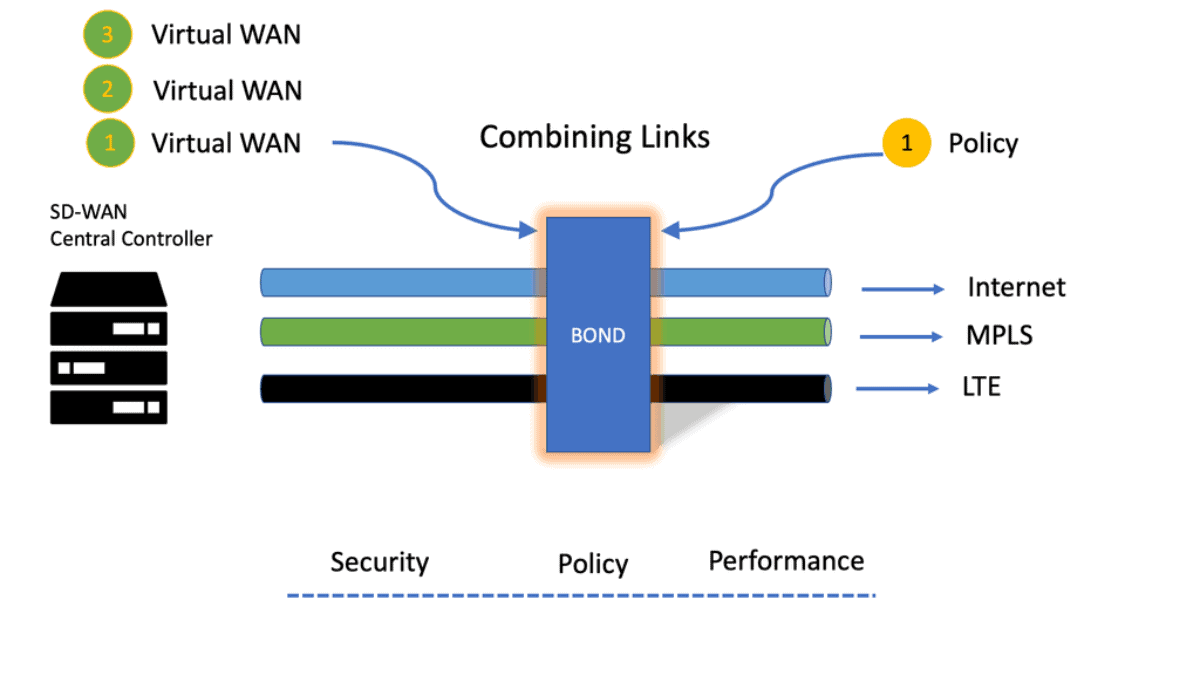
There was also the need for transport independence and to avoid the long lead times associated with deploying a new MPLS circuit. With SD-WAN, you create SD-WAN overlay tunnels over the top of whatever ISP and mix and match as you see fit.
Required: Constant Performance
With SD-WAN, we now have an SD-WAN controller in a central location. This brings with it a lot of consistency in security and performance. In addition, we have a consistent policy pushed through the network regardless of network locations.
SD-WAN monitoring and performance-based application delivery
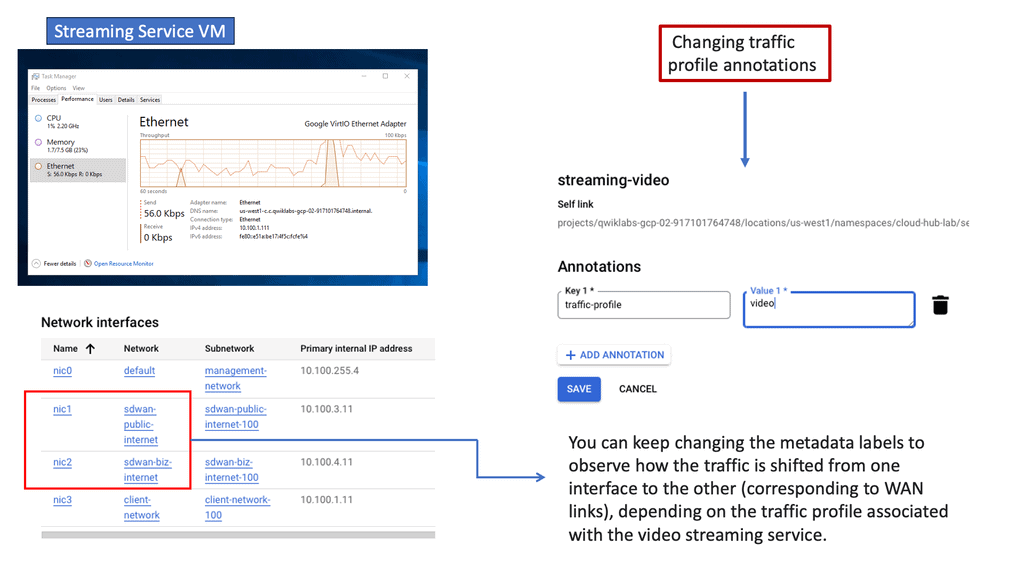
SD-WAN is also application-focused; we now have performance-based application delivery and routing. This type of design was possible with traditional WANs but was challenging and complex to manage daily. It’s a better use of capital and business outcomes. So we can use the less expensive connection without dropping any packets. There is no longer leverage in having something as a backup. With SD-WAN, you can find several virtual paths and routes around all failures.
**The ability to route intelligently**
Now, applications can be routed intelligently, and using performance as a key driver can make WAN monitoring more complete. It’s not just about making a decision based on up or down. Now we have the concept of brownouts, maybe high latency or high jitter. That circuit is not down, but the application will route around the issue with intelligent WAN segmentation.
Stage1: Application Visibility
For SD-WAN to make the correct provisioning and routing decisions, visibility into application performance is required. Therefore, SD-WAN enforces the right QoS policy based on how an application is tagged. To determine what prioritization they need within QoS policies, you need monitoring tools to deliver insights on various parameters, such as application response times, network saturation, and bandwidth usage. You control the overlay.
Stage2: Underlay Visibility
Then it would help if you considered underlay visibility. I have found a gap in visibility between the tunnels riding over the network and the underlying transport network. SD-WAN visibility leans heavily on the virtual overlay. For WAN underlay monitoring, we must consider the network is a hardware-dependent physical network responsible for delivering packets. The underlay network can be the Internet, MPLS, satellite, Ethernet, broadband, or any transport mode. A service provider controls the underlay.
Stage3: Security Visibility
Finally, and more importantly, security visibility. Here, we need to cover the underlay and overlay of the SD-WAN network, considering devices, domains, IPs, users, and connections throughout the network. Often, malicious traffic can hide in encrypted packets and appear like normal traffic—for example, crypto mining. The traditional deep packet inspection (DPI) engines have proven to fall short here.
We must look at deep packet dynamics (DPD) and encrypted traffic analysis (ETA). Combined with artificial intelligence (AI), it can fingerprint the metadata of the packet and use behavioral heuristics to see through encrypted traffic for threats without the negative aspects of decryption.
Googles SD-WAN Cloud Hub
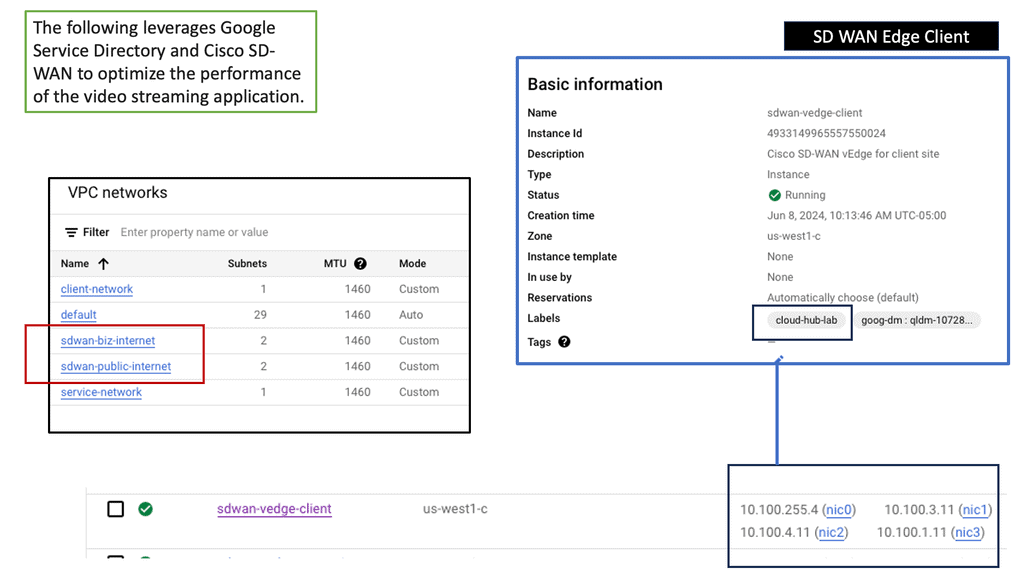
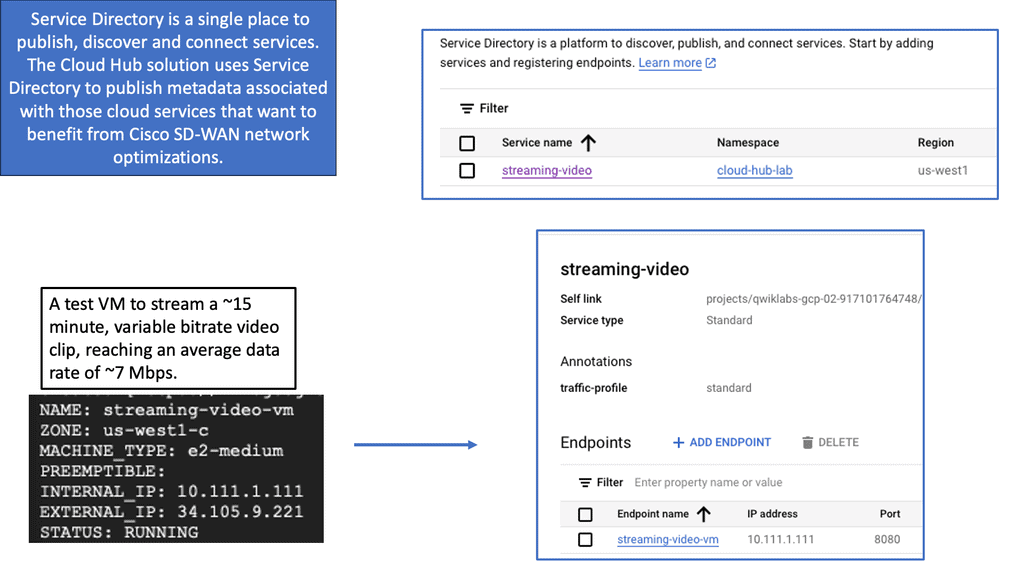
SD-WAN Cloud Hub is a cutting-edge networking technology that combines the power of software-defined wide area networking (SD-WAN) and cloud computing. It revolutionizes the way organizations connect and manage their network infrastructure. By leveraging the cloud as a central hub, SD-WAN Cloud Hub enables seamless connectivity between various branch locations, data centers, and cloud environments.
Enhance performance & reliability
One of the key advantages of SD-WAN Cloud Hub is its ability to enhance network performance and reliability. By intelligently routing traffic through the most optimal path, it minimizes latency, packet loss, and jitter. This ensures smooth and uninterrupted access to critical applications and services.
Centralised visibility & control
Additionally, SD-WAN Cloud Hub offers centralized visibility and control, allowing IT teams to streamline network management and troubleshoot issues effectively.
Troubleshoot brownouts
Detecting brownouts
Traditional monitoring solutions focus on device health and cannot detect complex network service issues like brownouts. Therefore, it is critical to evaluate solutions that are easy to deploy and use to simulate end-user behavior from the suitable locations for the relevant network services.
Required Active Monitoring
Most of the reported brownouts reported causes require active monitoring to detect. Five of the top six reasons brownouts occur can only be seen with active monitoring: congestion, buffer full drops, missing or misconfigured QoS, problematic in-line devices, external network issues, and poor planning or design of Wi-Fi.
Challenge: Troubleshooting Brownouts
Troubleshooting a brownout is difficult, especially when understanding geo policy and tunnel performance. What applications and users are affected, and how do you tie back to the SD-WAN tunnels? Brownouts are different from blackouts as application performance is affected.
SD-WAN Monitoring and Visibility
So, we have clear advantages to introducing SD-WAN; managers and engineers must consider how they operationalize this new technology. Designing and installing is one aspect, but how will SD-WAN be monitored and maintained? Where do visibility and security fit into the picture?
While most SD-WAN solutions provide native network and application performance visibility, this isn’t enough. I would recommend that you supplement native SD-WAN visibility with third-party monitoring tools. SD-WAN vendors are not monitoring or observability experts. So, it is like a networking vendor jumping into the security space.
Encrypted traffic and DPI
Traditionally, we look for anomalies against unencrypted traffic, and you can inspect the payload and use deep packet inspection (DPI). Nowadays, there is more than simple UDP scanning. Still, bad actors appear in encrypted traffic and can mask and hide activity among the usual traffic. This means some DPI vendors are ineffective and can’t see the payloads. Without appropriate visibility, the appliance will send a lot of alerts that are false positives.
**Deep packet inspection technology**
Deep packet inspection technology has been around for decades. It utilizes traffic mirroring to analyze the payload of each packet passing through a mirrored sensor or core device, the traditional approach to network detection and response (NDR). Most modern cyberattacks, including ransomware, lateral movement, and Advanced Persistent Threats (APT), heavily utilize encryption in their attack routines. However, this limitation can create a security gap since DPI was not built to analyze encrypted traffic.
**Legacy Visibility Solution**
So, the legacy visibility solutions only work for unencrypted or clear text protocols such as HTTP. In addition, DPI requires a decryption proxy, or middlebox, to be deployed for encrypted traffic. Middleboxes can be costly, introduce performance bottlenecks, and create additional security concerns.
**Legacy: Unencrypted Traffic**
Previously, security practitioners would apply DPI techniques to unencrypted HTTP traffic to identify critical session details such as browser user agent, presence of a network cookie, or parameters of an HTTP POST. However, as web traffic moves from HTTP to encrypted HTTPS, network defenders are losing visibility into those details.
Good visibility and security posture
We need to leverage your network monitoring infrastructure effectively for better security and application performance monitoring to be more effective, especially in the world of SD-WAN. However, this comes with challenges with collecting and storing standard telemetry and the ability to view encrypted traffic.
The network teams spend a lot of time on security incidents, and sometimes, the security team has to look after network issues. So, both of these teams work together. For example, packet analysis needs to be leveraged by both teams and flow control and other telemetry data need to be analyzed by the two teams.
The role of a common platform:
It’s good that other network and security teams can work off a common platform and standard telemetry. A network monitoring system can plug into your SD-WAN controller to help operationalize your SD-WAN environments. Many application performance problems arise from security issues. So, you need to know your applications and examine encrypted traffic without decrypting.
Network performance monitoring and diagnostics:
We have Flow, SNMP, and API for network performance monitoring and diagnostics. We have encrypted traffic analysis and machine learning (ML) for threat and risk identification for security teams. This will help you reduce complexity and will increase efficiency and emerge. So we have many things, such as secure access service edge (SASE) SD-WAN, and the network and security teams are under pressure to respond better.
Merging of network and security:
The market is moving towards the merging of network and security teams. We see this with cloud, SD-WAN, and also SASE. So, with the cloud, for example, we have a lot of security built into the fabric. With VPC, we have security group policies built into the fabric. SD-WAN, we have end-to-end segmentation commonly based on an overlay technology. That can also be terminal on a virtual private cloud (VPC). Then, SASE is a combination of all.
Enhanced Detection:
We need to improve monitoring, investigation capabilities, and detection. This is where the zero trust architecture and technologies such as single packet authorization can help you monitor and enhance detection with the deduction and response solutions.
In addition, we must look at network logging and encrypted traffic analyses to improve investigation capabilities. Regarding investment, we have traditionally looked at packets and logs but have SNMP, NetFlow, and API. There are a lot of telemetries that can be used for security, viewed initially as performance monitoring. Now, it has been managed as a security and cybersecurity use case.
**The need for a baseline**
You need to understand and baseline the current network for smooth SD-WAN rollouts. Also, when it comes to policy, it is no longer just a primary backup link and a backup design. Now, we have intelligence application profiling.
Everything is based on performance parameters such as loss, latency, and jitter. So, before you start any of this, you must have good visibility and observability. You need to understand your network and get a baseline for policy creation, and getting the proper visibility is the first step in planning the SD-WAN rollout process.
Network monitoring platform
For traditional networks, they will be SNMP, Flow data, and a lot of multi-vendor equipment. You need to monitor and understand how applications are used across the environment, and not everyone uses the same vendor for everything. For this, you need a network monitoring platform, which can easily be scaled to perform baseline and complete reporting and take into all multi-vendor networks. To deploy SD-WAN, you need a network monitoring platform to collect multiple telemetries, be multi-vendor, and scale.
Variety of telemetry
Consuming packets, decoding this to IPFIX, and bringing API-based data is critical. So, you need to be able to consume all of this data. Visibility is key when you are rolling out SD-WAN. You first need to baseline to see what is expected. This will let you know if SD-WAN will make a difference and what type of difference it will make at each site. So, with SD-WAN, you can deploy application-aware policies that are site-specific or region-specific, but you first need a baseline to tell you what policies you need at each site.
QoS visibility
With a network monitoring platform, you can get visibility into QoS. This can be done by using advanced flow technologies to see the marking. For example, in the case of VOIP, the traffic should be marked as expedited forwarding (EF). Also, we need to be visible in the queueing, and shaping is also critical. You can assume that the user phones automatically market the traffic as EF.
Still, a misconfiguration at one of the switches in the data path could be remarking this to best efforts. Once you have all this data, you must collect and store it. The monitoring platform must scale, especially for global customers, and collect information for large environments. Flow can be challenging. What if you have 100,000 flow records per second?
WAN capacity planning
When you have a baseline, you need to understand WAN capacity planning for each service provider. This will allow you to re-evaluate your service provider’s needs. In the long run, this will save costs. In addition, we can use WAN capacity planning to let you know each site is reaching your limit.
WAN capacity planning is not just about reports. Now, we are looking extensively at the data to draw value. Here, we can see the introduction of artificial intelligence for IT operations (AIOps) and machine learning to help predict WAN capacity and future problems. This will give you a long-term prediction when deciding on WAN bandwidth and service provider needs.
Advice: Get to know your sites and POC.
You also need to know the sites. A network monitoring platform will allow you to look at sites and understand bandwidth usage across your service providers, enabling you to identify your critical sites. You will want various sites and a cross-section of other sites on satellite connection or LTE, especially with retail. So, look for varying sites and learn about problematic sites where your users have problems with applications that are good candidates for proof of concept.
Advice: Decide on Proof of Concept
Your network performance management software will give you visibility into what sites to include in your proof of concept. This platform will tell you what sites are critical and which are problematic in terms of performance and would be a good mix for a proof of concept. When you get inappropriate sites in the mix, you will immediately see the return on investment (ROI) for SD-WAN. So uptime will increase, and you will see this immediately. But for this to be in effect, you first need a baseline.
Identity your applications: Everything is port 80
So, we have latency, jitter, and loss. Understanding when loss happens is apparent. However, with specific applications, with 1 – 5 % packet loss, there may not be a failover, which can negatively affect the applications. Also, many don’t know what applications are running. What about people connecting to the VPN with no split tunnel and then streaming movies? We have IP and ports to identity applications running on your network, but everything is port 80 now. So, you need to be able to consume different types of telemetry from the network to understand your applications fully.
The issues with deep packet inspection
So, what about the homegrown applications that a DPI engine might not know about? Many DPI vendors will have trouble identifying these. It would help if you had the network monitoring platform to categorize and identify applications based on several parameters that DPI can’t. A DPI engine can classify many applications but can’t do everything. A network monitoring platform can create a custom application, let’s say, based on an IP address, port number, URL, and URI.
Requirements: Network monitoring platform
Know application routing
The network monitoring platform needs to know the application policy and routing. It needs to know when there are error threshold events as applications are routed based on intelligence policy. Once the policy is understood, you must see how the overlay application is routed. With SD-WAN, we have per segment per topology to do this based on VRF or service VPN. We can have full mesh or regions with hub and spoke. Per segment, topology verification is also needed to know that things are running correctly. To understand the application policy, what the traffic looks like, and to be able to verify brownouts.
SD-WAN multi-vendor
Due to mergers or acquisitions, you may have an environment with multiple vendors for SD-WAN. Each vendor has its secret source, too. The network monitoring platform needs to bridge the gap and monitor both sides. There may even be different business units. So, how do you leverage common infrastructure to achieve this? We first need to leverage telemetry for monitoring and analysts. This is important as if you are putting in info packet analysis; this should be leveraged by both security and network teams, reducing tool sprawl.
Overcome the common telemetry challenges.
Trying standard telemetry does come with its challenge, and every type of telemetry has its one type of challenge. Firstly, Big Data: This is a lot of volume in terms of storage size—the speed and planning of where you will do all the packet analysis. Next, we have the collection and performance side of things. How do we collect all of this data? From a Flow perspective, you can get flow from different devices. So, how do you collect from all the edge devices and then bring them into a central location?
Finally, we have cost and complexity challenges. You may have different products for different solutions. We have an NPM for network performance monitoring, an NDR, and packet captures. Other products work on the same telemetry. Some often start with packet capture and move to an NPM or NDR solution.
A final note on encrypted traffic
**SD-WAN encryption**
With SD-WAN, everything is encrypted across public transport. So, most SD-WAN vendors can meter traffic on the LAN side before it enters the SD-WAN tunnels, but many applications are encrypted end to end. You even need to identify keystrokes through encrypted sessions. How can you get fully encrypted visibility? By 2025, all traffic will be encrypted. Here, we can use a network monitoring platform to identify and analyze threats among encrypted traffic.
**Deep packet dynamics**
So, you should be able to track and classify with what’s known as deep packet dynamic, which could include, for example, byte distributions, sequence of packets, time, jitter, RTT, and interflow stats. Now, we can push this into machine learning to identify applications and any anomalies associated with encryption. This can identify threats in encrypted traffic without decrypting the traffic.
**Improving Visibility**
Deep packet dynamics improve encrypted traffic visibility while remaining scalable and causing no impediment to latency or violation of privacy. Now, we have a malware detection method and cryptographic assessment of secured network sessions that does not rely on decryption.
This can be done without having the keys or decrypting the traffic. Managing the session key for decryption is complex and can be costly computationally. It is also often incomplete. They often only support session key forwarding on Windows or Linux or not on MacOS, never mind the world of IoT.
**Encrypted traffic analytics**
Cisco’s Encrypted Traffic Analytics (ETA) uses the software Stealthwatch to compare the metadata of benign and malicious network packets to identify malicious traffic, even if it’s encrypted. This provides insight into threats in encrypted traffic without decryption. In addition, recent work on Cisco’s TLS fingerprinting can provide fine-grained details about the enterprise network’s applications, operating systems, and processes.
The issue with packet analysis is that everything is encrypted, especially with TLS1.3. The monitoring of the traffic and the WAN edge is encrypted. How do you encrypt all of this, and how do you store all of this? How do you encrypt traffic analysis? Decrypting traffic can create an exploit and potential attack surface, and you also don’t want to decrypt everything.
Summary: WAN Monitoring
In today’s digital landscape, businesses heavily rely on their networks to ensure seamless connectivity and efficient data transfer. As organizations increasingly adopt Software-Defined Wide Area Networking (SD-WAN) solutions, the need for robust monitoring becomes paramount. This blog post delved into SD-WAN monitoring, its significance, and how it empowers businesses to optimize their network performance.
Understanding SD-WAN
SD-WAN, short for Software-Defined Wide Area Networking, revolutionizes traditional networking by leveraging software-defined techniques to simplify management, enhance agility, and streamline connectivity across geographically dispersed locations. By abstracting network control from the underlying hardware, SD-WAN enables organizations to optimize bandwidth utilization, reduce costs, and improve application performance.
The Role of Monitoring in SD-WAN
Effective monitoring plays a pivotal role in ensuring the smooth operation of SD-WAN deployments. It provides real-time visibility into network performance, application traffic, and security threats. Monitoring tools enable IT teams to proactively identify bottlenecks, latency issues, or network disruptions, allowing them to address these challenges and maintain optimal network performance swiftly.
Key Benefits of SD-WAN Monitoring
Enhanced Network Performance: SD-WAN monitoring empowers organizations to monitor and analyze network traffic, identify performance bottlenecks, and optimize bandwidth allocation. This leads to improved application performance and enhanced end-user experience.
Increased Security: With SD-WAN monitoring, IT teams can monitor network traffic for potential security threats, detect anomalies, and quickly respond to attacks or breaches. Monitoring helps ensure compliance with security policies and provides valuable insights for maintaining a robust security posture.
Proactive Issue Resolution: Real-time monitoring allows IT teams to identify and resolve issues before they escalate proactively. Organizations can minimize downtime, optimize resource allocation, and ensure business continuity by leveraging comprehensive visibility into network performance and traffic patterns.
Best Practices for SD-WAN Monitoring
Choosing the Right Monitoring Solution: Select a monitoring solution that aligns with your organization’s specific needs, supports SD-WAN protocols, and provides comprehensive visibility into network traffic and performance metrics.
Monitoring Key Performance Indicators (KPIs): Define relevant KPIs such as latency, packet loss, jitter, and bandwidth utilization to track network performance effectively. Regularly monitor these KPIs to identify trends, anomalies, and areas for improvement.
4.3 Integration with Network Management Systems: Integrate SD-WAN monitoring tools with existing network management systems and IT infrastructure to streamline operations, centralize monitoring, and enable a holistic network view.
Conclusion
SD-WAN monitoring is a critical component of successful SD-WAN deployments. By providing real-time visibility, enhanced network performance, increased security, and proactive issue resolution, monitoring tools empower organizations to maximize the benefits of SD-WAN technology. As businesses continue to embrace SD-WAN solutions, investing in robust monitoring capabilities will be essential to ensuring optimal network performance and driving digital transformation.

