
Understanding Auto-Scaling Observability
1: ) Auto-scaling observability refers to a system’s ability to adjust its resources based on real-time monitoring and analysis automatically. It combines two essential components: auto-scaling, which dynamically allocates resources, and observability, which provides insights into the system’s behavior and performance.
2: ) By leveraging advanced monitoring tools and intelligent algorithms, auto-scaling observability enables organizations to optimize resource allocation and respond swiftly to changing demands.
3: ) Auto scaling observability involves the continuous monitoring and analysis of system metrics to automate the scaling of resources. This process allows organizations to automatically increase or decrease their computing power based on current demand, ensuring that applications run smoothly without over-provisioning or incurring unnecessary costs.
Auto‑Scaling Observability
Auto‑scaling observability is the ability to see, measure, and understand how your infrastructure scales up and down in real time — across containers, microservices, Kubernetes clusters, serverless functions, cloud workloads, and distributed systems. It ensures that scaling decisions are correct, efficient, cost‑optimized, and aligned with application performance and user experience.
This section is written cleanly for direct copy‑and‑paste into your architecture notes or blog.
Core Observability Signals for Auto‑Scaling
Metrics — CPU, memory, queue depth, request rate, latency, p95/p99 spikes.
Logs — scaling events, pod lifecycle logs, autoscaler decisions.
Traces — request flow timing to detect bottlenecks before scaling triggers.
Kubernetes Events — HPA/VPA decisions, pod scheduling, node pressure.
Cloud Telemetry — AWS ASG, Azure VMSS, GCP MIG scaling signals.
Application Performance — throughput, error rate, saturation, concurrency.
These signals allow you to understand why scaling happened, whether it was correct, and how it impacted performance.
What Auto‑Scaling Observability Provides
1. Visibility into Scaling Decisions
You see exactly why the system scaled:
CPU threshold exceeded
latency spike
queue backlog
memory pressure
traffic surge
degraded user experience
2. Real‑Time Performance Correlation
Scaling is correlated with:
request rate
p95/p99 latency
error bursts
cold‑start delays
pod/container startup times
3. Cost and Efficiency Insights
Observability reveals:
over‑scaling
under‑scaling
wasted compute
inefficient autoscaler thresholds
unnecessary node expansions
4. Predictive Scaling Signals
Using ML‑driven analytics:
forecast traffic
detect anomalies
pre‑scale before peak load
avoid cascading failures
Auto‑Scaling Observability in Modern Architectures
Kubernetes (HPA/VPA)
Observability tracks:
pod lifecycle
node pressure
HPA decisions
VPA recommendations
cluster autoscaler behavior
container cold‑start impact
Serverless (Lambda, Functions, Cloud Run)
Observability shows:
concurrency spikes
cold‑start latency
throttling events
function execution time
scaling bursts
Microservices
Observability correlates:
service‑to‑service latency
dependency bottlenecks
trace‑driven scaling triggers
queue depth and backpressure
Cloud Auto‑Scaling Groups
Tracks:
VM provisioning time
scaling cooldown windows
load balancer health
network saturation
Tools for Auto‑Scaling Observability
Prometheus — metrics for HPA/VPA.
Grafana — dashboards for scaling behavior.
OpenTelemetry — traces + metrics for scaling triggers.
ThousandEyes — user experience impact during scaling events.
Splunk — logs + analytics + correlation.
CloudWatch / Azure Monitor / GCP Cloud Monitoring — native cloud scaling telemetry.
Together, these tools create a complete scaling observability fabric.
Outcome
Auto‑scaling observability delivers:
predictable scaling
reduced latency during load spikes
optimized resource usage
lower cloud cost
faster incident response
improved user experience
reliable microservices and Kubernetes operations
It transforms auto‑scaling from a reactive mechanism into an intelligent, data‑driven, self‑optimizing system.
Auto-Scaling – Key Points:
– Enhanced Scalability and Performance: Auto-scaling observability allows systems to scale resources up or down based on actual usage patterns. This ensures that the system can handle peak loads efficiently without overprovisioning resources during periods of low demand. Organizations can avoid costly downtime by dynamically adjusting resources and ensuring optimal performance during sudden traffic spikes.
– Cost Optimization: With auto-scaling observability, businesses can significantly reduce infrastructure costs. Organizations can avoid unnecessary idle resource expenditures by accurately provisioning resources based on real-time data. This cost optimization approach ensures that companies only pay for the resources required, resulting in considerable savings.
– Improved Fault Tolerance: Auto-scaling observability is crucial in enhancing system resilience. Organizations can promptly identify and address potential issues by continuously monitoring the system’s health. In case of anomalies or failures, the system can automatically scale resources or trigger alerts for immediate remediation. This proactive approach minimizes the impact of failures and enhances the system’s overall fault tolerance.
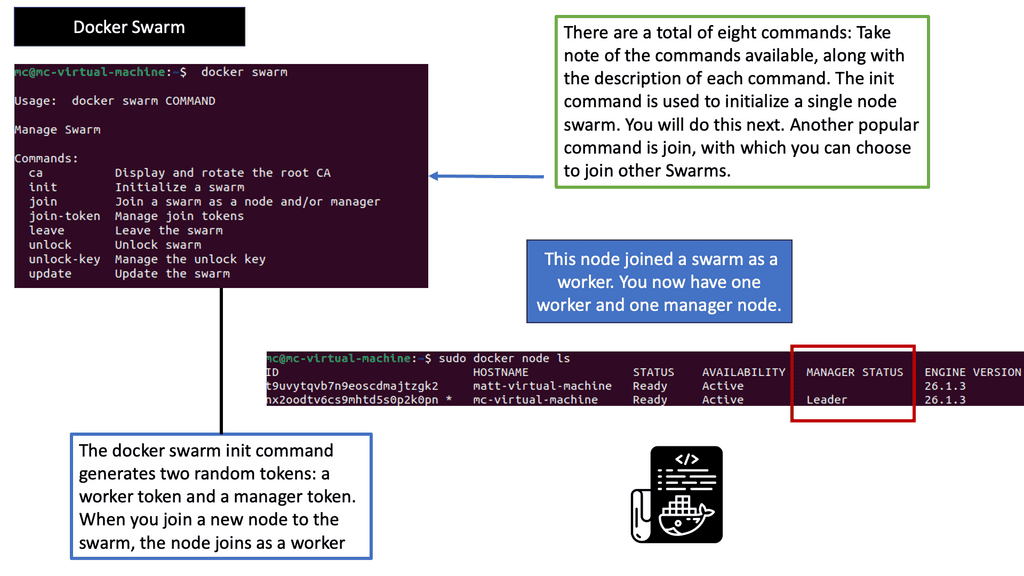
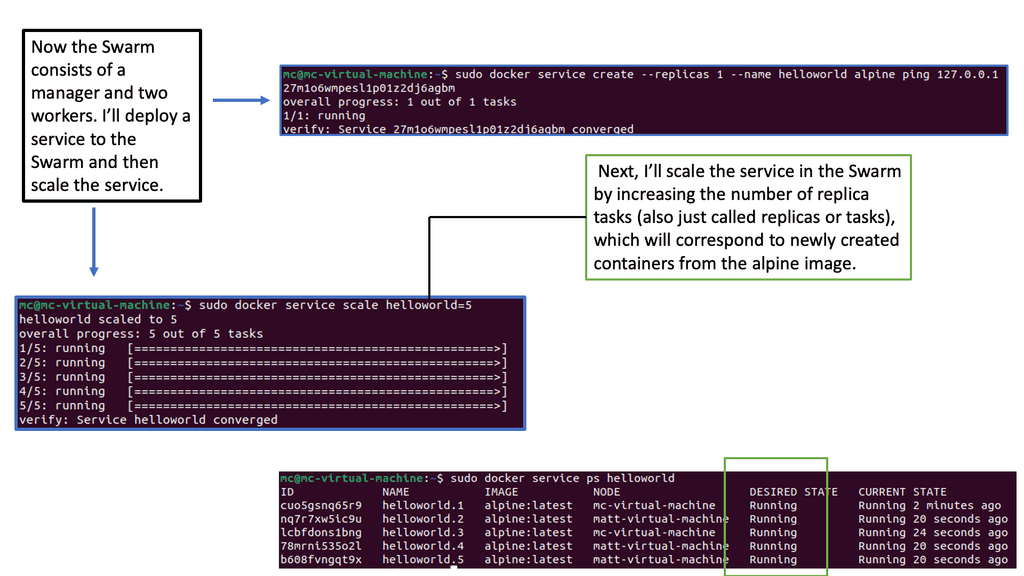
Auto-scaling Example: Scaling with Docker Swarm
Auto Scaling – Key Components:
To fully harness the power of auto scaling observability, it’s important to understand its key components. These include metrics collection, alerting, and automated responses. Let’s delve deeper into each of these elements:
1. **Metrics Collection:** Gathering data from various sources is the foundation of observability. This involves collecting CPU usage, memory utilization, network traffic, and other vital metrics. With comprehensive data, organizations can better understand their infrastructure’s behavior and make informed scaling decisions.
2. **Alerting:** Once data is collected, it’s essential to set up alerts for any anomalies or thresholds that are breached. Alerting enables teams to respond swiftly to potential issues, minimizing downtime and maintaining application performance.
3. **Automated Responses:** The ultimate goal of observability is to automate responses to fluctuating demands. By employing pre-defined rules and machine learning algorithms, businesses can ensure that resources are scaled up or down automatically, optimizing both performance and cost.
**The Role of the Metric**
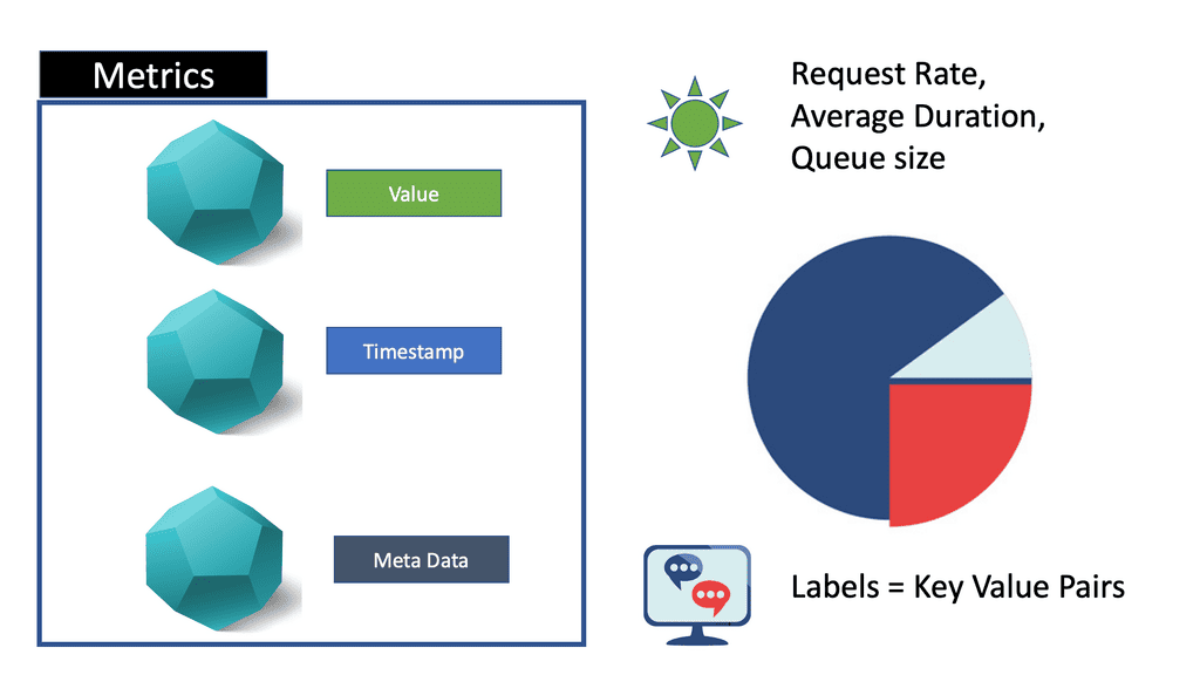
“What Is a Metric: Good for Known” Regarding auto-scaling observability and metrics, one must understand the metric’s downfall. A metric is a single number, with tags optionally appended for grouping and searching those numbers. They are disposable and cheap and have a predictable storage footprint.
A metric is a numerical representation of a system state over a recorded time interval. It can tell you if a particular resource is over or underutilized at a specific moment. For example, CPU utilization might be at 75% right now.
Implementing Auto-Scaling Observability
Choosing the Right Monitoring Tools: To effectively implement auto-scaling observability, organizations must select appropriate monitoring tools that provide real-time insights into system performance, resource utilization, and user behavior. These tools should offer robust analytics capabilities and seamless integration with auto-scaling platforms.
Defining Metrics and Thresholds: Accurate metrics and thresholds are critical for successful auto-scaling observability. Organizations must identify key performance indicators (KPIs) that align with their business objectives and set appropriate thresholds for scaling actions. For example, CPU utilization, response time, and error rates are standard metrics for auto-scaling decisions.
Automating Scaling Actions: Organizations should automate scaling actions based on predefined rules to fully leverage the benefits of auto-scaling observability. By integrating monitoring tools, auto-scaling platforms, and orchestration frameworks, businesses can ensure that resource allocation adjustments are performed seamlessly and without human intervention.
Service Mesh & Auto-Scaling
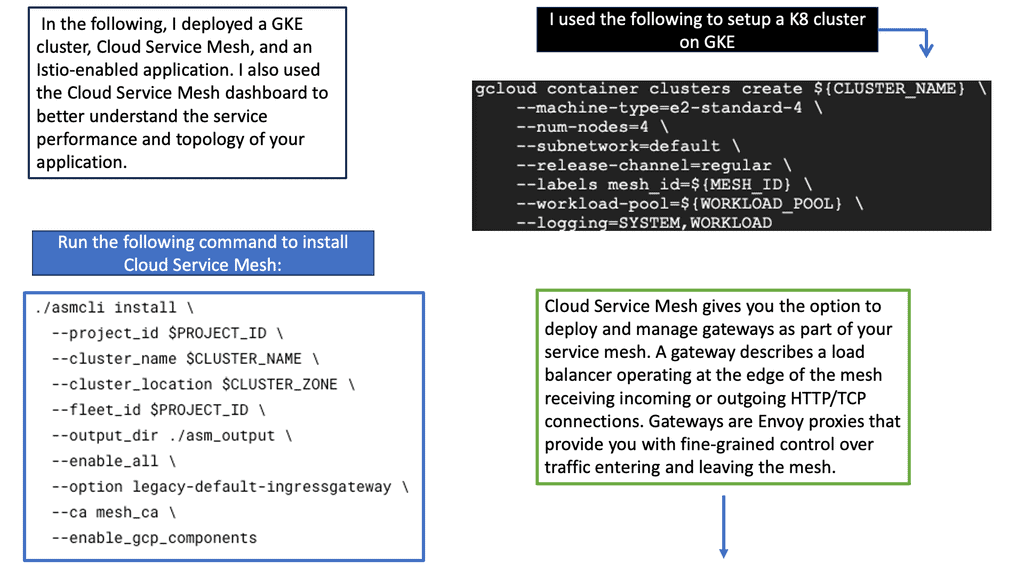
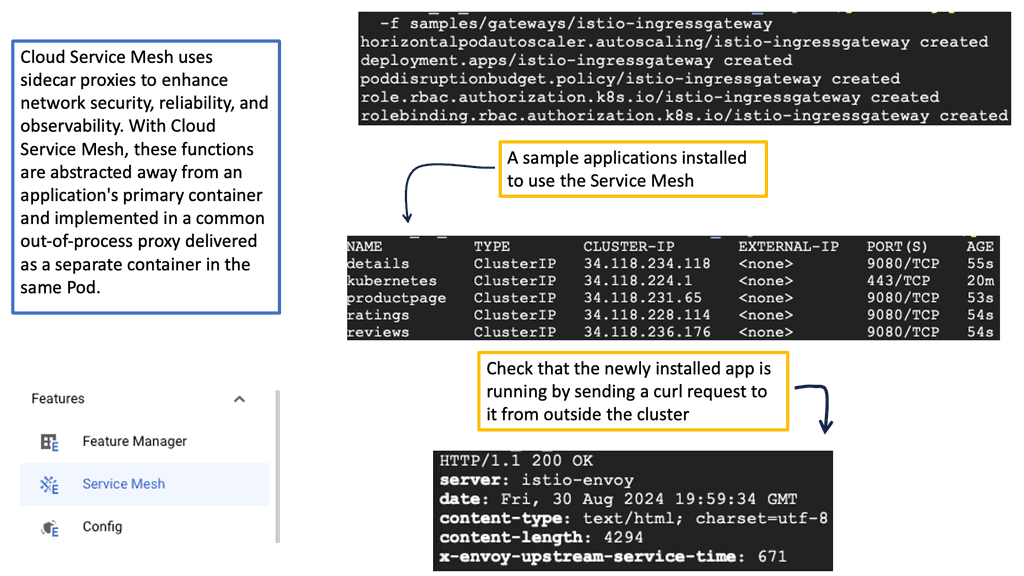
Service mesh acts as a dedicated infrastructure layer for managing service-to-service communications. It provides a suite of capabilities, including traffic management, security, and, most importantly, observability. By integrating a service mesh, such as Istio or Linkerd, into your auto scaling environment, you gain granular visibility into your microservices architecture. This includes detailed metrics, tracing, and logging, enabling you to monitor traffic patterns, latency, and error rates with precision.
### Implementing Service Mesh for Optimal Observability
Deploying a service mesh involves several considerations to maximize its observability benefits. Start by identifying the microservices that will benefit most from enhanced observability. Next, configure the service mesh to collect and process telemetry data effectively. Ensure your observability stack—comprising metrics, logs, and traces—is equipped to handle the data influx. Finally, leverage the insights gained to optimize your auto scaling strategy, ensuring minimal downtime and optimal performance.
### What is a Cloud Service Mesh?
A cloud service mesh is a dedicated infrastructure layer that manages service-to-service communication within a distributed application. It decouples the networking logic from the application code, enabling developers to focus on core functionality without worrying about the complexities of inter-service communication. Service meshes provide features like load balancing, service discovery, and security policies, making them indispensable for modern cloud-native applications.
### Key Benefits of Service Mesh
#### Simplified Networking
One of the primary benefits of a service mesh is the simplification of networking within a microservices architecture. By abstracting the communication logic, service meshes make it easier to manage and scale applications. Developers can implement features like retries, timeouts, and circuit breakers without modifying their application code.
#### Enhanced Security
Service meshes provide robust security features, including mutual TLS (mTLS) for service-to-service encryption and authentication. This ensures that communication between services is secure by default, reducing the risk of data breaches and unauthorized access.
#### Traffic Management
With a service mesh, you can intelligently route traffic between services based on various criteria such as load, service version, or geographic location. This level of control enables canary deployments, blue-green deployments, and A/B testing, making it easier to roll out new features with minimal risk.
### The Role of Observability
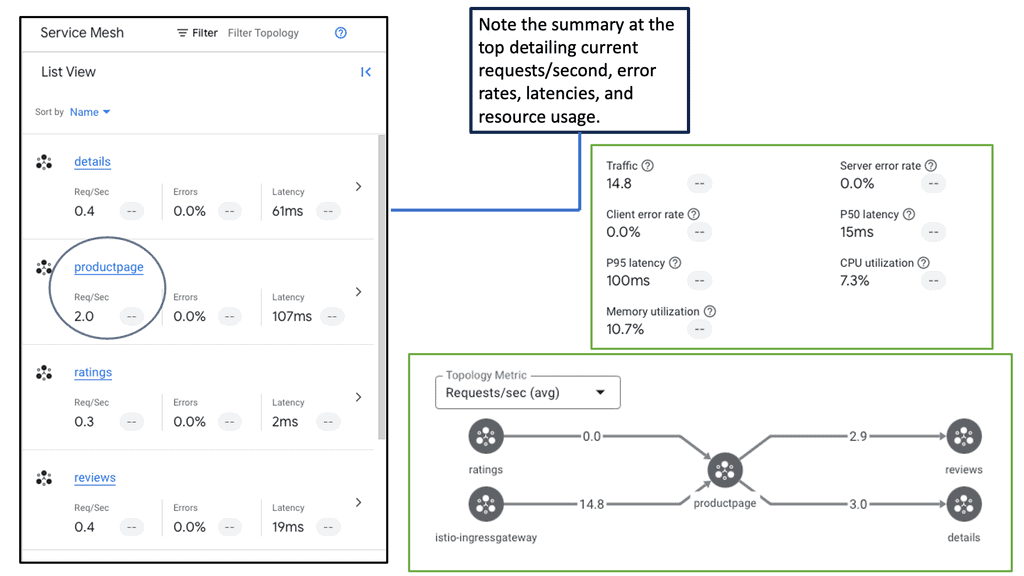
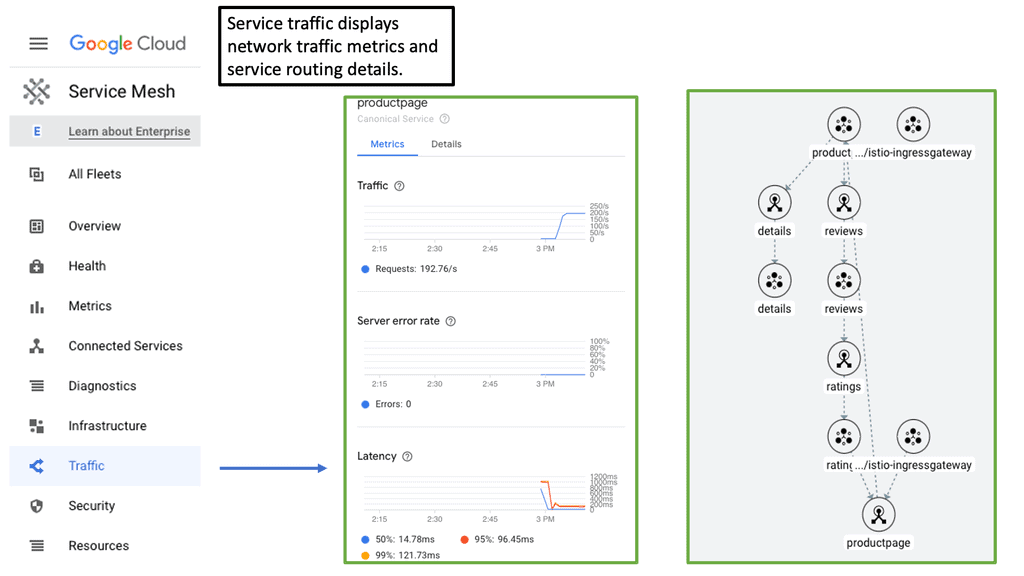
Observability is the ability to measure the internal states of a system based on the outputs it produces. In the context of a service mesh, observability involves collecting and analyzing metrics, logs, and traces to gain insight into the performance and behavior of the services.
### Why Observability Matters
Without proper observability, managing a service mesh can become a daunting task. Observability allows you to monitor the health of your services, detect anomalies, and troubleshoot issues in real-time. It provides the visibility needed to ensure that your service mesh is functioning as intended and that any problems are quickly identified and resolved.
### Tools and Techniques
Several tools can enhance observability in a service mesh, such as Prometheus for metrics, Jaeger for tracing, and Fluentd for logging. Combining these tools provides a comprehensive view of your service mesh’s performance and health, enabling proactive maintenance and quicker issue resolution.
Gaining Visibility with Google Ops Agent
**The Role of Google Ops Agent in Observability**
Google Ops Agent is a unified agent that simplifies the process of collecting telemetry data from your cloud environment. Its ability to seamlessly integrate with Google Cloud’s operations suite makes it an essential tool for businesses looking to enhance their auto-scaling observability. By providing detailed insights into CPU usage, memory utilization, and network traffic, Google Ops Agent ensures that your infrastructure is both monitored and optimized in real-time.
**Benefits of Enhanced Observability**
With Google Ops Agent in place, businesses gain a clearer picture of how their auto-scaling systems are functioning. This enhanced observability translates to several benefits: improved system reliability, faster troubleshooting, and better resource allocation. By actively monitoring metrics and logs, organizations can preemptively address issues before they escalate into significant problems. Furthermore, insights derived from this data can inform future scaling strategies and infrastructure investments.
**Example: Understanding Ops Agent**
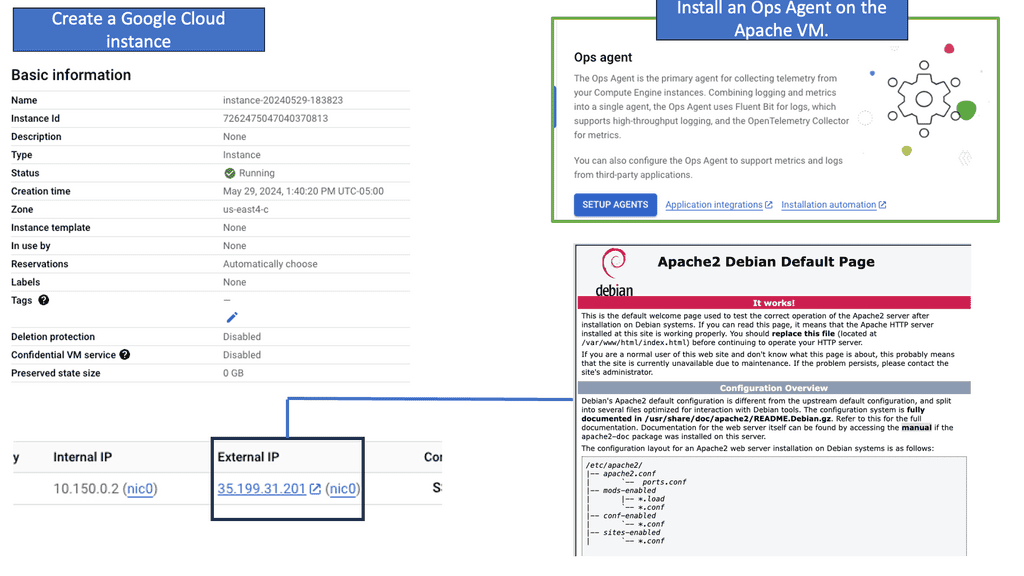
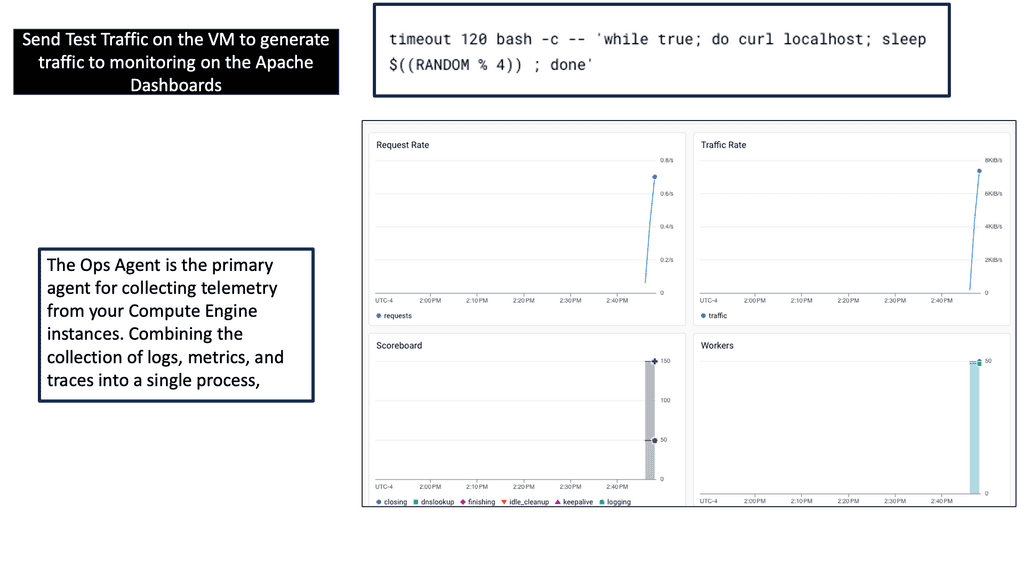
Ops Agent is a lightweight and efficient monitoring agent developed by Google Cloud. It enables you to collect crucial metrics and logs from your Compute Engine instances, providing valuable insights into their performance and health. By leveraging Ops Agent, you can proactively detect issues, troubleshoot problems, and optimize the utilization of your instances.
To begin monitoring your Compute Engine instances with Ops Agent, install it on your virtual machines. The installation process is straightforward and can be done using package managers like apt or yum. Once installed, Ops Agent seamlessly integrates with Google Cloud Monitoring, allowing you to access and analyze the gathered data.
After installing Ops Agent, it is essential to configure the monitoring metrics that you want to collect. Ops Agent supports many metrics, including CPU usage, memory utilization, disk I/O, and network traffic. By tailoring the metrics collection to your specific needs, you can efficiently monitor the performance of your Compute Engine instances and identify any anomalies or bottlenecks.
What is GKE-Native Monitoring?
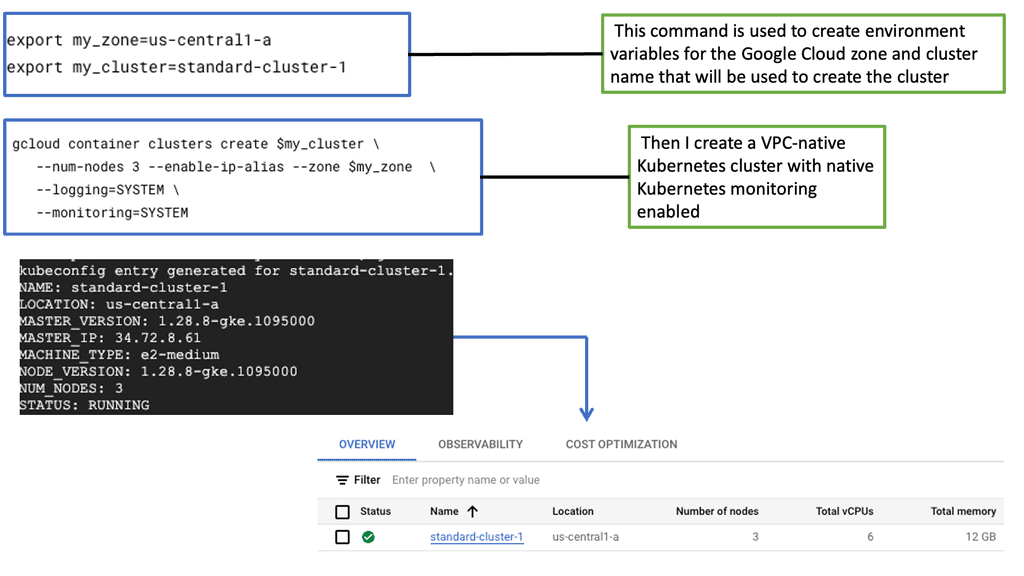
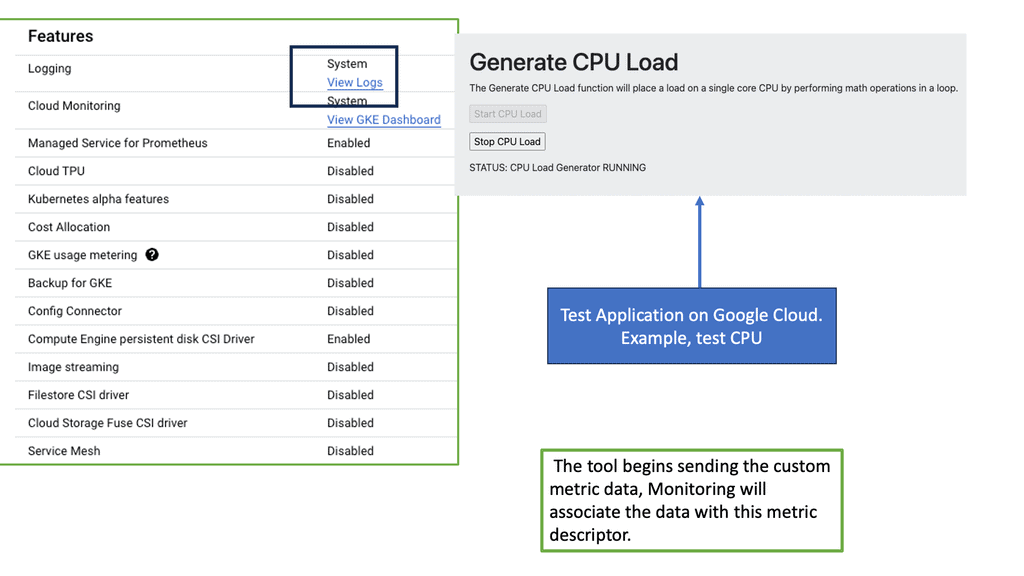
GKE-Native Monitoring is a powerful monitoring solution provided by Google Cloud Platform (GCP) designed explicitly for GKE clusters. It leverages the capabilities of Prometheus and Stackdriver, offering a unified monitoring experience within the GCP ecosystem. With GKE-Native Monitoring, users can effortlessly collect, visualize, and analyze metrics and logs related to their GKE clusters, enabling them to make data-driven decisions and proactively address any issues that may arise.
GKE-Native Monitoring offers a range of features that enhance observability and simplify monitoring workflows. Some notable features include:
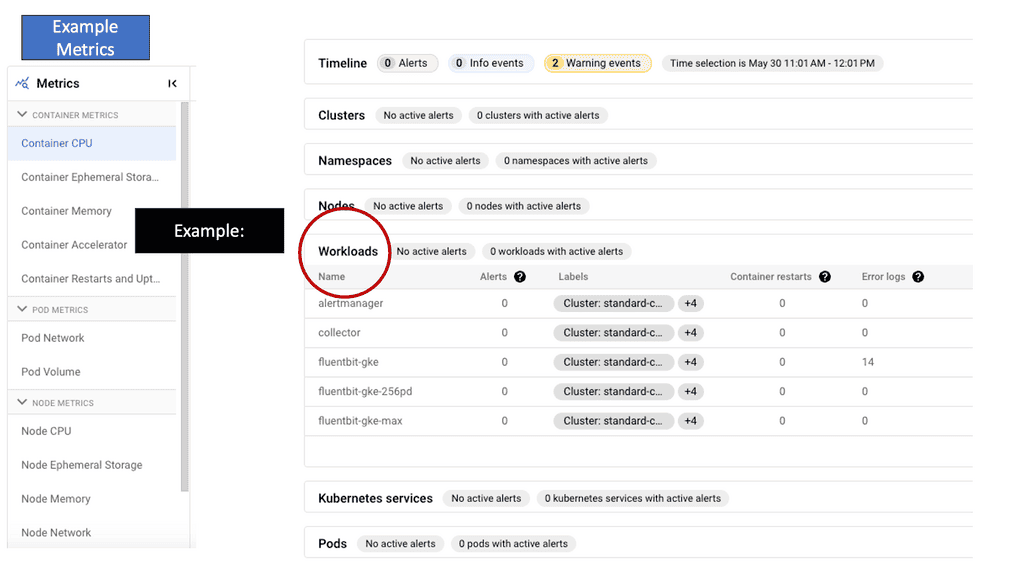
1. Automatic Metric Collection: GKE-Native Monitoring automatically collects a rich set of metrics from every GKE cluster, including CPU and memory utilization, network traffic, and application-specific metrics. This eliminates the need for manual configuration and ensures comprehensive monitoring that is out of the box.
2. Custom Metrics and Alerts: Users can define custom metrics and alerts tailored to their applications and business requirements. This empowers them to monitor critical aspects of their clusters and receive notifications when predefined thresholds are crossed, enabling timely actions and proactive troubleshooting.
3. Integration with Stackdriver Logging: GKE-Native Monitoring integrates with Stackdriver Logging, allowing users to correlate log data with metrics. By combining logs and metrics, users can gain a holistic view of their application’s behavior and quickly identify the root causes of any issues.
Kubernetes Autoscaling
Kubernetes auto scaling involves dynamically adjusting the number of running pods in a cluster based on current demand. This ensures that applications remain responsive while optimizing resource utilization. With the right configuration, auto scaling can help maintain performance during traffic spikes and reduce costs during low-traffic periods.
**Benefits of Implementing Auto Scaling**
The implementation of Kubernetes auto scaling brings a multitude of benefits to organizations. Firstly, it enhances resource efficiency by ensuring that applications use only the necessary resources, reducing wastage and lowering operational costs. Secondly, it improves application performance and reliability by adapting to traffic fluctuations, ensuring a consistent user experience even during peak demand. Moreover, auto scaling supports rapid scaling for new deployments, enabling businesses to respond swiftly to market changes without manual intervention.
**Challenges and Best Practices**
While Kubernetes auto scaling offers significant advantages, it also presents challenges that organizations need to navigate. One common issue is configuring the right scaling metrics and thresholds to avoid over-provisioning or under-provisioning resources. It’s crucial to thoroughly test and monitor these settings in a staging environment before deploying them to production. Additionally, consider using custom metrics that align closely with your application’s performance indicators for more accurate scaling decisions. Regularly reviewing and updating your scaling policies ensures they remain effective as application workloads evolve.
### Types of Auto Scaling in Kubernetes
Kubernetes offers several types of auto scaling, each designed to address different aspects of resource management. The most commonly used are Horizontal Pod Autoscaler (HPA), Vertical Pod Autoscaler (VPA), and Cluster Autoscaler.
1. **Horizontal Pod Autoscaler (HPA):** HPA adjusts the number of pod replicas in a deployment or replication controller based on observed CPU utilization or other select metrics. It’s ideal for applications with varying workloads, ensuring that resources are available when needed and conserved when demand is low.
2. **Vertical Pod Autoscaler (VPA):** VPA automatically adjusts the CPU and memory requests and limits for containers within pods. This ensures that each pod has the right amount of resources, preventing over-provisioning and under-provisioning.
3. **Cluster Autoscaler:** This tool automatically adjusts the size of the Kubernetes cluster so that all pods have a place to run. It adds nodes when pods are unschedulable due to resource shortages and removes nodes when they’re underutilized.
### Configuring Auto Scaling in Kubernetes
To leverage Kubernetes auto scaling effectively, you’ll need to configure it to meet your application’s specific needs. The process typically involves setting up metrics and thresholds that trigger scaling actions.
For HPA, you’ll define the target CPU utilization or other custom metrics that the autoscaler should monitor. VPA requires setting up recommendations for resource requests and limits. Finally, the Cluster Autoscaler needs to be linked with your cloud provider to manage node scaling efficiently.
It’s crucial to regularly monitor and adjust these configurations to ensure optimal performance, as application demands can evolve over time.
### Best Practices for Kubernetes Auto Scaling
Implementing auto scaling in Kubernetes is not a set-it-and-forget-it task. Here are some best practices to consider:
– **Understand Your Workloads:** Analyze your application’s workload patterns to choose the right type of auto scaling and set appropriate thresholds.
– **Use Custom Metrics:** While CPU and memory are common metrics, consider using application-specific metrics to drive more accurate scaling decisions.
– **Test and Monitor:** Regularly test your auto scaling configurations in a non-production environment. Continuous monitoring and logging are essential to catch and resolve issues early.
You can dynamically scale up or down any architecture component through autoscaling.
An example of a good use of autoscaling is as follows:
You may need additional web servers to handle the surge in traffic at the end of the day when your website’s load increases. Where does the rest of the day fit in? Your servers can’t sit idle during most business hours. Especially if you’re using a cloud provider, you want to optimize your environment’s potential costs. An autoscale allows you to increase the number of components during a spike and scale down during a regular period.
Example: Prometheus Pull Approach
There can be many tools to gather metrics, such as Prometheus, along with several techniques used to collect these metrics, such as the PUSH and PULL approaches. There are pros and cons to each method. However, Prometheus metric types and its PULL approach are prevalent in the market. However, if you want full observability and controllability, remember it is solely in metrics-based monitoring solutions. For additional information on Monitoring and Observability and their difference, visit this post on observability vs monitoring.
These autoscalers rely on Kubernetes’ metric server for scaling up or down k8s objects.
Adopting Auto-scaling
Autoscaling is a mechanism that automatically adjusts the number of computing resources allocated to an application based on its demand. By dynamically scaling resources up or down, autoscaling enables organizations to handle fluctuating workloads efficiently. However, robust observability is crucial to harness the power of autoscaling truly.
The Role of Observability in Autoscaling
Observability is the ability to gain insights into a system’s internal state based on its external outputs. It plays a pivotal role in understanding the system’s behavior, identifying bottlenecks, and making informed scaling decisions regarding autoscaling. It provides visibility into key metrics like CPU utilization, memory usage, and network traffic. With observability, you can make data-driven decisions and ensure optimal resource allocation.
Monitoring and Metrics
To achieve effective autoscaling observability, comprehensive monitoring is essential. Monitoring tools collect various metrics, such as response times, error rates, and resource utilization, to provide a holistic view of your infrastructure. These metrics can be analyzed to identify patterns, detect anomalies, and trigger autoscaling actions when necessary. You can proactively address performance issues and optimize resource utilization by monitoring and analyzing metrics.
Logging and Tracing
In addition to monitoring, logging, and tracing are critical components of autoscaling observability. Logging captures detailed information about system events, errors, and activities, enabling you to troubleshoot issues and gain insights into system behavior. Tracing helps you understand the flow of requests across different services. Logging and tracing provide a granular view of your application’s performance, aiding in autoscaling decisions and ensuring smooth operation.
Automation and Alerting
Automation and alerting mechanisms are vital to mastering autoscaling observability. You can configure thresholds and triggers that initiate autoscaling actions based on predefined conditions by setting up automated processes. This allows for proactive scaling, ensuring your system is constantly optimized for performance. Additionally, timely alerts can notify you of critical events or anomalies, enabling you to take immediate action and maintain the desired scalability.
Autoscaling observability is the key to unlocking its true potential. By understanding your system’s behavior through comprehensive monitoring, logging, and tracing, you can make informed decisions and ensure optimal resource allocation. With automation and alerting mechanisms, you can proactively respond to changing demands and maintain high efficiency. Embrace autoscaling observability and take your infrastructure management to new heights.
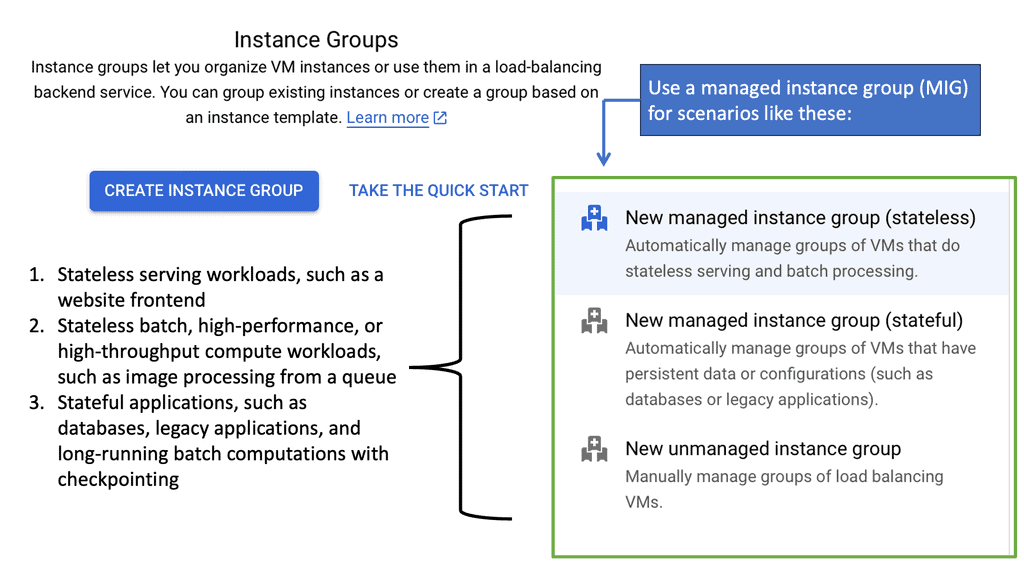
Managed Instance Groups
### Auto Scaling: Adapting to Your Needs
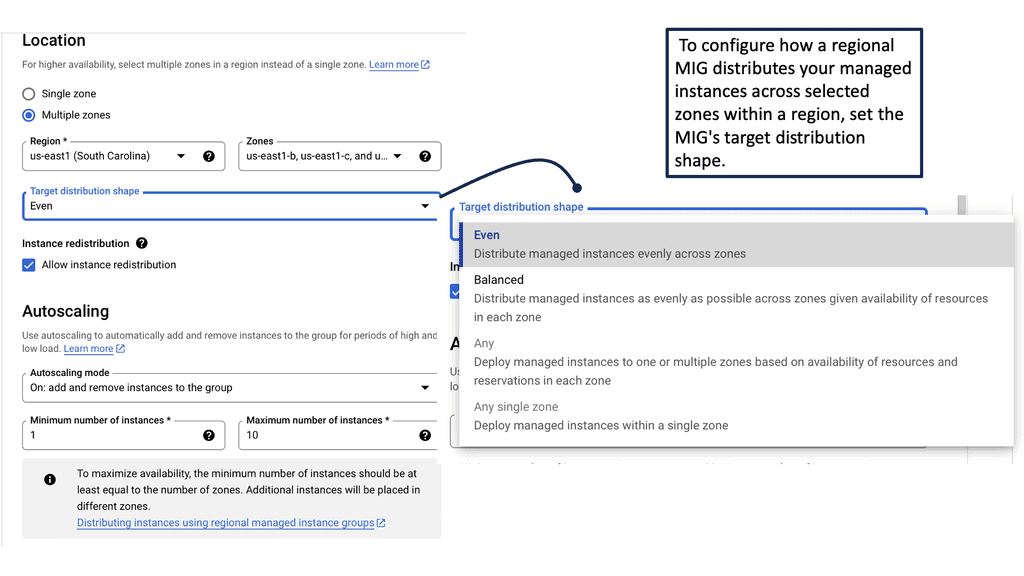
One of the standout features of managed instance groups is auto scaling. With auto scaling, your infrastructure can dynamically adjust to the current demand. This ensures that your applications have the necessary resources without overspending. By setting up policies based on CPU usage, requests per second, or custom metrics, MIGs can efficiently allocate resources, keeping your applications responsive and your costs under control.
—
### Observability: Keeping a Close Watch
Observability is key in maintaining the health of your cloud infrastructure. Google Cloud’s managed instance groups provide comprehensive monitoring tools that give you insights into the performance and stability of your instances. By leveraging metrics, logs, and traces, you can detect anomalies, optimize performance, and ensure your applications run smoothly. This proactive approach to monitoring allows you to address potential issues before they impact your services.
—
### Integration with Google Cloud
Managed instance groups seamlessly integrate with various Google Cloud services, enhancing their utility and flexibility. From load balancing to deploying containerized applications with Google Kubernetes Engine, MIGs work in tandem with Google’s ecosystem to provide a cohesive and powerful cloud solution. This integration not only simplifies management but also boosts the scalability and reliability of your applications.
Understanding Autoscaling
-Before we discuss observability, let’s briefly explore the concept of autoscaling. Autoscaling refers to the ability of an application or infrastructure to automatically adjust its resources based on demand. It enables organizations to handle fluctuating workloads and optimize resource allocation efficiently.
-Observability, in the context of autoscaling, refers to gaining insights into an autoscaling system’s performance, health, and efficiency. It involves collecting, analyzing, and visualizing relevant data to understand the application and infrastructure’s behavior and patterns.
-Through observability, organizations can make informed decisions to optimize autoscaling algorithms, resource allocation, and overall system performance. To achieve effective autoscaling observability, several critical components come into play. These include:
A. Metrics and Monitoring: Gathering and monitoring key metrics such as CPU utilization, response times, request rates, and error rates is fundamental for understanding the application and infrastructure’s performance.
B. Logging and Tracing: Logging captures detailed information about events and transactions within the system, while tracing provides insights into the flow of requests across various components. Both logging and tracing contribute to a comprehensive understanding of system behavior.
C. Alerting and Thresholds: Setting up appropriate alerts and thresholds based on predefined criteria ensures timely notifications when specific conditions are met.
Tools and Technologies for Autoscaling Observability
A wide range of tools and technologies are available to facilitate autoscaling observability. Prominent examples include Prometheus, Grafana, Elasticsearch, Kibana, and CloudWatch. These tools provide robust monitoring, visualization, and analysis capabilities, enabling organizations to gain deep insights into their autoscaling systems.
The first component of observability is the channels that convey observations to the observer. There are three channels: logs, traces, and metrics. These channels are common to all areas of observability, including data observability.
1.Logs: Logs are the most typical channel and take several forms (e.g., a line of free text or JSON). They are intended to encapsulate information about an event.
2.Traces: Traces allow you to do what logs don’t—reconnect the dots of a process. Because traces represent the link between all events of the same process, they allow the whole context to be derived from logs efficiently. Each pair of events, an operation, is a span that can be distributed across multiple servers.
3.Metrics: Finally, we have metrics. Every system state has some component that can be represented with numbers, and these numbers change as the state changes.
Understanding VPC Flow Logs
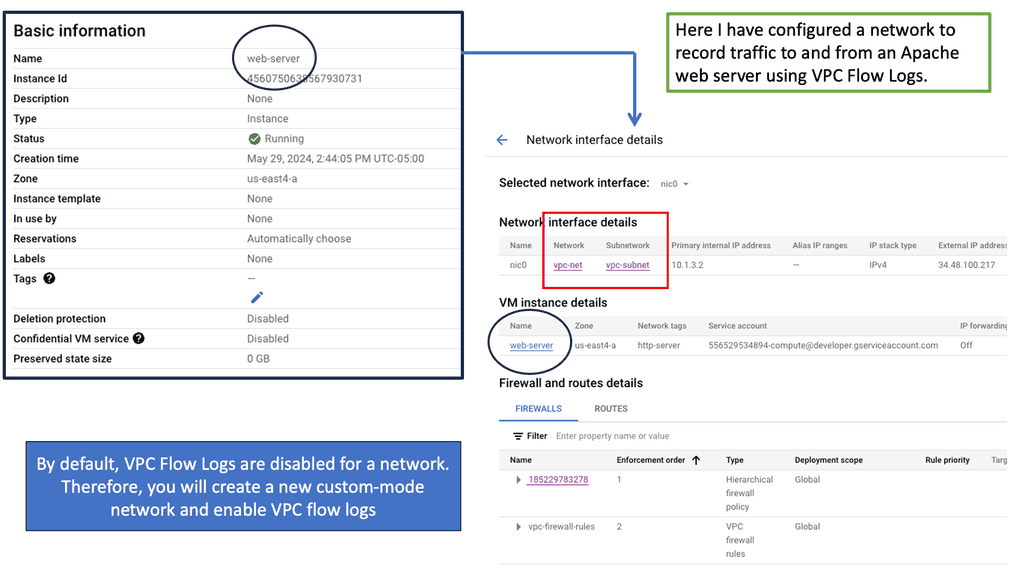
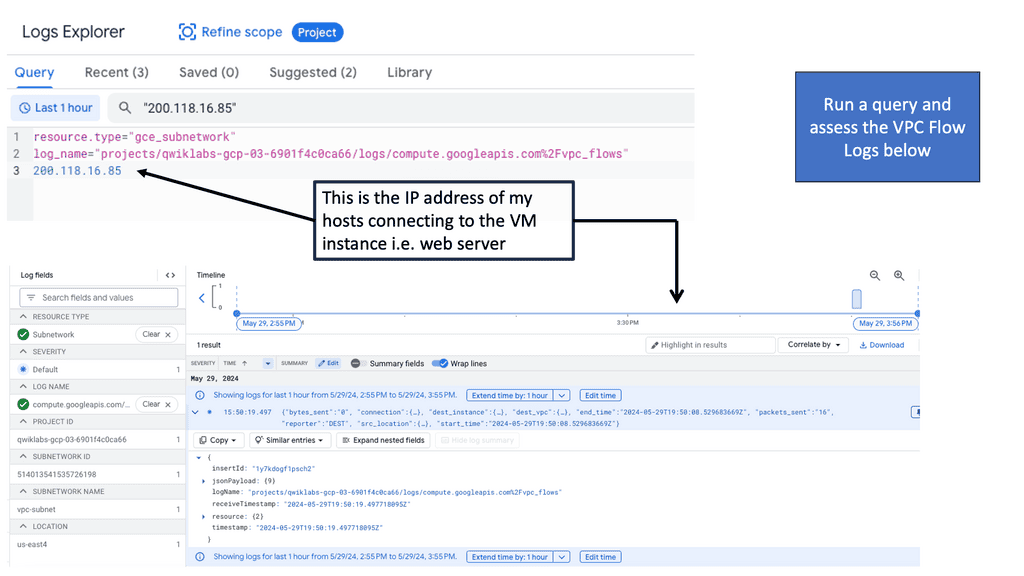
VPC Flow Logs capture information about the IP traffic going in and out of Virtual Private Clouds (VPCs) within Google Cloud. Enabling VPC Flow Logs allows you to gain visibility into network traffic at the subnet level, thereby facilitating network troubleshooting, security analysis, and performance monitoring.
Once the VPC Flow Logs are enabled and data starts flowing in, it’s time to tap into the potential of Google Cloud Logging. Using the appropriate filters and queries, you can sift through the vast amount of log data and extract meaningful insights. Whether it’s identifying suspicious traffic patterns, monitoring network performance metrics, or investigating security incidents, Google Cloud Logging provides a robust set of tools to facilitate these analyses.
Auto Scaling Observability
**Metrics: Resource Utilization Only**
– Metrics help us understand resource utilization. In a Kubernetes environment, these metrics are used for auto-healing and auto-scheduling. Monitoring performs several functions when it comes to metrics. First, it can collect, aggregate, and analyze metrics to identify known patterns that indicate troubling trends.
– The critical point here is that it shifts through known patterns. Then, based on a known event, metrics trigger alerts that notify when further investigation is needed. Finally, we have dashboards that display the metrics data trends adapted for visual consumption.
– These monitoring systems work well for identifying previously encountered known failures but don’t help as much for the unknown. Unknown failures are the norm today with disgruntled systems and complex system interactions.
– Metrics are suitable for dashboards, but there won’t be a predefined dashboard for unknowns, as it can’t track something it does not know about. Using metrics and dashboards like this is a reactive approach, yet it’s widely accepted as the norm. Monitoring is a reactive approach best suited for detecting known problems and previously identified patterns.
**Metrics and intermittent problems**
– The metrics can help you determine whether a microservice is healthy or unhealthy within a microservices environment. Still, a metric will have difficulty telling you if a microservices function takes a long time to complete or if there is an intermittent problem with an upstream or downstream dependency. So, we need different tools to gather this type of information.
– We have an issue with auto-scaling metrics because they only look at individual microservices with a given set of attributes. So, they don’t give you a holistic view of the problem. For example, the application stack now exists in numerous locations and location types; we need a holistic viewpoint.
– A metric does not give this. For example, metrics track simplistic system states that indicate a service is running poorly or may be a leading indicator or an early warning signal. However, while those measures are easy to collect, they don’t turn out to be proper measures for triggering alerts.
Latency & Cloud Trace
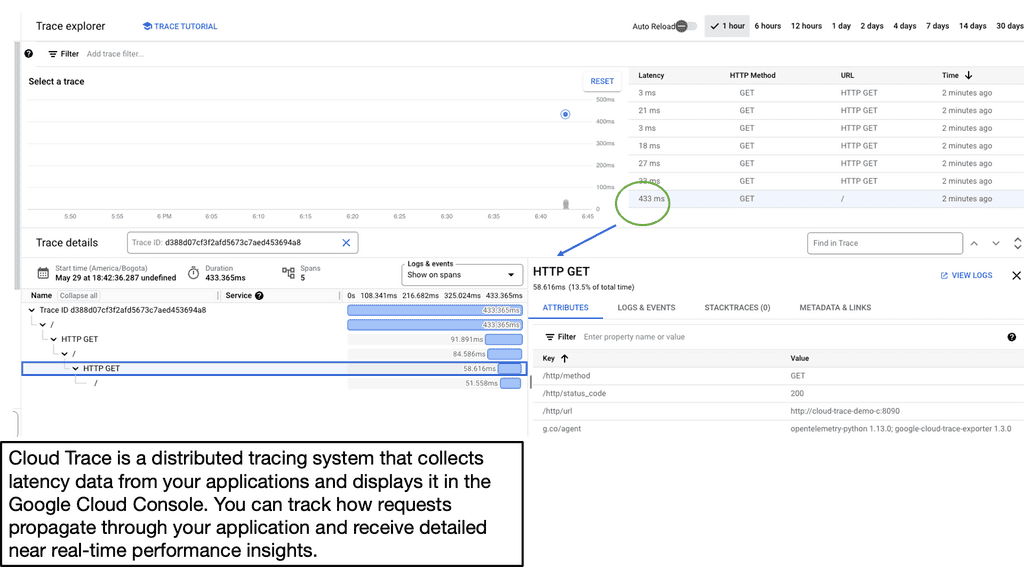
Latency, in the context of applications, refers to the time it takes for a request to travel from the user to the server and back. Various factors, such as network delays, server processing time, and database queries influence it. Understanding latency is essential for developers to identify bottlenecks and optimize their applications for better performance.
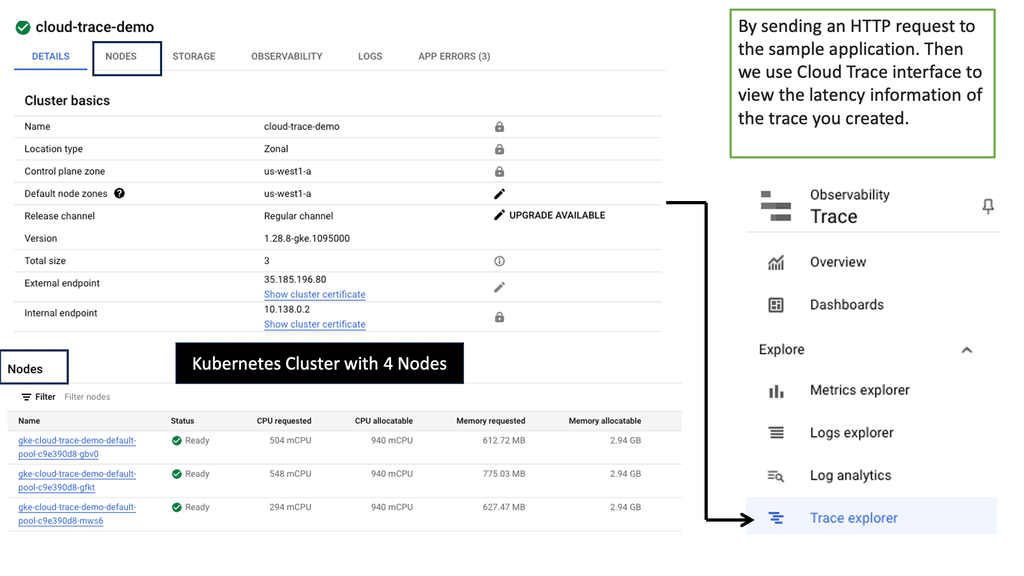
Google Cloud Trace is a powerful tool provided by Google Cloud Platform that allows developers to analyze and diagnose application latency issues. By integrating Cloud Trace into their applications, developers can gain valuable insights into their code’s performance and identify areas for improvement.
Developers need to capture traces to analyze application latency effectively. Traces provide a detailed record of a request’s execution path, allowing developers to pinpoint the exact areas where latency occurs. With Cloud Trace, developers can easily capture and visualize traces in a user-friendly interface.
Auto-scaling metrics: Issues with dashboards
Useful only for a few metrics
So, these metrics are gathered and stored in time-series databases, and we have several dashboards to display these metrics. These dashboards were first built, and there weren’t many system metrics to worry about. You could have gotten away with 20 or so dashboards. But that was about it.
As a result, it was easy to see the critical data anyone should know about for any given service. Moreover, those systems were simple and did not have many moving parts. This contrasts with modern services that typically collect so many metrics that fitting them into the same dashboard is impossible.
Issues with aggregate metrics
So, we must find ways to fit all the metrics into a few dashboards. Here, the metrics are often pre-aggregated and averaged. However, the issue is that the aggregate values no longer provide meaningful visibility, even when we have filters and drill-downs. Therefore, we need to predeclare conditions that describe conditions we expect in the future.
This is where we use instinctual practices based on past experiences and rely on gut feeling. Remember the network and software hero? It would help to avoid aggregation and averaging within the metrics store. On the other hand, we have percentiles that offer a richer view. Keep in mind, however, that they require raw data.
**Auto Scaling Observability: Any Question**
A: ) For auto-scaling observability, we take on an entirely different approach. They strive for other exploratory methods to find problems. Essentially, those operating observability systems don’t sit back and wait for an alert or something to happen. Instead, they are always actively looking and asking random questions to the observability system.
B: ) Observability tools should gather rich telemetry for every possible event, having full content of every request and then being able to store it and query it. In addition, these new auto-scaling observability tools are specifically designed to query against high-cardinality data. High cardinality allows you to interrogate your event data in any arbitrary way that we see fit. Now, we ask any questions about your system and inspect its corresponding state.
**No predictions in advance**
C: ) Due to the nature of modern software systems, you want to understand any inner state and services without anticipating or predicting them in advance. For this, we need to gain valuable telemetry and use some new tools and technological capabilities to gather and interrogate this data once it has been collected. Telemetry needs to be constantly gathered in flexible ways to debug issues without predicting how failures may occur.
D: ) Conditions affecting infrastructure health change infrequently and are relatively more straightforward to monitor. In addition, we have several well-established practices to predict, such as capacity planning and the ability to remediate automatically, e.g., auto-scaling in a Kubernetes environment. All of these can be used to tackle these types of known issues.
E: ) Due to its relatively predictable and slowly changing nature, the aggregated metrics approach monitors and alerts perfectly for infrastructure problems. So here, a metric-based system works well. Metrics-based systems and their associated signals help you see when capacity limits or known error conditions of underlying systems are being reached.
F: ) So, metrics-based systems work well for infrastructure problems that don’t change much but fall dramatically short in complex distributed systems. For these systems, you should opt for an observability and controllability platform.