
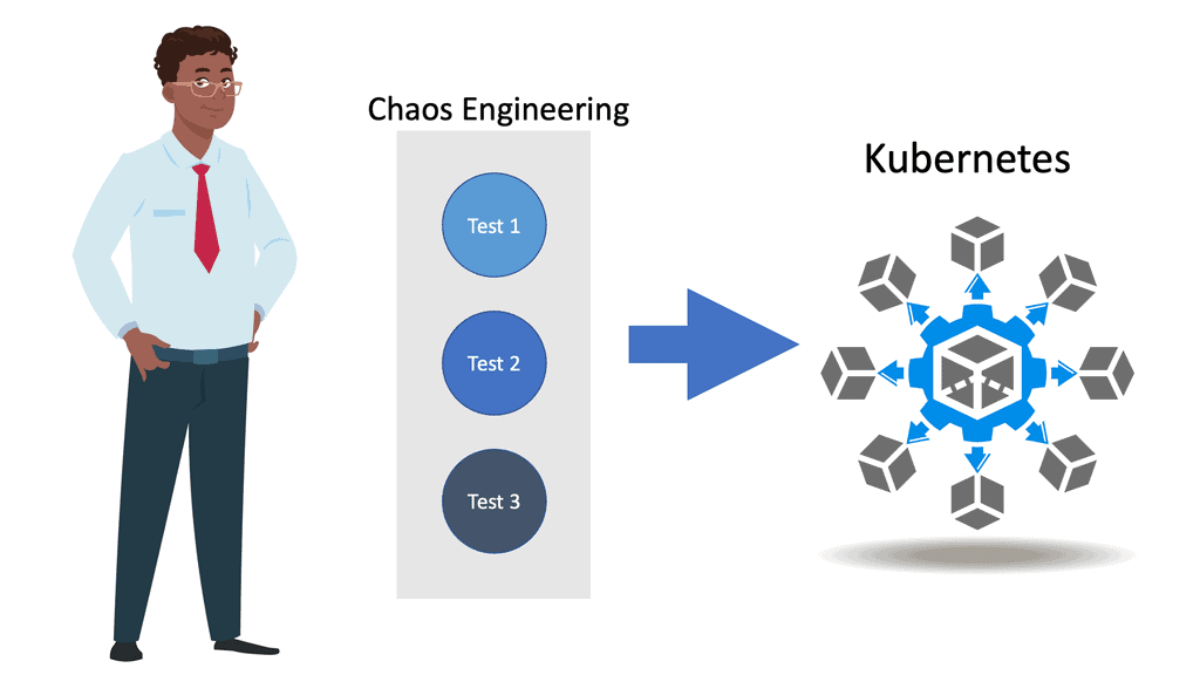
The Principles of Chaos Engineering
Chaos Engineering is grounded in several core principles. First, it is about embracing failure as a learning opportunity. By simulating failures, teams can understand how their systems react under stress. Another principle is to conduct experiments in a controlled environment, ensuring any disruptions do not affect end users. Lastly, Chaos Engineering emphasizes continuous learning and improvement, turning insights from experiments into actionable changes.
**Tools and Techniques**
Implementing chaos engineering requires a robust set of tools and techniques to simulate real-world disruptions effectively. Some popular tools in the chaos engineering toolkit include Chaos Monkey, Gremlin, and Litmus, each offering unique features to test system resilience. These tools enable engineers to automate experiments, analyze results, and derive actionable insights. By using these advanced tools, organizations can run experiments at scale and gain confidence in their systems’ ability to handle unpredictable events.
**Why Chaos Engineering Matters**
Modern systems are complex and often distributed across multiple platforms and services. This complexity makes it difficult to predict how systems will behave under unexpected conditions. Chaos Engineering allows teams to identify hidden vulnerabilities, improve system reliability, and enhance user experience. Companies like Netflix and Amazon have successfully used Chaos Engineering to maintain their competitive edge by ensuring their services remain robust and available.
**The Traditional Application**
When considering Chaos Engineering kubernetes, we must start from the beginning. Not too long ago, applications ran in single private data centers, potentially two data centers for high availability. These data centers were on-premises, and all components were housed internally. Life was easy, and troubleshooting and monitoring any issues could be done by a single team, if not a single person, with predefined dashboards. Failures were known, and there was a capacity planning strategy that did not change too much, and you could carry out standard dropped packet test
**A Static Infrastructure**
The network and infrastructure had fixed perimeters and were pretty static. There weren’t many changes to the stack, for example, daily. Agility was at an all-time low, but that did not matter for the environments in which the application and infrastructure were housed. However, nowadays, we are in a completely different environment with many more moving parts with an increasing need to support a reliable distributed system.
Complexity is at an all-time high, and business agility is critical. Now, we have distributed applications with components/services located in many different places and types of places, on-premises and in the cloud, with dependencies on both local and remote services. So, in this land of complexity, we must find system reliability. A reliable system is one that you can trust will be reliable.
Chaos Engineering in Kubernetes — Designing for Failure in Cloud‑Native Systems
Chaos engineering in Kubernetes is the discipline of intentionally injecting failure into clusters to validate resilience, uncover hidden weaknesses, and ensure workloads behave correctly under stress. Instead of waiting for outages, chaos engineering forces the system to experience them in a controlled, observable way. Kubernetes is a perfect environment for chaos experiments because it is inherently dynamic, distributed, and built around self‑healing primitives.
Why Chaos Engineering Matters in Kubernetes
Kubernetes abstracts infrastructure, but abstraction hides failure. Chaos engineering exposes how workloads behave when:
- nodes crash
- pods restart unexpectedly
- network latency spikes
- storage becomes slow or unavailable
- API server becomes overloaded
- autoscaling triggers aggressively
- controllers misbehave
Chaos engineering ensures your cluster is resilient by design, not by assumption.
Core Principles of Kubernetes Chaos Engineering
Chaos engineering in Kubernetes follows four foundational principles:
1. Define Steady State
You must know what “normal” looks like.
Examples:
- p99 latency under 200ms
- error rate < 1%
- CPU usage < 70%
- pods healthy and ready
Steady state becomes the baseline for evaluating chaos impact.
2. Introduce Realistic Failure
Chaos experiments should mimic real‑world failures:
- node shutdown
- pod eviction
- network partition
- DNS failure
- container crash loops
- storage throttling
Chaos must be representative, not random.
3. Observe System Behavior
Use Kubernetes observability tools:
- Prometheus metrics
- Loki logs
- Jaeger/Tempo traces
- Kiali (service mesh)
- OpenTelemetry pipelines
Chaos without observability is just destruction.
4. Improve and Repeat
Chaos engineering is iterative.
Each experiment reveals weaknesses that must be fixed, validated, and re‑tested.
Common Chaos Experiments in Kubernetes
Here are the most valuable chaos tests for real‑world clusters:
1. Pod Kill / Pod Restart
Simulates container crashes.
Validates:
- readiness/liveness probes
- retry logic
- graceful shutdown
- autoscaling behavior
2. Node Failure / Node Drain
Simulates hardware failure or maintenance.
Validates:
- pod rescheduling
- replica distribution
- disruption budgets
- cluster autoscaler behavior
3. Network Latency / Packet Loss
Simulates degraded network conditions.
Validates:
- microservices resilience
- timeout handling
- circuit breakers
- service mesh routing
4. API Server Stress
Simulates control‑plane overload.
Validates:
- controller stability
- admission webhook behavior
- cluster responsiveness
5. Storage Throttling / Volume Detach
Simulates slow or failing storage.
Validates:
- database failover
- persistent volume resilience
- application retry logic
6. Service Mesh Failure
Simulates sidecar or proxy issues.
Validates:
- fallback routing
- mesh control‑plane resilience
- degraded mode behavior
Chaos Engineering + Kubernetes Operators
Operators automate application lifecycle management.
Chaos engineering validates operator logic:
- reconciliation loops
- state recovery
- CRD consistency
- failover automation
If an operator cannot recover state after chaos, it is not production‑ready.
Chaos Engineering for Security
Chaos engineering can also test security controls:
- RBAC misconfigurations
- network policy gaps
- pod escape attempts
- privilege escalation
- secret rotation failures
Security chaos engineering ensures Zero Trust principles hold under stress.
Tools for Kubernetes Chaos Engineering
Popular tools include:
- LitmusChaos — CNCF project for Kubernetes chaos workflows
- Chaos Mesh — powerful, Kubernetes‑native chaos platform
- Gremlin — enterprise chaos engineering suite
- Kube‑Monkey — pod‑kill chaos inspired by Netflix’s Chaos Monkey
These tools integrate with CI/CD pipelines, allowing chaos tests to run automatically.
Outcome — A Resilient, Self‑Healing Kubernetes Platform
Chaos engineering ensures Kubernetes workloads:
- survive node failures
- recover from pod crashes
- tolerate network degradation
- handle storage instability
- maintain service reliability
- enforce security under stress
Chaos engineering transforms Kubernetes from “works in ideal conditions” to “works under real‑world failure.”
Implementing Chaos Engineering
Implementing Chaos Engineering involves several steps. First, start by defining a “steady state” of your system’s normal operations. Next, develop hypotheses about potential failure points and design experiments to test these. Use tools like Chaos Monkey or Gremlin to introduce controlled disruptions and observe the outcomes. Finally, analyze the results and apply any necessary changes to improve system resilience.
Challenges and Considerations
While Chaos Engineering offers many benefits, it also presents challenges. Resistance from stakeholders who are wary of intentional disruptions can be a hurdle. Additionally, ensuring that experiments are conducted safely and do not impact customers is crucial. To overcome these challenges, it’s important to foster a culture of transparency, continuous learning, and collaboration among teams.
Benefits of Chaos Engineering in Kubernetes:
1. Enhanced Reliability: By subjecting Kubernetes deployments to controlled failures, Chaos Engineering helps organizations identify weak points and vulnerabilities, enabling them to build more resilient systems that can withstand unforeseen events.
2. Improved Incident Response: Chaos Engineering allows organizations to test and refine their incident response processes by simulating real-world failures. This helps teams understand how to quickly detect and mitigate potential issues, reducing downtime and improving the overall incident response capabilities.
3. Cost Optimization: Chaos engineering can help optimize resource utilization within a Kubernetes cluster by identifying and addressing performance bottlenecks and inefficient resource allocation. This, in turn, leads to cost savings and improved efficiency.
Personal Note: Today’s standard explanation for Chaos Engineering is “The facilitation of experiments to uncover systemic weaknesses.” The following is true for Chaos Engineering.
- Begin by defining “steady state” as some measurable output of a system that indicates normal behavior.
- Hypothesize that this steady state will persist in both the control and experimental groups.
- Submit variables that mirror real-world events like servers that crash, hard drives that malfunction, severed network connections, etc.
- Then, as a final step, try to disprove the hypothesis by looking for a steady-state difference between the control and experimental groups.
Chaos Engineering Scenarios in Kubernetes:
Chaos Engineering in Kubernetes involves deliberately introducing failures into the system to observe how it behaves and recovers. This proactive approach enables teams to understand the system’s response to unexpected disruptions, whether it’s a pod failure, network latency, or a node shutdown.
**Implementing Chaos Experiments in Kubernetes**
To harness the full potential of Chaos Engineering, it’s essential to implement chaos experiments thoughtfully. Start by identifying critical components of your Kubernetes cluster that need testing. Tools like LitmusChaos and Chaos Mesh provide a framework for defining and executing chaos experiments. These experiments simulate disruptions such as pod deletions, CPU stress, and network partitioning, allowing teams to evaluate system behavior and improve fault tolerance.
**Chaos Engineering Kubernetes**
1. Pod Failures: Simulating failures of individual pods within a Kubernetes cluster allows organizations to evaluate how the system responds to such events. By randomly terminating pods, Chaos Engineering can help ensure that the system can handle pod failures gracefully, redistributing workload and maintaining high availability.
2. Network Partitioning: Introducing network partitioning scenarios can help assess the resilience of a Kubernetes cluster. By isolating specific nodes or network segments, Chaos Engineering enables organizations to test how the group reacts to network disruptions and evaluate the effectiveness of load balancing and failover mechanisms.
3. Resource Starvation: Chaos Engineering can simulate resource scarcity scenarios by intentionally consuming excessive resources, such as CPU or memory, within a Kubernetes cluster. This allows organizations to identify potential performance bottlenecks and optimize resource allocation strategies.
Understanding GKE-Native Monitoring
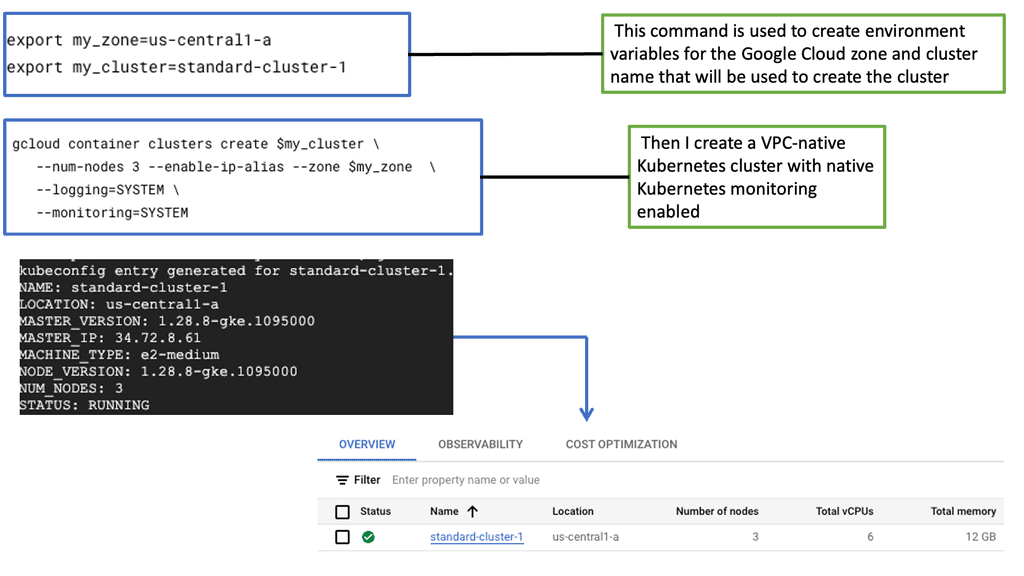
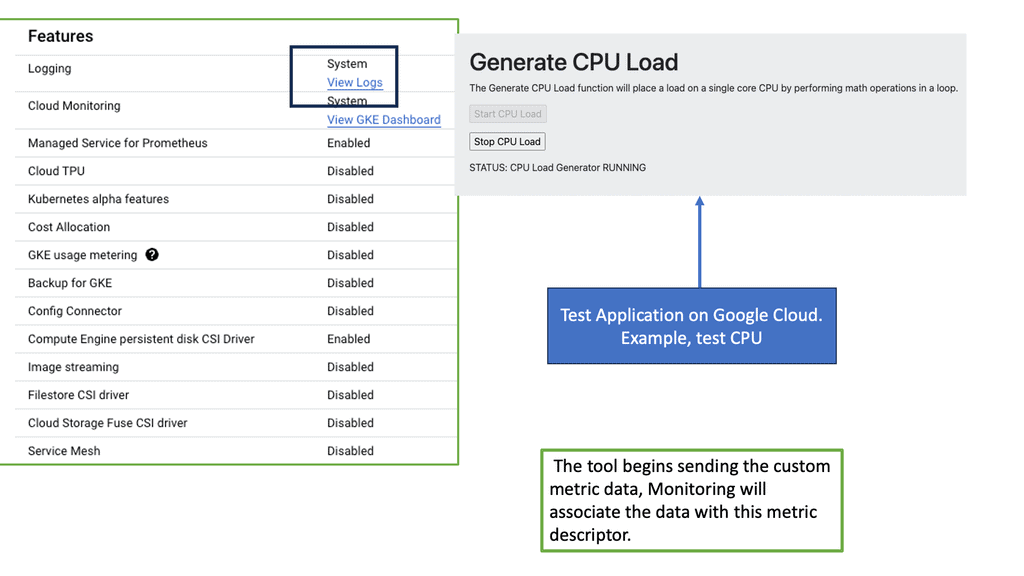
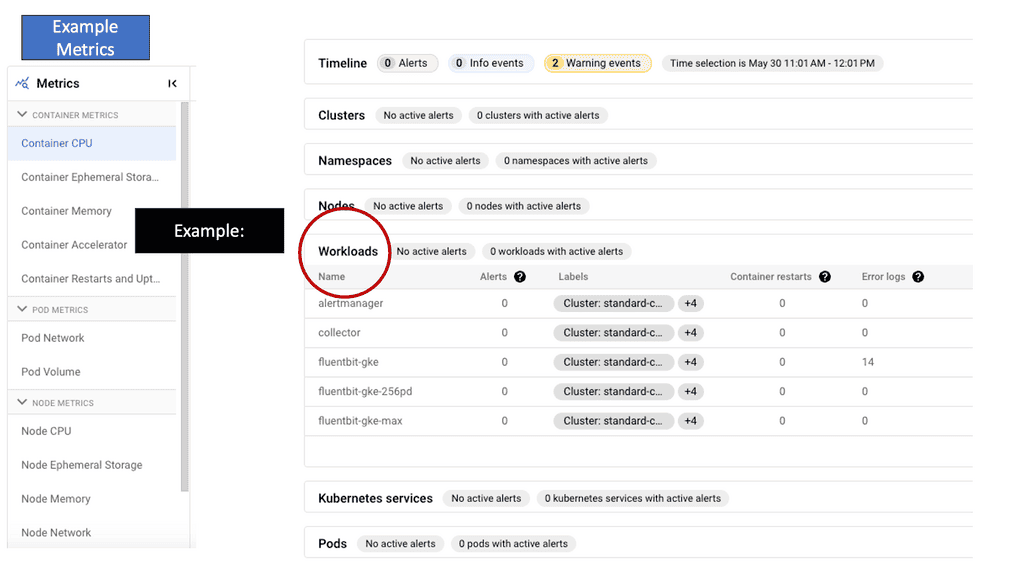
GKE-Native Monitoring is a comprehensive solution designed for Google Kubernetes Engine (GKE). It empowers developers and operators with real-time insights into the health and performance of their Kubernetes clusters, pods, and containers. Leveraging the power of Prometheus, GKE-Native Monitoring offers a wide range of monitoring metrics, such as CPU and memory utilization, network traffic, and custom application metrics.
GKE-Native Monitoring: Features
GKE-Native Monitoring boasts several key features that enhance observability and troubleshooting capabilities. One notable feature is the ability to create custom dashboards, enabling users to visualize and analyze critical metrics tailored to their needs. GKE-Native Monitoring integrates seamlessly with Stackdriver, Google Cloud’s unified monitoring and logging platform, allowing for centralized management and alerting across multiple GKE clusters.
The Rise of Chaos Engineering
Infrastructure is becoming increasingly complex, and let’s face it, a lot can go wrong. It’s imperative to have a global view of all the infrastructure components and a good understanding of the application’s performance and health. In a large-scale container-based application design, there are many moving pieces and parts, and trying to validate the health of each piece manually is hard.
With these new environments, especially cloud-native at scale. Complexity is at its highest, and many more things can go wrong. For this reason, you must prepare as much as possible so the impact on users is minimal.
So, the dynamic deployment patterns you get with frameworks with Kubernetes allow you to build better applications. But you need to be able to examine the environment and see if it is working as expected. Most importantly, this course’s focus is that to prepare effectively, you need to implement a solid strategy for monitoring in production environments.
Chaos Engineering Kubernetes
For this, you need to understand practices and tools like Chaos Engineering and how they can improve the reliability of the overall system. Chaos Engineering is the ability to perform tests in a controlled way. Essentially, we intentionally break things to learn how to build more resilient systems.
So, we are injecting faults in a controlled way to make the overall application more resilient by injecting various issues and faults. It comes down to a trade-off and your willingness to accept it. There is a considerable trade-off with distributed computing. You have to monitor efficiently, have performance management, and, more importantly, accurately test the distributed system in a controlled manner.
Service Mesh Chaos Engineering
Service Mesh is an option to use to implement Chaos Engineering. You can also implement Chaos Engineering with Chaos Mesh, a cloud-native Chaos Engineering platform that orchestrates tests in the Kubernetes environment. The Chaos Mesh project offers a rich selection of experiment types. Here are the choices, such as the POD lifecycle test, network test, Linux kernel, I/O test, and many other stress tests.
Implementing practices like Chaos Engineering will help you understand and manage unexpected failures and performance degradation. The purpose of Chaos Engineering is to build more robust and resilient systems.
Cloud Service Mesh:
### The Role of Cloud Service Mesh in Modern Architecture
Traditional monolithic applications are being replaced by microservices architectures, which break down applications into smaller, independent services. While this shift offers numerous benefits such as scalability and flexibility, it also introduces complexities in managing the interactions between these services. This is where a Cloud Service Mesh comes into play. It provides a structured method to handle service discovery, load balancing, failure recovery, metrics, and monitoring without adding heavy burdens to the developers.
### Google’s Pioneering Efforts in Cloud Service Mesh
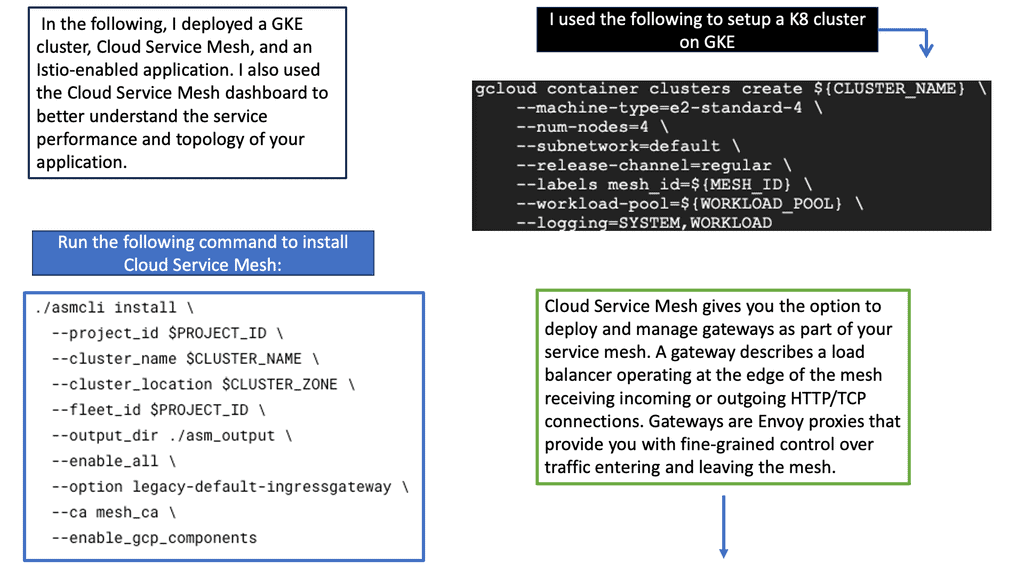
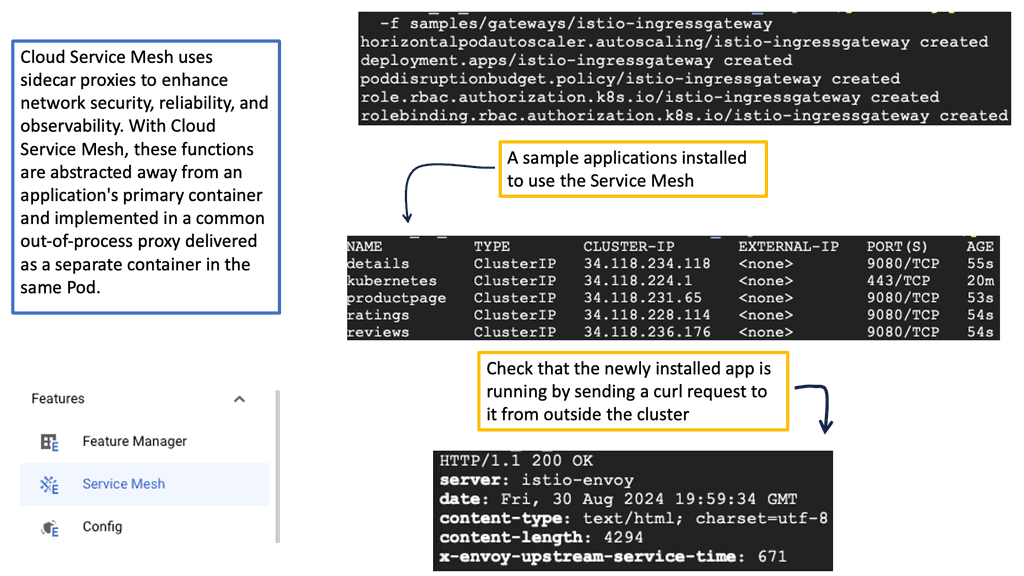
Google has been at the forefront of cloud innovation, and its contributions to the development of Cloud Service Mesh technologies are no exception. Through its open-source project Istio, Google has provided a robust framework for managing microservices.
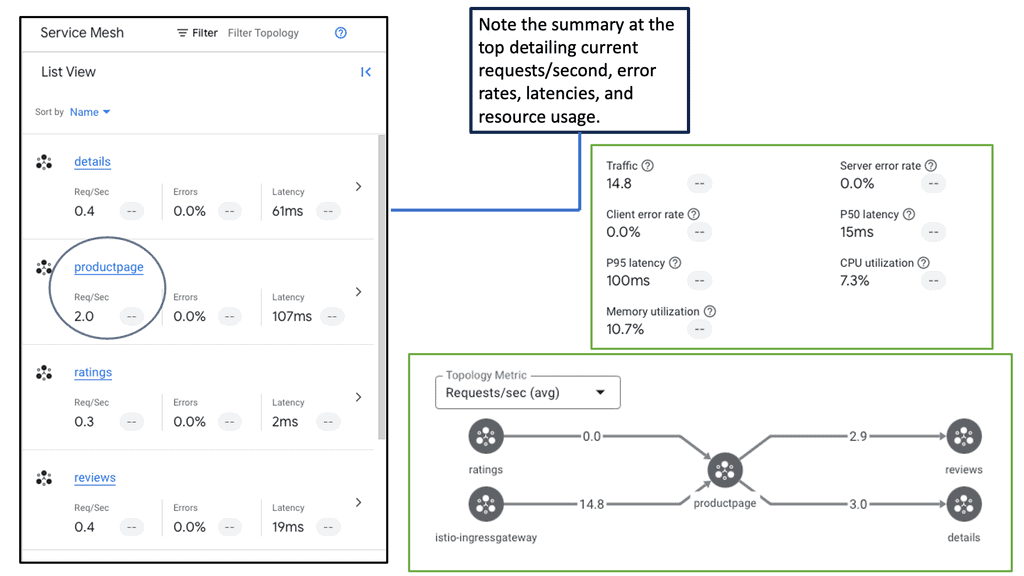
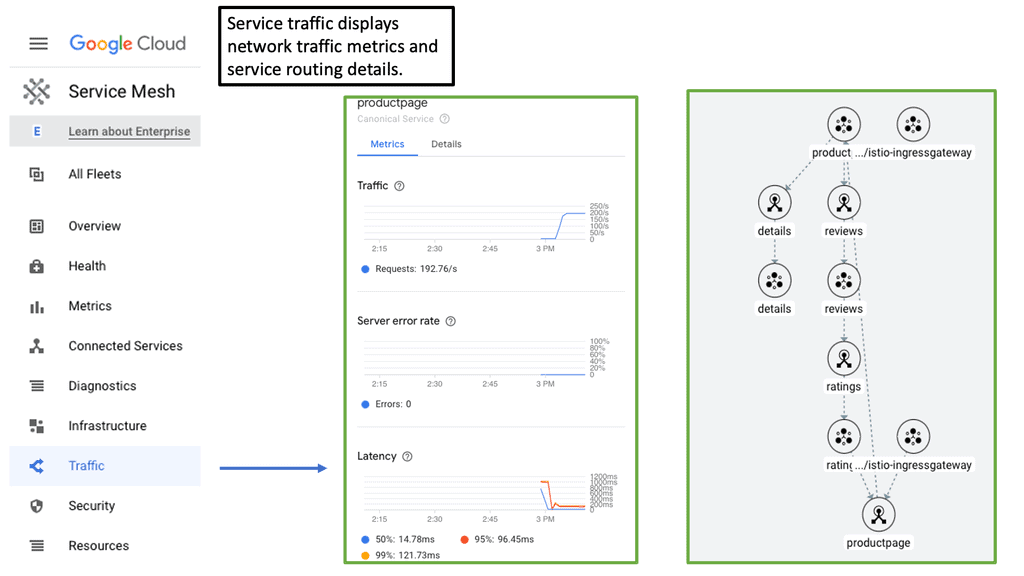
Istio simplifies the observability, security, and management of microservices, making it easier for enterprises to adopt and scale their cloud-native applications. By integrating Istio with their Google Kubernetes Engine (GKE), Google has made it seamless for organizations to deploy and manage their service meshes.
### Enhancing Reliability with Chaos Engineering
One of the most intriguing aspects of utilizing a Cloud Service Mesh is its ability to enhance system reliability through Chaos Engineering. This practice involves intentionally injecting faults into the system to test its resilience and identify potential weaknesses.
By simulating real-world failures, organizations can better prepare for unexpected issues and ensure their services remain robust under pressure. The granular control provided by a Cloud Service Mesh makes it an ideal platform for implementing Chaos Engineering practices, helping to create more resilient and dependable cloud environments.
Monitoring & Troubleshooting
Beyond the Complexity Horizon
Therefore, monitoring and troubleshooting are much more demanding, as everything is interconnected, making it difficult for a single person in one team to understand what is happening entirely. The edge of the network and application boundary surpasses one location and team. Enterprise systems have gone beyond the complexity horizon, and you can’t understand every bit of every single system.
Even if you are a developer closely related to the system and truly understand the nuts and bolts of the application and its code, no one can understand every bit of every single system. So, finding the correct information is essential, but once you see it, you have to give it to those who can fix it. So monitoring is not just about finding out what is wrong; it needs to alert, and these alerts need to be actionable.
Troubleshooting: Chaos engineering kubernetes
– Chaos Engineering aims to improve a system’s reliability by ensuring it can withstand turbulent conditions. Chaos Engineering makes Kubernetes more secure. So, if you are adopting Kubernetes, you should adopt Chaos Engineering as an integral part of your monitoring and troubleshooting strategy.
– Firstly, we can pinpoint the application errors and understand, at best, how these errors arose. This could be anything from badly ordered scripts on a web page to a database query that has bad sequel calls or even unoptimized code-level issues.
– Or there could be something more fundamental going on. It is expected to have issues with how something is packaged into a container. You can pull in the incorrect libraries or even use a debug version of the container.
– Or there could be nothing wrong with the packaging and containerization of the container; it is all about where the container is being deployed. There could be something wrong with the infrastructure, either a physical or logical problem—incorrect configuration or a hardware fault somewhere in the application path.
**Non-ephemeral and ephemeral services**
With the introduction of containers and microservices observability, monitoring solutions need to manage non-ephemeral and ephemeral services. We are collecting data for applications that consist of many different benefits.
So when it comes to container monitoring and performing chaos engineering kubernetes tests, we need to understand the nature and the full application that lies upon it. Everything is dynamic by nature. It would be best if you had monitoring and troubleshooting in place that can handle the dynamic and transient nature. When monitoring a containerized infrastructure, you should consider the following.
A: Container Lifespan: Containers have a short lifespan; they are provisioned and commissioned based on demand. This is compared to VMs or bare-metal workloads, which generally have a longer lifespan. As a generic guideline, containers have an average lifespan of 2.5 days, while traditional and cloud-based VMs have an average lifespan of 23 days. Containers can move, and they do move frequently.
One day, we could have workload A on cluster host A, and the next day or even on the same day, the same cluster host could be hosting Application workload B. Therefore, different types of impacts could depend on the time of day.
B: Containers are Temporary: Containers are dynamically provisioned for specific use cases temporarily. For example, we could have a new container based on a specific image. New network connections, storage, and any integrations to other services that make the application work will be set up for that container. All of this is done dynamically and can be done temporarily.
Example: Orchestration with Docker Swarm
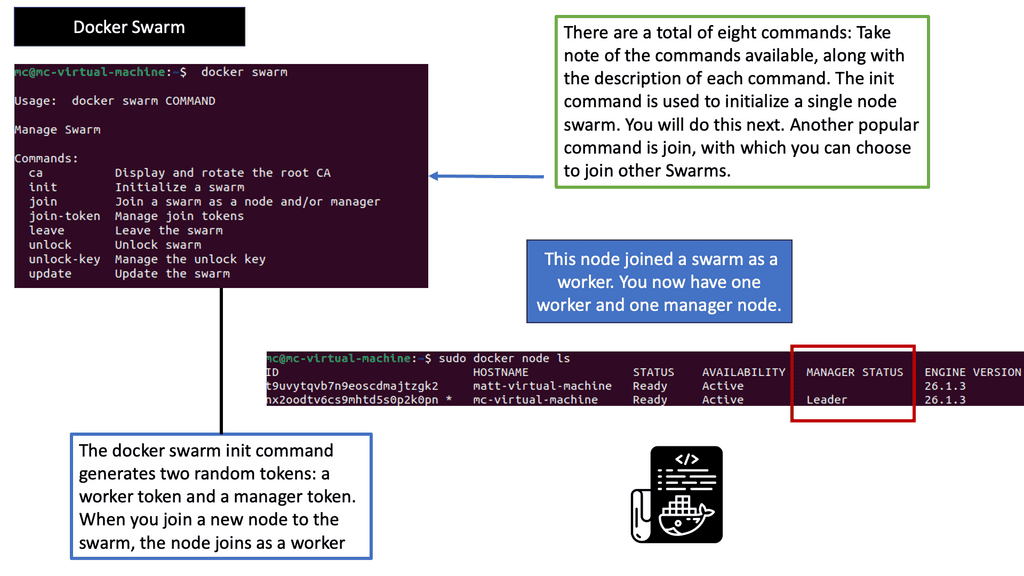
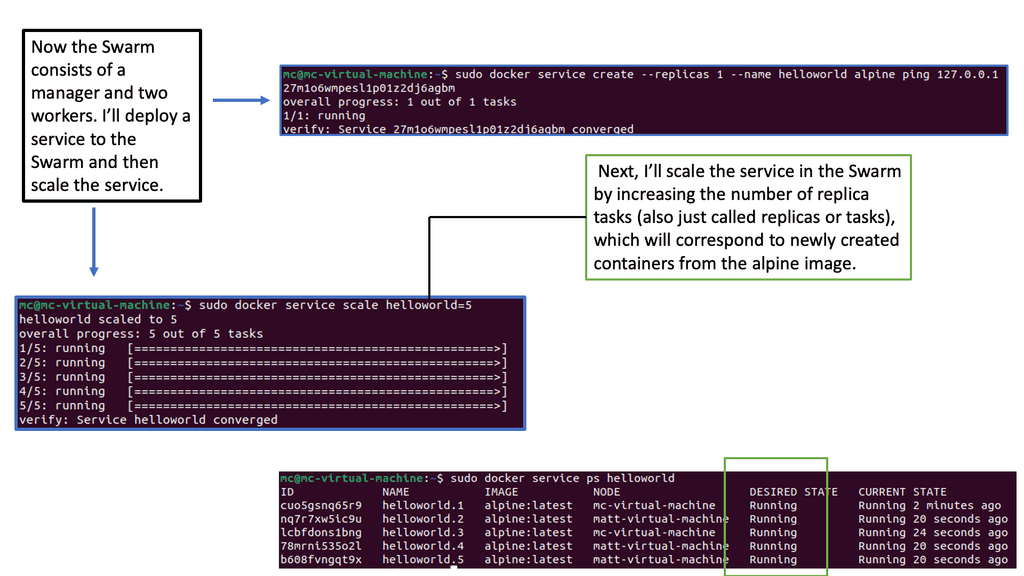
C: Different monitoring levels: In a Kubernetes environment, there are many monitoring levels. The components that make up the Kubernetes deployment will affect application performance. We have nodes, pods, and application containers. We also monitor at different levels, such as the VM, storage, and microservice levels.
D: Microservices change fast and often: Microservices consist of constantly evolving apps. New microservices are added, and existing ones are decommissioned quickly. So, what does this mean to usage patterns? This will result in different usage patterns on the infrastructure. If everything is often changing, it can be hard to derive the baseline and build a topology map unless you have something automatic in place.
E: Metric overload: We now have loads of metrics, including additional metrics for the different containers and infrastructure levels. We must consider metrics for the nodes, cluster components, cluster add-on, application runtime, and custom application metrics. This is compared to a traditional application stack, where we use metrics for components such as the operating system and the application.
Metric Explosion
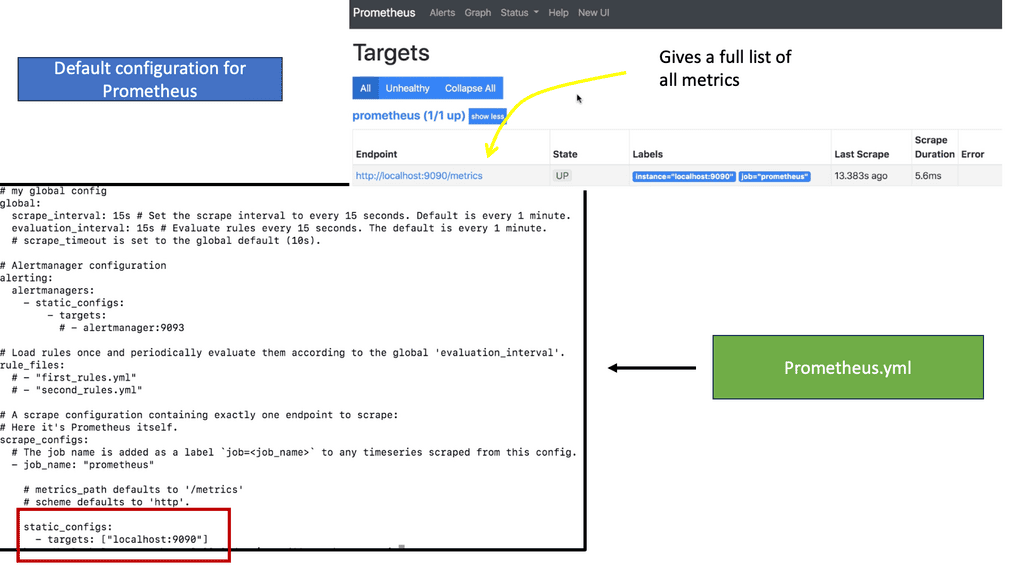
Note: Prometheus Scrapping Metrics
In the traditional world, we didn’t have to be concerned with the additional components such as an orchestrator or the dynamic nature of many containers. With a container cluster, we must consider metrics from the operating system, application, orchestrator, and containers. We refer to this as a metric explosion. So now we have loads of metrics that need to be gathered. There are also different ways to pull or scrape these metrics.
Prometheus is expected in the world of Kubernetes and uses a very scalable pull approach to getting those metrics from HTTP endpoints either through Prometheus client libraries or exports.
**A key point: What happens to visibility**
So, we need complete visibility now more than ever—not just for single components but visibility at a holistic level. Therefore, we need to monitor a lot more data points than we had to in the past. We need to monitor the application servers, Pods and containers, clusters running the containers, the network for service/pod/cluster communication, and the host OS.
All of the monitoring data needs to be in a central place so trends can be seen and different queries to the data can be acted on. Correlating local logs would be challenging in a sizeable multi-tier application with docker containers. We can use Log forwarders or Log shippers, such as FluentD or Logstash, to transform and ship logs to a backend such as Elasticsearch.
**A key point: New avenues for monitoring**
Containers are the norm for managing workloads and adapting quickly to new markets. Therefore, new avenues have opened up for monitoring these environments. So we have, for example, AppDynamics and Elastic search, which are part of the ELK stack, and the various log shippers that can be used to help you provide a welcome layer of unification. We also have Prometheus to get metrics. Keep in mind that Prometheus works only in the land of metrics. There will be different ways to visualize all this data, such as Grafana and Kibana.
Distributed Systems Visbility
What happens to visibility? We need complete visibility now more than ever, not just for single components but at a holistic level. Therefore, we need to monitor a lot more data points than we had to in the past. We need to monitor the application servers, Pods and containers, clusters running the containers, the network for service/pod/cluster communication, and the host OS.
All of the monitoring data needs to be in a central place so trends can be seen and different queries to the data can be acted on. Correlating local logs would be challenging in a sizeable multi-tier application with docker containers. We can use Logforwarders or Log shippers, such as FluentD or Logstash, to transform and ship logs to a backend such as Elasticsearch.
Containers are the norm for managing workloads and adapting quickly to new markets. Therefore, new avenues have opened up for monitoring these environments. So, I have mentioned AppDynamics, Elastic search, which is part of the ELK stack, and the various log shippers that can be used to help you provide a layer of unification. We also have Prometheus. There will be different ways to visualize all this data, such as Grafana and Kibana.
A: – Microservices Complexity
With the wave towards microservices, we get the benefits of scalability and business continuity, but managing them is very complex. The monolith is much easier to manage and monitor. Also, as separate components, they don’t need to be written in the same language or toolkits, so you can mix and match different technologies.
This approach has a lot of flexibility, but we can increase latency and complexity. There are a lot more moving parts that will increase complexity.
We have, for example, reverse proxies, load balancers, firewalls, and other infrastructure support services. What used to be method calls or interprocess calls within the monolith host now go over the network and are susceptible to deviations in latency.
B: – Debugging Microservices
With the monolith, the application is simply running in a single process, and it is relatively easy to debug. Many traditional tooling and code instrumentation technologies have been built, assuming you have the idea of a single process. However, with microservices, we have a completely different approach with a distributed application.
Now, your application has multiple processes running in other places. The core challenge is trying to debug microservices applications.
So much of the tooling we have today has been built for traditional monolithic applications. So, there are new monitoring tools for these new applications, but there is a steep learning curve and a high barrier to entry. New tools and technologies such as distributed tracing and chaos engineering kubernetes are not the simplest to pick up on day one.
C: – Automation and monitoring
Automation comes into play with the new environment. With automation, we can do periodic checks not just on the functionality of the underlying components but also implement health checks of how the application performs. All can be automated for specific intervals or in reaction to certain events.
With the rise of complex systems and microservices, it is more important to have real-time performance monitoring and metrics that tell you how the systems behave. For example, what is the usual RTT, and how long can transactions occur under normal conditions?